2609 Bertha Ave · Flint, MI
Flood risk 1/10 · Minimal
- FEMA flood zone
- X (unshaded)
- Chance of flooding over 30 yrs
- 0.0%
- Est. flood insurance / yr
- $507 – $1,088
Fire risk 1/10 · Minimal
- Est. fire insurance / yr
- $784 – $1,456
Heat risk 2/10 · Minimal
- Hot days now (above 96°F)
- 7 days/yr
- Hot days in 30 yrs
- 15 days/yr
Wind risk 2/10 · Minimal
- Chance of severe wind over 30 yrs
- —
Air-quality risk 3/10 · Minor
- Unhealthy air days now
- 3 days/yr
- Unhealthy air days in 30 yrs
- 4 days/yr
Risk factors via First Street. Map © Google.
Why this score? — see what drove the B grade
The composite is a weighted blend of 9 inputs, each scored 0–100. Each bar is that input's sub-score; the figure is the points it added to the 100-point composite (weight × sub-score).
- Cash flow +30.0/30.0
- ARV discount +11.6/15.0
- 1% rule +10.0/10.0
- DSCR +10.0/10.0
- Livability +3.7/5.0
- Rent growth +2.5/5.0
- Condition / age +2.5/5.0
- Schools +1.7/10.0
- Appreciation +0.0/10.0
$36,900
🖨 Deal sheet (PDF) 📄 Offer letter ✓ Due diligence
Listing remarks MLS
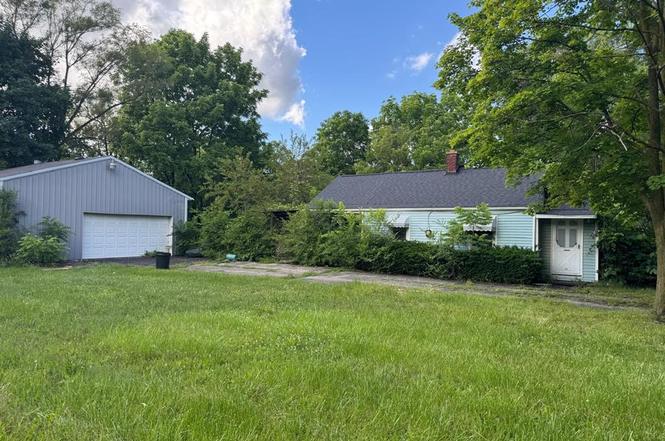
Investor Alert! Exceptional value-add opportunity with significant upside potential in desirable Flint Township and the Carman-Ainsworth School District. This 2-bedroom, 1-bath ranch sits on an oversized approximately 0.55-acre lot and presents a rare chance to acquire a property with strong after-repair value (ARV) potential. Comparable renovated homes in the area support a compelling investment thesis, making this an attractive opportunity for investors, flippers, and landlords alike. The home requires repairs and updates but offers a solid footprint and excellent foundation for renovation. With the right improvements, investors have the opportunity to unlock substantial equity and reposition the property for resale or long-term rental income. Large parcels of this size are increasingly difficult to find, adding additional value and flexibility for future use. Located in Flint Township with convenient access to I-75, Clio Road, shopping, dining, schools, parks, and major employers, the property benefits from strong demand and a highly desirable location. Whether your strategy is fix-and-flip, buy-and-hold, or BRRRR, this property offers the type of value-add potential investors are actively seeking. Property is being sold as-is. Buyer to verify all information, measurements, condition, and future intended use. Opportunities with this level of upside and potential ARV in Flint Township are becoming increasingly difficult to find. Novation: Buyer has equitable interest in the property and is marketing the property with the owner's authorization in order to locate a new buyer.
Key facts
- Oversized lot
- Excellent foundation
- 0.55 acre lot
Tags
Property features AI
Exterior
- Parking: Detached 2-car garage
- Utilities: Public water; Natural gas; Forced air heating
- Home design: Residential property; One-story structure; Built in 1951; Property faces the east side of the street (located on the east side of Bertha Ave)
- Construction: Vinyl exterior construction; Michigan-style basement foundation; Built in 1951
- Exterior features: Vinyl siding; Paved street access; Frontage approximately 100 feet; Lot acreage about 0.55 acres
Interior
- Kitchen: Kitchen (Entry level) — 8 x 10
- Bedrooms: Bedroom 1 (Entry level) — 10 x 11; Bedroom 2 (Entry level) — 8 x 10
- Bathrooms: 1 full bathroom (Entry level) — approx. 5 x 7
- Heating & cooling: Forced air heating; Natural gas fuel
- Interior features: Total of 5 rooms; Basement present
Neighborhood map
What this means for you Summary
Snapshot
- This is a 2-bed/1.0-bath single-family listed at $37k.
Deal economics
- At list price, monthly cash flow is $448 ($5k/yr) — positive.
- The deal already cash-flows at list — no discount required.
- Meets the 1% rule at list price ($888 rent vs $37k).
- Cap rate 20.9% vs local median 11.5% in Flint — top-decile yield for the area; either an underpriced asset or a hidden risk that comps aren't pricing in. Stress-test before assuming the spread holds.
Location & tenants
- Location reads 74/100 on livability (#196 in MI, #4,946 nationally) — a middle-class / working-renter tenant base. Strengths: commute A+, cost of living A+, housing A+; Watch: schools F, crime F, employment F.
- Carman-Ainsworth Community Schools (suburban): math 12% / reading 28% proficiency, ranked #468 of 540 in MI (top 87%) — low school quality limits family demand, transient renter base, plan for 1-2y turnover; 64% free/reduced lunch — lower-income household profile, screen leases tightly.
- Market conditions: 132 active listings in the ZIP; 10 comparable units currently listed for rent nearby; rentals lingering (median 45d on market — plan ~5-8 weeks vacancy on turnover, expect pricing pressure); 70% of comp listings sitting > 30 days — soft ceiling on asking rent; 419 units permitted in Genesee County in 2024 (68 in 5+ unit buildings).
Forward outlook
- Local home prices are declining (-3.0%/yr); year-one equity from $255 of loan paydown is wiped out by about $1k of value loss. Plan a longer hold.
- Genesee County population projected at -27% by 2050 — secular population decline; favor cash flow + early exit over multi-decade hold.
- At projected returns (-3.0% appreciation + 3.0% rent growth), your $10k cash investment doubles in ~3 years — after that, you're playing with house money.
Negotiation context
- Only 7 days on market — expect competitive offers; lowballing is unlikely to land.
- 2 sale attempts with the ask held roughly flat each time — persistent listings suggest the price (not the market) is what's stuck; bring a comps-based counter.
Risks & watch-outs
- Watch-outs: built in 1951 — expect roof / HVAC / electrical / plumbing capex.
Questions for the listing agent
- Built in 1951 — when were the roof, HVAC, electrical panel, plumbing, and water heater last replaced?
- Is there a deadline driving the sale (1031 exchange, divorce, estate, relocation)? That informs how much negotiation room exists.
- Schools are F-rated, which usually means shorter tenancies and higher turnover. Who's the typical renter profile here, and what's been the actual vacancy rate?
- Crime grade is F in this area — have there been break-ins, vandalism, or insurance claims at this property in the last 3 years? What carrier currently insures it and at what premium?
- What's the average days-on-market for RENTAL listings here right now (not sales)? A rising rental-DOM trend means longer vacancies and softer asking-rent achievability than the comps imply.
- What's the recent tenant-quality profile in this submarket — average credit score on applications, eviction rate, late-payment / NSF rate, and stable-employment percentage? A property-management company in the area should have these aggregated.
- How much new for-sale + rental construction is in the pipeline within 1–3 miles? Heavy new supply typically softens prices + rents 12–24 months out; constrained supply supports both.
Investment metrics
- 1% rule
- 2.41% ✓
- Cap rate
- 20.86%
- Cash-on-cash
- 52.03%
- DSCR
- 3.32
- GRM
- 3.5
CMA / ARV
- ARV (on-the-fly)
- $40,560
- Comps found
- 12
Show comp detail 12 sales within ~0.75 mi
| Address | Dist | Beds/Ba | Sqft | Sold | Price | $/sf | Match |
|---|---|---|---|---|---|---|---|
| 2495 Lavelle Rd | 0.24mi | 3/1.0 (+1) | 822 (-3%) | 6mo | $17,500 | $21 | 74 |
| 3143 Maywood Dr | 0.40mi | 3/1.0 (+1) | 882 (+4%) | 1mo | $35,000 | $40 | 68 |
| 3030 Mccollum Ave | 0.19mi | 2/1.0 | 960 (+14%) | 8mo | $28,000 | $29 | 61 |
| 3171 W Dartmouth St | 0.23mi | 2/1.0 | 730 (-14%) | 12mo | $58,000 | $79 | 57 |
| 3432 Concord St | 0.64mi | 2/1.0 | 910 (+8%) | 2mo | $47,000 | $52 | 56 |
| 2613 Brownell Blvd | 0.53mi | 3/1.0 (+1) | 911 (+8%) | 4mo | $78,000 | $86 | 54 |
| 2331 Welch Blvd | 0.55mi | 3/1.0 (+1) | 912 (+8%) | 7mo | $69,900 | $77 | 50 |
| 2713 Brownell Blvd | 0.49mi | 2/1.0 | 728 (-14%) | 5mo | $35,000 | $48 | 50 |
| 3221 Burgess St | 0.71mi | 2/1.0 | 755 (-11%) | 3mo | $15,900 | $21 | 47 |
| 3419 Leerda St | 0.58mi | 3/1.0 (+1) | 938 (+11%) | 4mo | $25,500 | $27 | 46 |
| 3501 Fleming Rd | 0.68mi | 2/1.0 | 764 (-10%) | 12mo | $25,000 | $33 | 43 |
| 1713 W Dartmouth St | 0.60mi | 3/1.0 (+1) | 720 (-15%) | 5mo | $69,900 | $97 | 38 |
Match score weights: distance 35% · size 25% · config 20% · recency 20%. Top-matched comps best support the ARV.
Projected returns pro-forma
-3.0% appreciation · 3.0% rent growth · sell at horizon
- IRR
- 50.0%
- Equity multiple
- 3.18×
- Total profit
- $22,568
- Equity at exit
- $5,502
- IRR
- 55.4%
- Equity multiple
- 6.46×
- Total profit
- $56,446
- Equity at exit
- $3,190
Cash invested: $10,332 (down + closing). Projections, not guarantees.
Landlord ↔ Tenant lean methodology
- Overall (STATE)
- 62 Landlord-Friendly
- State Michigan
- 62 Landlord-Friendly · EVEN
- County
- — inherits STATE
- City
- — inherits STATE
ZIP-level market 48504
- Active inventory
- 132
- Price-to-rent
- 3.5×
Monthly cashflow live
- Estimated rent
- $888 high interval (Pro) →
- Mortgage (P&I)
- −$194
- Tax from tax record
- −$45 /mo · $538/yr
- Insurance
- −$15
- HOA
- −$0
- Vacancy / Maint / Mgmt
- −$187
- Net cashflow
- $448
Break-even live
Sensitivity live
| Price | -10% $469 | -5% $458 | +0% $448 | +5% $438 | +10% $427 |
|---|---|---|---|---|---|
| Rent | -10% $378 | -5% $413 | +0% $448 | +5% $483 | +10% $518 |
| Rate | -1.0pp $467 | -0.5pp $457 | base $448 | +0.5pp $438 | +1.0pp $429 |
UW: 25.0% down · 7.5% · 30yr · 1.5% tax · 5.0% vac · 8.0% maint · 8.0% mgmt
Financing live
Cash to close
- Down payment
- $9,225
- Closing costs
- $1,107
- Reserves months
- —
- Total cash needed
- —
Loan-product check · same deal, 3 products live
Conventional
25% down · 7.5% · 30yr
- Down + closing
- —
- Monthly P&I
- —
- Monthly cashflow
- —
- DSCR
- —
- Eligible?
- —
Personal DTI + credit; lowest rate.
DSCR
20% down · 8.5% · 30yr
- Down + closing
- —
- Monthly P&I
- —
- Monthly cashflow
- —
- DSCR
- —
- Eligible?
- —
No personal income docs; deal must DSCR.
Hard money
10% down · 12.0% · 12mo
- Down + closing
- —
- Monthly P&I
- —
- Monthly cashflow
- —
- DSCR
- —
- Eligible?
- —
Short-term bridge; refi at stabilization.
Rent comps 10 comps
| Address | Beds | Baths | Sqft | Rent | $/sqft | DOM | Units | Dist |
|---|---|---|---|---|---|---|---|---|
| 2462 Gena Ann Ln Unit GEN2462 Flint, MI | 3.0 | 2.0 | 960 | $895 | $0.93 | 45d | 1 | 0.51mi |
| 2410 Gena Ann Ln Unit GEN2410 Flint, MI | 3.0 | 2.0 | 960 | $895 | $0.93 | 45d | 1 | 0.52mi |
| 2410 Gena Ann Ln Flint, MI | 3.0 | 2.0 | 960 | $895 | $0.93 | 45d | 1 | 0.52mi |
| 3376 Preston Pl Unit PRE3376 Flint, MI | 3.0 | 2.0 | 960 | $895 | $0.93 | 45d | 1 | 0.53mi |
| 3506 Brownell Blvd Flint, MI | 2.0 | 1.0 | 600 | $825 | $1.38 | 14d | 1 | 0.53mi |
| 2419 Gena Ann Ln Unit GEN2419 Flint, MI | 3.0 | 2.0 | 960 | $895 | $0.93 | 45d | 1 | 0.54mi |
| 3616 Concord St Unit CON3616 Flint, MI | 3.0 | 2.0 | 960 | $895 | $0.93 | 45d | 1 | 0.69mi |
| 2332 Fredonia Ave Unit FRE2332 Flint, MI | 3.0 | 2.0 | 960 | $895 | $0.93 | 45d | 1 | 0.70mi |
| 3221 Burgess St Flint, MI | 2.0 | 1.0 | 755 | $875 | $1.16 | 22d | 1 | 0.73mi |
| 711 W Dewey St Flint, MI | 3.0 | 1.0 | 1011 | $925 | $0.91 | 22d | 1 | 1.16mi |
Listing history 7 events
-
2026-06-21days on market $36,900 Active 7 DOM
-
2026-06-18days on market $36,900 Active 4 DOM
-
2026-06-17days on market $36,900 Active 3 DOM
-
2026-06-16days on market $36,900 Active 2 DOM
-
2026-06-15$36,900 Active 1 DOM
-
2026-06-15remarks 699-char remark
-
2026-06-15$36,900 Active 1 DOM
ⓘ Source: listings_history table (triggers on properties + properties_extension) + one-shot
backfill from property_details.listing_events for pre-trigger history.
Tax reassessment forecast MI · Partial reset (capped growth)
- Current annual tax
- $538 · $45/mo
- Projected year-2 tax
- $553 · $46/mo
- Expected delta
- +$15/yr (+$1/mo · 2.8%)
ⓘ Screening estimate from a state-policy table — verify with the county assessor before closing.
Climate risk First Street
- Flood 1/10 Low FEMA zone X (unshaded) · 0% chance over 30 yrs
- Wildfire 1/10 Low
- Heat 2/10 Low 7 d/yr ≥96°F today · 15 d/yr by 30 yrs out
- Wind 2/10 Low
- Air quality 3/10 Moderate 3 unhealthy d/yr today · 4 by 30 yrs out
Nearby sold comps map
Loading sold comps map…
Walkable amenities ~0.75 mi
Loading nearby amenities…
Taxation est. · year 1
- Rental income
- $10,659
- − Mortgage interest
- −$2,067
- − Property taxes
- −$538
- − Insurance
- −$184
- − Repairs & maintenance
- −$853
- − Management
- −$853
- − Depreciation
- −$1,073
- Taxable income
- $5,091
- Est. tax owed @ 24.0%
- −$1,222
- After-tax cash flow
- $4,154/yr
For passive investors: Depreciation is non-cash, so a rental often shows a tax loss while cash-flowing — sheltering income. Rental losses are passive: they offset passive income freely, and up to $25,000/yr can offset ordinary (W-2) income if you actively participate and your MAGI is under $100k (phasing out to $0 by $150k); unused losses carry forward. On sale, claimed depreciation is recaptured at up to 25%, and gains may owe capital-gains tax (a 1031 exchange can defer both). Figures are a year-1 estimate at your 24.0% rate — not tax advice; consult a CPA.
Schools (NCES district)
- District
- Carman-Ainsworth Community Schools
- NCES district ID
- 2607890
- Math proficiency
- 12% ▼ -14.00%
- Reading proficiency
- 28% ▼ -8.00%
- Median HH income
- $39,394
- Composite
- 16.84/100
- National rank
- #9149
- State rank
- #468 of 540 in MI
Livability — Flint
- Score
- 74/100
- State rank
- #196
- US rank
- #4946
Category grades
Schools grade is shown separately in the Schools card above.
Census & demographics
- City population
- 93,814
- Population (ZIP)
- 23,873
Population outlook (Genesee County) Hauer SSP2
- Today (2025)
- 381,312 people
- By 2030
- 362,731 · -4.9%
- By 2040
- 321,550 · -15.7%
- By 2050
- 279,212 · -26.8%
- By 2075
- 193,336 · -49.3%
- By 2100
- 128,118 · -66.4%
Race, ethnicity, and origin ACS 2023
- Neighborhood character
- Predominantly Black (66%)
- Race & ethnicity
- Black 66% White 24% Two or more races 6% Hispanic / Latino 5% Asian 1%
- Common ancestry
- Romanian 2% Lithuanian 1% Italian 1%
- Foreign-born
- 3% · Canada, China
- Languages at home
- 96% English-only · Spanish 2%
Political lean MEDSL · Genesee
- 2024 margin
- Toss-up / Even · D 51.4% · R 47.2% · Other 1.4%
- 2008→2024 swing
- -28.3pp toward R · 2008: 32.5pp · 2024: 4.2pp
- All cycles
- 2024: D+4.2 2020: D+9.3 2016: D+9.5 2012: D+28.2 2008: D+32.5
Not yet ingested
- Civics
- —
Market trends
- HPI YoY
- ▼ -101.67%
- Current HPI
- 94.3111
- Rent YoY
- —
- Metro
- —
- State GDP YoY
- ▲ 1.37%
- F500 in state
- 28
Industry mix (Fortune 500 HQ in MI)
| Industry | F500 HQs | Revenue |
|---|---|---|
| Automotive Parts | 3 | $48B |
|
||
| Automotive | 2 | $372B |
|
||
| Chemicals | 1 | $45B |
|
||
| Automotive Retail | 1 | $29B |
|
||
| Healthcare / Medical Devices | 1 | $23B |
|
||
| Automotive Technology | 1 | $20B |
|
||
Price history
+0.0% since first listed2 events — show timeline
- 2026-06-14 Listed $36,900 REALCOMP
- 2026-06-14 Listed $36,900 MiRealSource-MiMLS
Property tax history
-6.4%/yrLatest (2025): $538 · -56.2% YoY. Source: county tax records.
Cash-flow waterfall
monthlySold comps — $/sqft
last 12 mo · ≤1 miLoading sold comps…