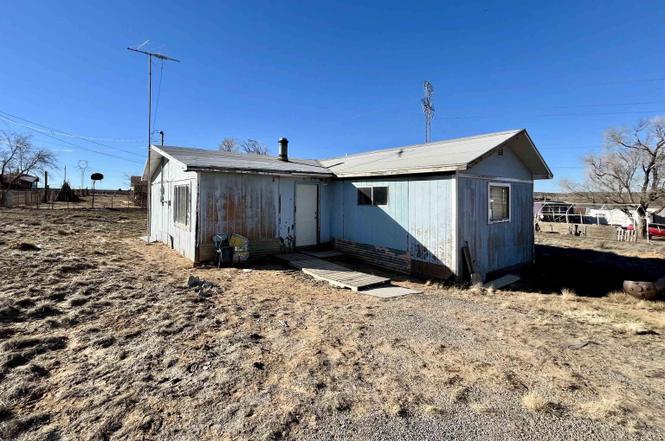
25 N Cle Ki Dr · Yah-ta-hey, NM
Flood risk 1/10 · Minimal
- FEMA flood zone
- X (unshaded)
- Chance of flooding over 30 yrs
- 0.0%
- Est. flood insurance / yr
- $507 – $1,088
Fire risk 4/10 · Minor
- Est. fire insurance / yr
- $706 – $1,312
Heat risk 3/10 · Minor
- Hot days now (above 89°F)
- 7 days/yr
- Hot days in 30 yrs
- 18 days/yr
Wind risk 1/10 · Minimal
- Chance of severe wind over 30 yrs
- —
Air-quality risk 1/10 · Minimal
- Unhealthy air days now
- 0 days/yr
- Unhealthy air days in 30 yrs
- 0 days/yr
Risk factors via First Street. Map © Google.
Why this score? — see what drove the B grade
The composite is a weighted blend of 9 inputs, each scored 0–100. Each bar is that input's sub-score; the figure is the points it added to the 100-point composite (weight × sub-score).
- Cash flow +30.0/30.0
- 1% rule +10.0/10.0
- DSCR +10.0/10.0
- ARV discount +7.5/15.0
- Appreciation +5.0/10.0
- Rent growth +2.5/5.0
- Livability +2.5/5.0
- Condition / age +2.5/5.0
- Schools +2.2/10.0
$75,000
🖨 Deal sheet (PDF) 📄 Offer letter ✓ Due diligence
Listing remarks
Just outside of Gallup, this quaint 2-bedroom, 1-bath home offers the kind of space and serenity that’s hard to find, set on a generous half-acre designed for both comfort and freedom. Tucked away in a quiet, private setting, the property invites you to slow down and enjoy the peace of open space while still being close enough to town for everyday convenience. Inside, two distinct living areas create flexibility for the way you live—whether that means a cozy spot to unwind, a separate space for entertaining, or room to work or create from home. Natural light and a warm, welcoming feel make the home easy to settle into and personalize. Outside, the fully fenced half-acre opens th
Key facts
- Parking for an rv
- Half acre
- Fully fenced
Tags
Property features AI
Finance
- Other: Horses allowed
Exterior
- Parking: No garage; RV access/parking
- Utilities: Electricity connected; Sewer connected
- Home design: Single family residence; One story
- Construction: Frame construction with wood siding
- Exterior features: Wire and wood fencing; Natural vegetation
Interior
- Flooring: Wood flooring
- Bathrooms: 1 full bathroom
- Heating & cooling: Wood stove heating
- Interior features: Aluminum-framed windows; Wood-burning stove fireplace (1)
Neighborhood map
What this means for you Summary
Snapshot
- This is a 2-bed/1.0-bath single-family listed at $75k.
Deal economics
- At list price, monthly cash flow is $391 ($5k/yr) — positive.
- The deal already cash-flows at list — no discount required.
- Meets the 1% rule at list price ($1k rent vs $75k).
- Recommended offer: $66k (12.0% below list) — sets the bar for market timing.
Location & tenants
- Location reads: area grade B — affects rentability + tenant quality, not the cash-flow math above.
- Gallup-Mckinley Cty Schools (rural): math 17% / reading 30% proficiency, ranked #54 of 95 in NM (top 57%) — low school quality limits family demand, transient renter base, plan for 1-2y turnover; 84% free/reduced lunch — lower-income household profile, screen leases tightly.
- Zoned schools: Tobe Turpen Elementary (390 students, 100% FRL); Chief Manuelito Middle (609 students, 100% FRL); Gallup High (961 students, 100% FRL) — zoned schools average 100% FRL vs 84% district-wide (16 pts higher); higher-poverty schools than district average — tighter screening recommended.
- Market conditions: 2 active listings in the ZIP; 1 units permitted in McKinley County in 2024 (0 in 5+ unit buildings).
Forward outlook
- In year one you build about $3k of equity ($519 loan paydown + $2k appreciation (3.0% local appreciation)).
- McKinley County population projected at +36% by 2050 — long-run rental-demand tailwind backs the buy-and-hold thesis.
- At projected returns (3.0% appreciation + 3.0% rent growth), your $21k cash investment doubles in ~3 years — after that, you're playing with house money.
Negotiation context
- It's been on market 191 days — a 12% lower offer ($66k) is reasonable based on typical stale-listing flexibility.
Questions for the listing agent
- It's been on market 191 days. Have you received any prior offers? Is the seller open to a 12% concession, seller financing, or rate buy-down credit?
- Built in 1977 — when were the roof, HVAC, electrical panel, plumbing, and water heater last replaced?
- Why hasn't it sold? Are there any deal-killer items the seller is aware of (foundation, flood, title, zoning, code violations)?
- Is there a deadline driving the sale (1031 exchange, divorce, estate, relocation)? That informs how much negotiation room exists.
- What's the average days-on-market for RENTAL listings here right now (not sales)? A rising rental-DOM trend means longer vacancies and softer asking-rent achievability than the comps imply.
- What's the recent tenant-quality profile in this submarket — average credit score on applications, eviction rate, late-payment / NSF rate, and stable-employment percentage? A property-management company in the area should have these aggregated.
- How much new for-sale + rental construction is in the pipeline within 1–3 miles? Heavy new supply typically softens prices + rents 12–24 months out; constrained supply supports both.
Investment metrics
- 1% rule
- 1.54% ✓
- Cap rate
- 12.55%
- Cash-on-cash
- 22.35%
- DSCR
- 1.99
- GRM
- 5.4
CMA / ARV
No comps found within radius.
Projected returns pro-forma
3.0% appreciation · 3.0% rent growth · sell at horizon
- IRR
- 28.6%
- Equity multiple
- 2.62×
- Total profit
- $33,969
- Equity at exit
- $33,723
- IRR
- 29.1%
- Equity multiple
- 5.10×
- Total profit
- $86,041
- Equity at exit
- $51,972
Cash invested: $21,000 (down + closing). Projections, not guarantees.
Landlord ↔ Tenant lean methodology
- Overall (STATE)
- 55 Moderately Landlord-Leaning
- State New Mexico
- 55 Moderately Landlord-Leaning · D+3
- County
- — inherits STATE
- City
- — inherits STATE
ZIP-level market 87375
- Active inventory
- 2
- Price-to-rent
- 5.4×
Monthly cashflow live
- Estimated rent
- $1,151 medium interval (Pro) →
- Mortgage (P&I)
- −$393
- Tax est. 1.5%
- −$94 /mo · $1,125/yr
- Insurance
- −$31
- HOA
- −$0
- Vacancy / Maint / Mgmt
- −$242
- Net cashflow
- $391
Break-even live
Sensitivity live
| Price | -10% $443 | -5% $417 | +0% $391 | +5% $365 | +10% $339 |
|---|---|---|---|---|---|
| Rent | -10% $300 | -5% $346 | +0% $391 | +5% $437 | +10% $482 |
| Rate | -1.0pp $429 | -0.5pp $410 | base $391 | +0.5pp $372 | +1.0pp $352 |
UW: 25.0% down · 7.5% · 30yr · 1.5% tax · 5.0% vac · 8.0% maint · 8.0% mgmt
Financing live
Cash to close
- Down payment
- $18,750
- Closing costs
- $2,250
- Reserves months
- —
- Total cash needed
- —
Loan-product check · same deal, 3 products live
Conventional
25% down · 7.5% · 30yr
- Down + closing
- —
- Monthly P&I
- —
- Monthly cashflow
- —
- DSCR
- —
- Eligible?
- —
Personal DTI + credit; lowest rate.
DSCR
20% down · 8.5% · 30yr
- Down + closing
- —
- Monthly P&I
- —
- Monthly cashflow
- —
- DSCR
- —
- Eligible?
- —
No personal income docs; deal must DSCR.
Hard money
10% down · 12.0% · 12mo
- Down + closing
- —
- Monthly P&I
- —
- Monthly cashflow
- —
- DSCR
- —
- Eligible?
- —
Short-term bridge; refi at stabilization.
Listing history 19 events
-
2026-06-22days on market $75,000 Active 191 DOM
-
2026-06-21days on market $75,000 Active 190 DOM
-
2026-06-21days on market $75,000 Active 189 DOM
-
2026-06-18days on market $75,000 Active 187 DOM
-
2026-06-17days on market $75,000 Active 186 DOM
-
2026-06-16days on market $75,000 Active 185 DOM
-
2026-06-15days on market $75,000 Active 184 DOM
-
2026-06-13days on market $75,000 Active 182 DOM
-
2026-06-12days on market $75,000 Active 181 DOM
-
2026-06-09days on market $75,000 Active 178 DOM
-
2026-06-08days on market $75,000 Active 177 DOM
-
2026-06-07days on market $75,000 Active 176 DOM
-
2026-06-07days on market $75,000 Active 175 DOM
-
2026-06-04days on market $75,000 Active 172 DOM
-
2026-06-02days on market $75,000 Active 171 DOM
-
2026-06-01days on market $75,000 Active 170 DOM
-
2026-05-31days on market $75,000 Active 169 DOM
-
2026-03-13price $75,000
-
2025-12-13$85,000 Active
ⓘ Source: listings_history table (triggers on properties + properties_extension) + one-shot
backfill from property_details.listing_events for pre-trigger history.
Climate risk First Street
- Flood 1/10 Low FEMA zone X (unshaded) · 0% chance over 30 yrs
- Wildfire 4/10 Moderate
- Heat 3/10 Moderate 7 d/yr ≥89°F today · 18 d/yr by 30 yrs out
- Wind 1/10 Low
- Air quality 1/10 Low 0 unhealthy d/yr today · 0 by 30 yrs out
Nearby sold comps map
Loading sold comps map…
Walkable amenities ~0.75 mi
Loading nearby amenities…
Taxation est. · year 1
- Rental income
- $13,815
- − Mortgage interest
- −$4,201
- − Property taxes
- −$1,125
- − Insurance
- −$375
- − Repairs & maintenance
- −$1,105
- − Management
- −$1,105
- − Depreciation
- −$2,182
- Taxable income
- $3,722
- Est. tax owed @ 24.0%
- −$893
- After-tax cash flow
- $3,801/yr
For passive investors: Depreciation is non-cash, so a rental often shows a tax loss while cash-flowing — sheltering income. Rental losses are passive: they offset passive income freely, and up to $25,000/yr can offset ordinary (W-2) income if you actively participate and your MAGI is under $100k (phasing out to $0 by $150k); unused losses carry forward. On sale, claimed depreciation is recaptured at up to 25%, and gains may owe capital-gains tax (a 1031 exchange can defer both). Figures are a year-1 estimate at your 24.0% rate — not tax advice; consult a CPA.
Schools (NCES district)
- District
- Gallup-Mckinley Cty Schools
- NCES district ID
- 3501110
- Math proficiency
- 17% —
- Reading proficiency
- 30% —
- Median HH income
- $30,298
- Composite
- 22.01/100
- National rank
- #13541
- State rank
- #54 of 95 in NM
Livability — Yah-ta-hey
No livability data for this city. (Only ~50 U.S. cities are tracked.)
Census & demographics
- Census place
- Yah-ta-hey, NM
- Population (ZIP)
- 4,547
Population outlook (McKinley County) Hauer SSP2
- Today (2025)
- 88,386 people
- By 2030
- 94,451 · +6.9%
- By 2040
- 107,369 · +21.5%
- By 2050
- 119,937 · +35.7%
- By 2075
- 148,818 · +68.4%
- By 2100
- 160,771 · +81.9%
Race, ethnicity, and origin ACS 2023
- Neighborhood character
- Highly diverse neighborhood (Simpson 1.00)
- Race & ethnicity
- Native American 97% Hispanic / Latino 2% Two or more races 1%
- Languages at home
- 53% English-only · Other Asian/Pacific 1% Spanish 1%
Political lean MEDSL · McKinley
- 2024 margin
- Strong D (+24.5) · D 60.7% · R 36.2% · Other 3.1%
- 2008→2024 swing
- -19.4pp toward R · 2008: 43.9pp · 2024: 24.5pp
- All cycles
- 2024: D+24.5 2020: D+38.6 2016: D+39.8 2012: D+46.6 2008: D+43.9
Not yet ingested
- Civics
- —
Market trends
- HPI YoY
- —
- Current HPI
- —
- Rent YoY
- —
- Metro
- —
- State GDP YoY
- —
- F500 in state
- 0
Price history
-11.8% since first listed2 events — show timeline
- 2026-03-13 Price Changed $75,000 NMMLS
- 2025-12-13 Listed $85,000 NMMLS
Cash-flow waterfall
monthlySold comps — $/sqft
last 12 mo · ≤1 miLoading sold comps…