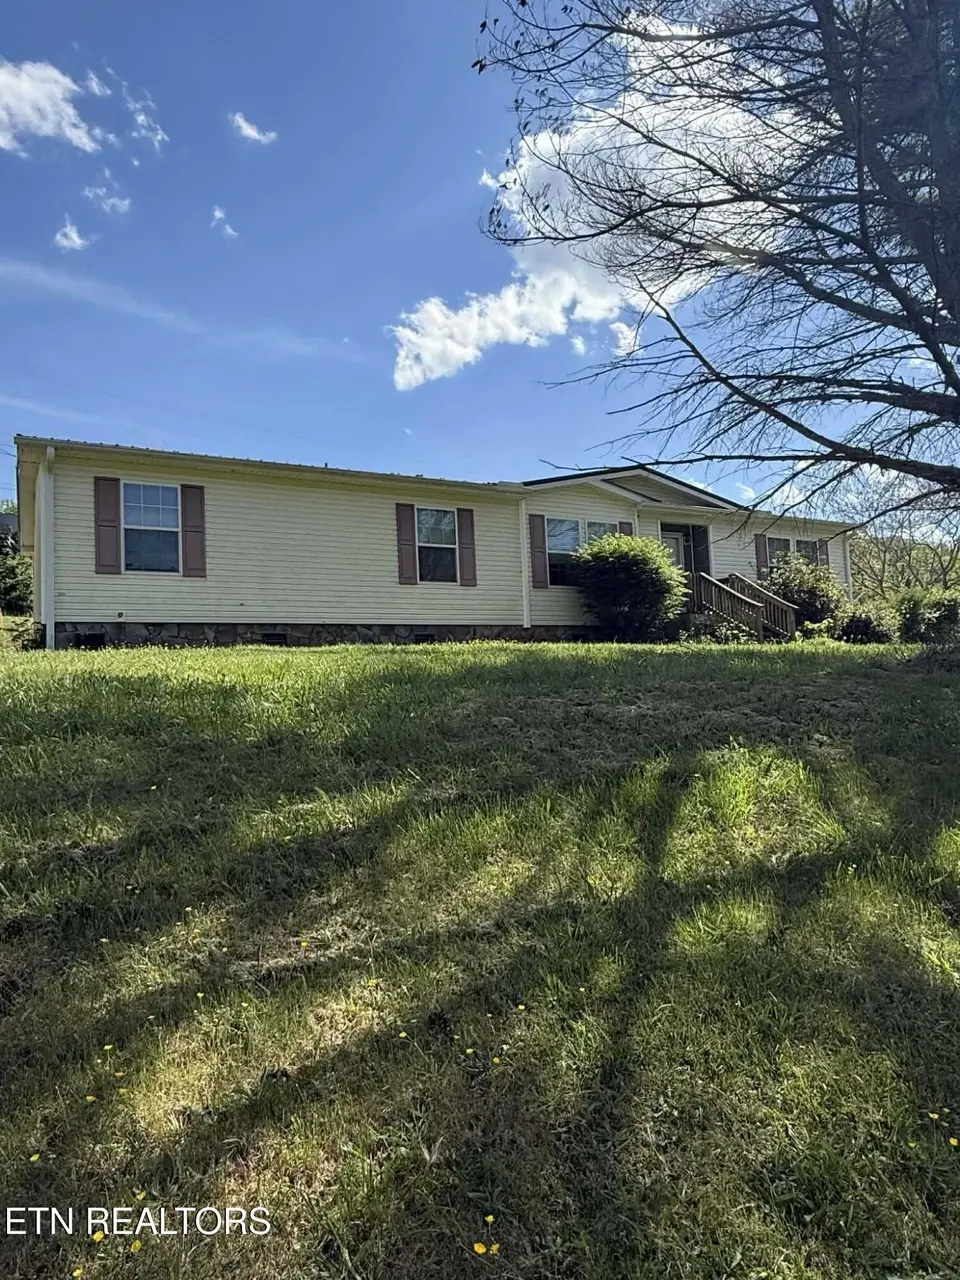
1338 Central Point Rd · Rutledge, TN
Flood risk 1/10 · Minimal
- FEMA flood zone
- X (unshaded)
- Chance of flooding over 30 yrs
- 0.0%
- Est. flood insurance / yr
- $507 – $1,088
Fire risk 6/10 · Moderate
- Est. fire insurance / yr
- $949 – $1,763
Heat risk 4/10 · Minor
- Hot days now (above 102°F)
- 7 days/yr
- Hot days in 30 yrs
- 20 days/yr
Wind risk 2/10 · Minimal
- Chance of severe wind over 30 yrs
- 0.0%
Air-quality risk 4/10 · Minor
- Unhealthy air days now
- 4 days/yr
- Unhealthy air days in 30 yrs
- 5 days/yr
Risk factors via First Street. Map © Google.
Why this score? — see what drove the F grade
The composite is a weighted blend of 9 inputs, each scored 0–100. Each bar is that input's sub-score; the figure is the points it added to the 100-point composite (weight × sub-score).
- Appreciation +10.0/10.0
- ARV discount +7.5/15.0
- Cash flow +6.5/30.0
- Livability +3.0/5.0
- Rent growth +2.5/5.0
- Condition / age +2.5/5.0
- Schools +1.6/10.0
- DSCR +0.8/10.0
- 1% rule +0.3/10.0
$249,900
🖨 Deal sheet 📄 Offer letter ✓ Due diligence
Listing remarks
Tucked away in a private country setting, this inviting property offers the perfect blend of peace, space, and everyday convenience. Surrounded by open skies and natural beauty, it's an ideal escape from the hustle while still within easy reach of town. The property provides ample room to relax, entertain, or simply enjoy quiet mornings and scenic evenings. Whether you're looking for a full-time residence or a tranquil retreat, this one delivers charm, privacy, and endless potential to make it your own.
Key facts
- 0.42 acre lot
- Built 2009
- Listed 41 days
Property features AI
Exterior
- Parking: Other parking
- Utilities: Septic tank sewer
- Home design: Not attached to another property
- Construction: Vinyl siding; Block construction; Frame construction; Crawl space foundation
- Exterior features: Country setting view; Irregular lot
Interior
- Kitchen: Dishwasher; Microwave; Refrigerator
- Flooring: Carpet; Vinyl
- Bathrooms: 2 full bathrooms
- Heating & cooling: Central heating; Heat pump; Electric heating; Central cooling; Other cooling
- Interior features: Breakfast bar; 8 total rooms; Electric fireplace (1)
- Laundry & utility: Washer; Dryer; Other laundry/utility appliance
Neighborhood map
What this means for you Summary
Snapshot
- This is a 4-bed/2.0-bath manufactured listed at $250k.
Deal economics
- At list price, monthly cash flow is $-425 ($-5k/yr) — negative.
- To cash-flow at today's rent, offer at most $175k (30.0% below list).
- To meet the 1% rule (rent ≥ 1% of price), the offer needs to be $132k (47.2% below list).
- Recommended offer: $132k (47.2% below list) — sets the bar for 1% rule.
- Cap rate 4.3% vs local median 1.9% in Rutledge — top-decile yield for the area; either an underpriced asset or a hidden risk that comps aren't pricing in. Stress-test before assuming the spread holds.
Location & tenants
- Location reads 59/100 on livability (#281 in TN) — a working-class tenant base; expect higher turnover. Strengths: cost of living A+, housing A+, crime B; Watch: schools F, amenities F, commute F.
- Grainger County (rural): math 15% / reading 23% proficiency, ranked #123 of 139 in TN (top 88%) — low school quality limits family demand, transient renter base, plan for 1-2y turnover.
- Market conditions: 118 active listings in the ZIP; 74 units permitted in Grainger County in 2024 (0 in 5+ unit buildings).
Forward outlook
- In year one you build about $27k of equity ($2k loan paydown + $25k appreciation (10.0% local appreciation)).
- Grainger County population projected to shrink 8% by 2050 — rents likely to lag national; underwrite the cash flow, not the appreciation.
- By year 2, paydown + projected appreciation supports a ~$43k cash-out refi (75% LTV) — recoverable capital for the next deal without selling this one.
Negotiation context
- It's been on market 42 days — a 3% lower offer ($242k) is reasonable based on typical stale-listing flexibility.
Risks & watch-outs
- Climate carrying-cost: major wildfire risk — expect insurance premiums to compound above CPI over the hold.
Questions for the listing agent
- What do current leases actually rent for vs. the listed asking? Can we see a recent rent roll and the last 12 months of T-12 income?
- It's been on market 42 days. Have you received any prior offers? Is the seller open to a 47% concession, seller financing, or rate buy-down credit?
- Is there a deadline driving the sale (1031 exchange, divorce, estate, relocation)? That informs how much negotiation room exists.
- Schools are F-rated, which usually means shorter tenancies and higher turnover. Who's the typical renter profile here, and what's been the actual vacancy rate?
- The area grade is low — what's the realistic commute time and amenity access for the typical tenant pool here? Any planned neighborhood developments (good or bad) we should know about?
- What's the average days-on-market for RENTAL listings here right now (not sales)? A rising rental-DOM trend means longer vacancies and softer asking-rent achievability than the comps imply.
- What's the recent tenant-quality profile in this submarket — average credit score on applications, eviction rate, late-payment / NSF rate, and stable-employment percentage? A property-management company in the area should have these aggregated.
- How much new for-sale + rental construction is in the pipeline within 1–3 miles? Heavy new supply typically softens prices + rents 12–24 months out; constrained supply supports both.
Investment metrics
- 1% rule
- 0.53% ✗
- Cap rate
- 4.25%
- Cash-on-cash
- -7.29%
- DSCR
- 0.68
- GRM
- 15.8
CMA / ARV
No comps found within radius.
Projected returns pro-forma
10.0% appreciation · 3.0% rent growth · sell at horizon
- IRR
- 19.1%
- Equity multiple
- 2.56×
- Total profit
- $108,899
- Equity at exit
- $225,130
- IRR
- 17.6%
- Equity multiple
- 5.88×
- Total profit
- $341,693
- Equity at exit
- $485,501
Cash invested: $69,972 (down + closing). Projections, not guarantees.
Landlord ↔ Tenant lean methodology
- Overall (STATE)
- 87 Strongly Landlord-Friendly
- State Tennessee
- 87 Strongly Landlord-Friendly · R+13
- County
- — inherits STATE
- City
- — inherits STATE
ZIP-level market 37861
- Active inventory
- 118
- Price-to-rent
- 15.8×
Monthly cashflow live
- Estimated rent
- $1,319 medium interval (Pro) →
- Mortgage (P&I)
- −$1,311
- Tax from tax record
- −$52 /mo · $629/yr
- Insurance
- −$104
- HOA
- −$0
- Vacancy / Maint / Mgmt
- −$277
- Net cashflow
- $-425
Break-even live
UW: 25.0% down · 7.5% · 30yr · 1.5% tax · 5.0% vac · 8.0% maint · 8.0% mgmt
Financing live
Cash to close
- Down payment
- $62,475
- Closing costs
- $7,497
- Reserves months
- —
- Total cash needed
- —
Loan-product check · same deal, 3 products live
Conventional
25% down · 7.5% · 30yr
- Down + closing
- —
- Monthly P&I
- —
- Monthly cashflow
- —
- DSCR
- —
- Eligible?
- —
Personal DTI + credit; lowest rate.
DSCR
20% down · 8.5% · 30yr
- Down + closing
- —
- Monthly P&I
- —
- Monthly cashflow
- —
- DSCR
- —
- Eligible?
- —
No personal income docs; deal must DSCR.
Hard money
10% down · 12.0% · 12mo
- Down + closing
- —
- Monthly P&I
- —
- Monthly cashflow
- —
- DSCR
- —
- Eligible?
- —
Short-term bridge; refi at stabilization.
Listing history 18 events
-
2026-06-19days on market $249,900 Active 42 DOM
-
2026-06-18days on market $249,900 Active 41 DOM
-
2026-06-17pricedays on market $249,900 Active 40 DOM
-
2026-06-16days on market $254,900 Active 39 DOM
-
2026-06-15days on market $254,900 Active 38 DOM
-
2026-06-14days on market $254,900 Active 36 DOM
-
2026-06-12pricedays on market $254,900 Active 35 DOM
-
2026-06-09days on market $259,900 Active 32 DOM
-
2026-06-08days on market $259,900 Active 31 DOM
-
2026-06-07days on market $259,900 Active 30 DOM
-
2026-06-05pricedays on market $259,900 Active 27 DOM
-
2026-06-03days on market $269,809 Active 26 DOM
-
2026-06-02days on market $269,809 Active 25 DOM
-
2026-06-01days on market $269,809 Active 24 DOM
-
2026-05-31days on market $269,809 Active 23 DOM
-
2026-05-30days on market $269,809 Active 22 DOM
-
2026-05-15price $269,899 508-char remark
-
2026-05-08$269,900 Active 508-char remark
ⓘ Source: listings_history table (triggers on properties + properties_extension) + one-shot
backfill from property_details.listing_events for pre-trigger history.
Tax reassessment forecast TN · Resets to sale price
- Current annual tax
- $629 · $52/mo
- Projected year-2 tax
- $1,774 · $148/mo
- Expected delta
- +$1,145/yr (+$95/mo · 182.1%)
ⓘ Screening estimate from a state-policy table — verify with the county assessor before closing.
Climate risk First Street
- Flood 1/10 Low FEMA zone X (unshaded) · 0% chance over 30 yrs
- Wildfire 6/10 Major
- Heat 4/10 Moderate 7 d/yr ≥102°F today · 20 d/yr by 30 yrs out
- Wind 2/10 Low 0% chance of damaging wind over 30 yrs
- Air quality 4/10 Moderate 4 unhealthy d/yr today · 5 by 30 yrs out
Nearby sold comps map
Loading sold comps map…
Walkable amenities ~0.75 mi
Loading nearby amenities…
Taxation est. · year 1
- Rental income
- $15,830
- − Mortgage interest
- −$13,998
- − Property taxes
- −$629
- − Insurance
- −$1,250
- − Repairs & maintenance
- −$1,266
- − Management
- −$1,266
- − Depreciation
- −$7,270
- Taxable loss
- −$9,850
- Est. tax savings @ 24.0%
- +$2,364
- After-tax cash flow
- $-2,735/yr
For passive investors: Depreciation is non-cash, so a rental often shows a tax loss while cash-flowing — sheltering income. Rental losses are passive: they offset passive income freely, and up to $25,000/yr can offset ordinary (W-2) income if you actively participate and your MAGI is under $100k (phasing out to $0 by $150k); unused losses carry forward. On sale, claimed depreciation is recaptured at up to 25%, and gains may owe capital-gains tax (a 1031 exchange can defer both). Figures are a year-1 estimate at your 24.0% rate — not tax advice; consult a CPA.
Schools (NCES district)
- District
- Grainger County
- NCES district ID
- 4701440
- Math proficiency
- 15% ▼ -18.00%
- Reading proficiency
- 23% ▼ -6.00%
- Median HH income
- $35,163
- Composite
- 15.64/100
- National rank
- #9289
- State rank
- #123 of 139 in TN
Livability — Rutledge
- Score
- 59/100
- State rank
- #281
- US rank
- #19814
Category grades
Schools grade is shown separately in the Schools card above.
Census & demographics
- Population (ZIP)
- 8,578
Population outlook (Grainger County) Hauer SSP2
- Today (2025)
- 23,117 people
- By 2030
- 23,037 · -0.3%
- By 2040
- 22,435 · -3.0%
- By 2050
- 21,236 · -8.1%
- By 2075
- 17,595 · -23.9%
- By 2100
- 13,157 · -43.1%
Race, ethnicity, and origin ACS 2023
- Neighborhood character
- Predominantly White (93%)
- Race & ethnicity
- White 93% Hispanic / Latino 4% Two or more races 2%
- Common ancestry
- Italian 4% Serbian 3% Slovak 2%
- Foreign-born
- 2% · Canada
- Languages at home
- 99% English-only · Spanish 1%
Political lean MEDSL · Grainger
- 2024 margin
- Solid R (+73.7) · D 12.9% · R 86.5%
- 2008→2024 swing
- -30.6pp toward R · 2008: -43.1pp · 2024: -73.7pp
- All cycles
- 2024: R+73.7 2020: R+70.0 2016: R+68.4 2012: R+52.4 2008: R+43.1
Not yet ingested
- Civics
- —
Market trends
- HPI YoY
- ▲ 100.39%
- Current HPI
- 384.7003
- Rent YoY
- —
- Metro
- —
- State GDP YoY
- ▲ 2.78%
- F500 in state
- 22
Industry mix (Fortune 500 HQ in TN)
| Industry | F500 HQs | Revenue |
|---|---|---|
| Healthcare | 3 | $91B |
|
||
| Retail | 3 | $72B |
|
||
| Transportation / Logistics | 1 | $88B |
|
||
| Paper / Packaging | 1 | $19B |
|
||
| Insurance | 1 | $13B |
|
||
| Energy | 1 | $12B |
|
||
Price history
-7.4% since first listed7 events — show timeline
- 2026-06-17 Price Changed $249,900 Knoxville MLS
- 2026-06-11 Price Changed $254,900 Knoxville MLS
- 2026-06-04 Price Changed $259,900 Knoxville MLS
- 2026-05-29 Price Changed $269,809 Knoxville MLS
- 2026-05-22 Price Changed $269,890 Knoxville MLS
- 2026-05-15 Price Changed $269,899 Knoxville MLS
- 2026-05-08 Listed $269,900 Knoxville MLS
Property tax history
+0.7%/yrLatest (2025): $629 · +0.0% YoY. Source: county tax records.
Cash-flow waterfall
monthlySold comps — $/sqft
last 12 mo · ≤1 miLoading sold comps…