 Multi-family
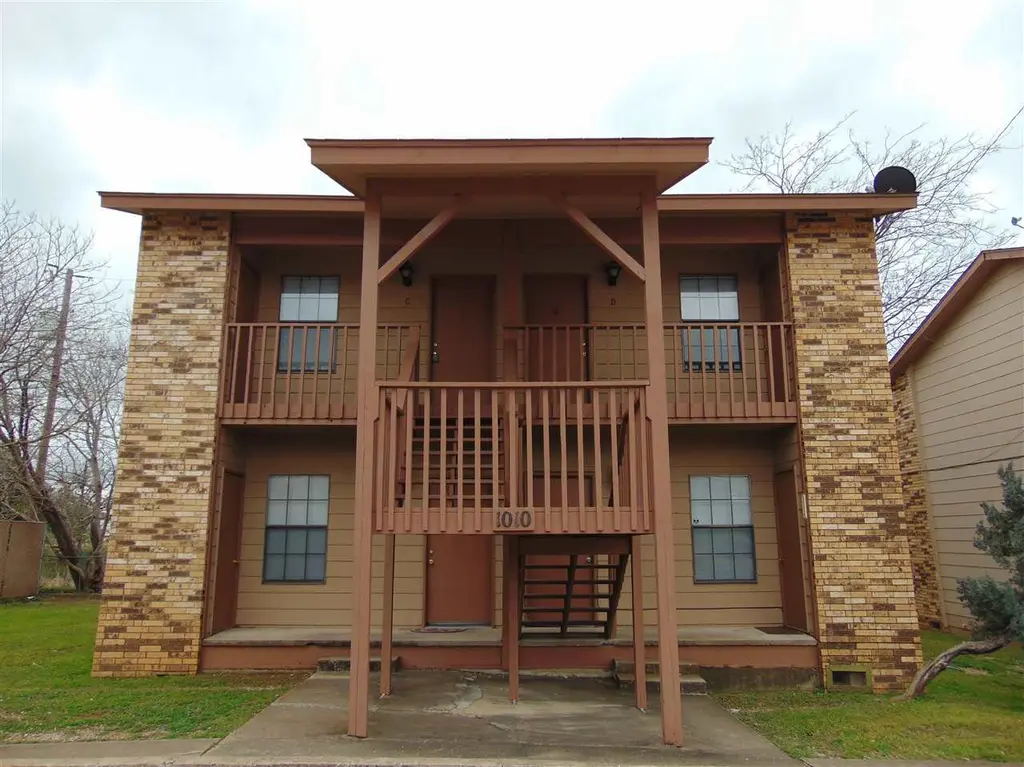
1112 Ninth Street St · Marble Falls, TX
Flood risk 8/10 · Major
- FEMA flood zone
- X (unshaded)
- Chance of flooding over 30 yrs
- 0.99%
- Est. flood insurance / yr
- $507 – $1,088
Fire risk 4/10 · Minor
- Est. fire insurance / yr
- $1,222 – $2,270
Heat risk 8/10 · Major
- Hot days now (above 107°F)
- 7 days/yr
- Hot days in 30 yrs
- 23 days/yr
Wind risk 6/10 · Moderate
- Chance of severe wind over 30 yrs
- 50.0%
Air-quality risk 1/10 · Minimal
- Unhealthy air days now
- 0 days/yr
- Unhealthy air days in 30 yrs
- 0 days/yr
Risk factors via First Street. Map © Google.
Why this score? — see what drove the D grade
The composite is a weighted blend of 9 inputs, each scored 0–100. Each bar is that input's sub-score; the figure is the points it added to the 100-point composite (weight × sub-score).
- Cash flow +15.0/30.0
- ARV discount +7.5/15.0
- 1% rule +5.0/10.0
- DSCR +5.0/10.0
- Livability +3.5/5.0
- Schools +3.0/10.0
- Condition / age +2.5/5.0
- Rent growth +2.3/5.0
- Appreciation +0.0/10.0
$850
🖨 Deal sheet 📄 Offer letter ✓ Due diligence
Multi-family units
County records classify this as Multi-Family (5+ Unit). Listing-text estimate: 1 unit. estimate disagrees with records
5+ unit building — per-unit beds/baths from public records are typically unavailable; the breakdown below (if shown) is an estimate from the listing text.
Listing remarks MLS
Affordable 1-bedroom, 1-bath apartment centrally located in Marble Falls — just a short walk to HEB and other local conveniences! Features include a kitchen with refrigerator and stove provided, plus central heat and air for year-round comfort. Great location at a great value. Available now!
Key facts
- Kitchen with stove
- Central heat and air
- Centrally located
Tags
Neighborhood map
What this means for you Summary
Snapshot
- This is a 1-bed/1.0-bath multifamily listed at $850.
Deal economics
- At list price, monthly cash flow is $2k ($25k/yr) — positive.
- The deal already cash-flows at list — no discount required.
- Meets the 1% rule at list price ($3k rent vs $850).
- Recommended offer: $773 (9.1% below list) — sets the bar for market timing.
- Cap rate 3057.3% vs local median 2.7% in Marble Falls — top-decile yield for the area; either an underpriced asset or a hidden risk that comps aren't pricing in. Stress-test before assuming the spread holds.
Location & tenants
- Location reads 70/100 on livability (#367 in TX) — a middle-class / working-renter tenant base. Strengths: cost of living A+, health & safety A+, housing A; Watch: crime C-, schools D, employment D.
- Marble Falls ISD (town): math 32% / reading 38% proficiency, ranked #511 of 826 in TX (top 62%) — families likely to look elsewhere, expect single-tenant / working-renter base with shorter leases.
- Market conditions: Rents soft (-0.6%/yr); 752 active listings in the ZIP; 1 comparable units currently listed for rent nearby; 891 units permitted in Burnet County in 2024 (76 in 5+ unit buildings).
- This rent runs 44% of the median local income ($74k/yr) — at the standard rent-burdened threshold; future hikes will face affordability resistance.
Forward outlook
- Local home prices are declining (-3.0%/yr); year-one equity from $6 of loan paydown is wiped out by about $26 of value loss. Plan a longer hold.
- Burnet County population projected at +22% by 2050 — long-run rental-demand tailwind backs the buy-and-hold thesis.
- At projected returns (-3.0% appreciation + 0.0% rent growth), your $238 cash investment doubles in ~1 year — after that, you're playing with house money.
Negotiation context
- It's been on market 118 days — a 9% lower offer ($773) is reasonable based on typical stale-listing flexibility.
- 5 sale attempts since 5y ago with the ask held roughly flat each time — persistent listings suggest the price (not the market) is what's stuck; bring a comps-based counter.
Risks & watch-outs
- Watch-outs: flood insurance adds $66/mo.
- Climate carrying-cost: severe flood risk; major wind risk, 50% chance of damaging wind over 30y; extreme-heat days projected 7→23/yr by 2055 (HVAC capex compounding) — expect insurance premiums to compound above CPI over the hold.
Questions for the listing agent
- It's been on market 118 days. Have you received any prior offers? Is the seller open to a 9% concession, seller financing, or rate buy-down credit?
- What's the actual annual flood-insurance premium (NFIP or private), and is the property in a SFHA with mandatory coverage?
- Why hasn't it sold? Are there any deal-killer items the seller is aware of (foundation, flood, title, zoning, code violations)?
- Is there a deadline driving the sale (1031 exchange, divorce, estate, relocation)? That informs how much negotiation room exists.
- Schools are D-rated, which usually means shorter tenancies and higher turnover. Who's the typical renter profile here, and what's been the actual vacancy rate?
- The area grade is low — what's the realistic commute time and amenity access for the typical tenant pool here? Any planned neighborhood developments (good or bad) we should know about?
- What's the average days-on-market for RENTAL listings here right now (not sales)? A rising rental-DOM trend means longer vacancies and softer asking-rent achievability than the comps imply.
- What's the recent tenant-quality profile in this submarket — average credit score on applications, eviction rate, late-payment / NSF rate, and stable-employment percentage? A property-management company in the area should have these aggregated.
- How much new apartment / multifamily construction is in the pipeline within 1–3 miles? Heavy new supply (>2% of stock underway) typically softens rents 12–24 months out; light construction supports rent growth.
Investment metrics
- 1% rule
- 322.71% ✓
- Cap rate
- 3057.25%
- Cash-on-cash
- 10896.28%
- DSCR
- 485.82
- GRM
- 0.0
CMA / ARV
No comps found within radius.
Projected returns pro-forma
-3.0% appreciation · 0.0% rent growth · sell at horizon
- IRR
- —
- Equity multiple
- 527.53×
- Total profit
- $125,314
- Equity at exit
- $127
- IRR
- —
- Equity multiple
- 1052.15×
- Total profit
- $250,174
- Equity at exit
- $73
Cash invested: $238 (down + closing). Projections, not guarantees.
Landlord ↔ Tenant lean methodology
- Overall (STATE)
- 87 Strongly Landlord-Friendly
- State Texas
- 87 Strongly Landlord-Friendly · R+5
- County
- — inherits STATE
- City
- — inherits STATE
ZIP-level market 78654
- Home prices YoY
- -31.8%
- Rents YoY
- -0.6%
- Active inventory
- 752
- Price-to-rent
- 0.1×
Monthly cashflow live
- Estimated rent
- $2,743 high interval (Pro) →
- Mortgage (P&I)
- −$4
- Tax est. 1.5%
- −$1 /mo · $13/yr
- Insurance
- −$0
- Flood insurance flood zone
- −$66 /mo · $798/yr
- HOA
- −$0
- Vacancy / Maint / Mgmt
- −$576
- Net cashflow
- $2,095
Break-even live
2-unit breakdown (identical units grouped — click to expand)
| Units | Beds | Baths | Est. rent |
|---|---|---|---|
| 2× units | 1 | 1 | $2,744 |
| #1 | 1 | 1 | $1,372 |
| #2 | 1 | 1 | $1,372 |
| Total (2 units) | $2,743 | ||
UW: 25.0% down · 7.5% · 30yr · 1.5% tax · 5.0% vac · 8.0% maint · 8.0% mgmt
Financing live
Cash to close
- Down payment
- $212
- Closing costs
- $26
- Reserves months
- —
- Total cash needed
- —
Loan-product check · same deal, 3 products live
Conventional
25% down · 7.5% · 30yr
- Down + closing
- —
- Monthly P&I
- —
- Monthly cashflow
- —
- DSCR
- —
- Eligible?
- —
Personal DTI + credit; lowest rate.
DSCR
20% down · 8.5% · 30yr
- Down + closing
- —
- Monthly P&I
- —
- Monthly cashflow
- —
- DSCR
- —
- Eligible?
- —
No personal income docs; deal must DSCR.
Hard money
10% down · 12.0% · 12mo
- Down + closing
- —
- Monthly P&I
- —
- Monthly cashflow
- —
- DSCR
- —
- Eligible?
- —
Short-term bridge; refi at stabilization.
Rent comps 1 comps
| Address | Beds | Baths | Sqft | Rent | $/sqft | DOM | Units | Dist |
|---|---|---|---|---|---|---|---|---|
| 1601 Mustang Dr Marble Falls, TX | 1.0–3.0 | 1.0–2.5 | 1049 | $1,499 | $1.43 | 1d | 77 | 1.21mi |
Listing history 23 events
-
2026-06-18days on market $850 Active 118 DOM
-
2026-06-17days on market $850 Active 117 DOM
-
2026-06-16days on market $850 Active 116 DOM
-
2026-06-15days on market $850 Active 115 DOM
-
2026-06-13days on market $850 Active 113 DOM
-
2026-06-13days on market $850 Active 112 DOM
-
2026-06-09days on market $850 Active 109 DOM
-
2026-06-08days on market $850 Active 108 DOM
-
2026-06-07days on market $850 Active 107 DOM
-
2026-06-05days on market $850 Active 104 DOM
-
2026-06-03days on market $850 Active 103 DOM
-
2026-06-01days on market $850 Active 101 DOM
-
2026-05-31days on market $850 Active 100 DOM
-
2026-02-20$850 Active 298-char remark
Show marketing remark (298 chars)
Affordable 1-bedroom, 1-bath apartment centrally located in Marble Falls — just a short walk to HEB and other local conveniences! Features include a kitchen with refrigerator and stove provided, plus central heat and air for year-round comfort. Great location at a great value. Available now!
-
2025-11-13soldstatus Closed 182-char remark
Show marketing remark (182 chars)
Affordable one bedroom, one bath apartment centrally located in Marble Falls - walking distance to HEB and more. Refrigerator and stove provided. Central heat and air. Available now!
-
2025-10-30status Pending 182-char remark
Show marketing remark (182 chars)
Affordable one bedroom, one bath apartment centrally located in Marble Falls - walking distance to HEB and more. Refrigerator and stove provided. Central heat and air. Available now!
-
2025-07-17$825 Active 182-char remark
Show marketing remark (182 chars)
Affordable one bedroom, one bath apartment centrally located in Marble Falls - walking distance to HEB and more. Refrigerator and stove provided. Central heat and air. Available now!
-
2023-04-10soldstatus
-
2023-03-27soldstatus
-
2023-03-23soldstatus
-
2022-08-12$750
-
2021-02-24$650
-
2021-02-24$650
ⓘ Source: listings_history table (triggers on properties + properties_extension) + one-shot
backfill from property_details.listing_events for pre-trigger history.
Climate risk First Street
- Flood 8/10 Severe FEMA zone X (unshaded) · 99% chance over 30 yrs
- Wildfire 4/10 Moderate
- Heat 8/10 Severe 7 d/yr ≥107°F today · 23 d/yr by 30 yrs out
- Wind 6/10 Major 50% chance of damaging wind over 30 yrs
- Air quality 1/10 Low 0 unhealthy d/yr today · 0 by 30 yrs out
Nearby sold comps map
Loading sold comps map…
Walkable amenities ~0.75 mi
Loading nearby amenities…
Taxation est. · year 1
- Rental income
- $32,916
- − Mortgage interest
- −$48
- − Property taxes
- −$13
- − Insurance
- −$802
- − Repairs & maintenance
- −$2,633
- − Management
- −$2,633
- − Depreciation
- −$25
- Taxable income
- $26,763
- Est. tax owed @ 24.0%
- −$6,423
- After-tax cash flow
- $18,713/yr
For passive investors: Depreciation is non-cash, so a rental often shows a tax loss while cash-flowing — sheltering income. Rental losses are passive: they offset passive income freely, and up to $25,000/yr can offset ordinary (W-2) income if you actively participate and your MAGI is under $100k (phasing out to $0 by $150k); unused losses carry forward. On sale, claimed depreciation is recaptured at up to 25%, and gains may owe capital-gains tax (a 1031 exchange can defer both). Figures are a year-1 estimate at your 24.0% rate — not tax advice; consult a CPA.
Schools (NCES district)
- District
- Marble Falls ISD
- NCES district ID
- 4829010
- Math proficiency
- 32% ▼ -8.00%
- Reading proficiency
- 38% ▼ -4.00%
- Median HH income
- $49,663
- Composite
- 30.3/100
- National rank
- #6278
- State rank
- #511 of 826 in TX
Livability — Marble Falls
- Score
- 70/100
- State rank
- #367
- US rank
- #7802
Category grades
Schools grade is shown separately in the Schools card above.
Census & demographics
- Census place
- Marble Falls, TX
- County
- Burnet County · 35,210 people
- City population
- 20,650
- Metro
- Austin-Round Rock-Georgetown, TX
- Population (ZIP)
- 20,650
- Household income
- $74,130
- Rent vs Own
- Severe rent burden
- 354.0
Population outlook (Burnet County) Hauer SSP2
- Today (2025)
- 50,492 people
- By 2030
- 52,995 · +5.0%
- By 2040
- 57,528 · +13.9%
- By 2050
- 61,444 · +21.7%
- By 2075
- 71,098 · +40.8%
- By 2100
- 74,634 · +47.8%
Race, ethnicity, and origin ACS 2023
- Neighborhood character
- Predominantly White (68%)
- Race & ethnicity
- White 68% Hispanic / Latino 28% Two or more races 8%
- Hispanic origin (detail)
- Mexican 24%
- Common ancestry
- Serbian 2% Italian 2% Slovak 2%
- Foreign-born
- 8% · Canada
- Languages at home
- 81% English-only · Spanish 18% Other Indo-European 1%
Political lean MEDSL · Burnet
- 2024 margin
- Solid R (+55.7) · D 21.7% · R 77.4%
- 2008→2024 swing
- -11.6pp toward R · 2008: -44.1pp · 2024: -55.7pp
- All cycles
- 2024: R+55.7 2020: R+53.1 2016: R+56.8 2012: R+54.6 2008: R+44.1
Not yet ingested
- Civics
- —
Market trends
- HPI YoY
- ▼ -118.02%
- Current HPI
- 252.9861
- Rent YoY
- ▼ -0.62%
- Metro
- Austin-Round Rock-Georgetown, TX
- State GDP YoY
- ▲ 3.95%
- F500 in state
- 110
Industry mix (Fortune 500 HQ in TX)
| Industry | F500 HQs | Revenue |
|---|---|---|
| Energy | 16 | $1,198B |
|
||
| Technology | 5 | $198B |
|
||
| Engineering / Construction | 4 | $72B |
|
||
| Energy Services | 3 | $60B |
|
||
| Utilities | 3 | $41B |
|
||
| Healthcare | 2 | $330B |
|
||
Property tax history
+3.4%/yrLatest (2026): $2,925 · +7.3% YoY. Source: county tax records.
Cash-flow waterfall
monthlySold comps — $/sqft
last 12 mo · ≤1 miLoading sold comps…