100 Helmsman Way #101 · Hilton Head Island, SC
Flood risk 10/10 · Severe
- FEMA flood zone
- X (shaded)
- Chance of flooding over 30 yrs
- 0.99%
- Est. flood insurance / yr
- $507 – $1,088
Fire risk 2/10 · Minimal
- Est. fire insurance / yr
- $783 – $1,453
Heat risk 10/10 · Severe
- Hot days now (above 107°F)
- 7 days/yr
- Hot days in 30 yrs
- 18 days/yr
Wind risk 9/10 · Severe
- Chance of severe wind over 30 yrs
- 99.0%
Air-quality risk 2/10 · Minimal
- Unhealthy air days now
- 2 days/yr
- Unhealthy air days in 30 yrs
- 2 days/yr
Risk factors via First Street. Map © Google.
Why this score? — see what drove the D grade
The composite is a weighted blend of 9 inputs, each scored 0–100. Each bar is that input's sub-score; the figure is the points it added to the 100-point composite (weight × sub-score).
- Cash flow +8.1/30.0
- ARV discount +7.5/15.0
- Appreciation +6.6/10.0
- Schools +4.1/10.0
- Rent growth +3.3/5.0
- Livability +3.2/5.0
- 1% rule +3.0/10.0
- Condition / age +2.5/5.0
- DSCR +2.1/10.0
$329,000
🖨 Deal sheet 📄 Offer letter ✓ Due diligence
Listing remarks MLS
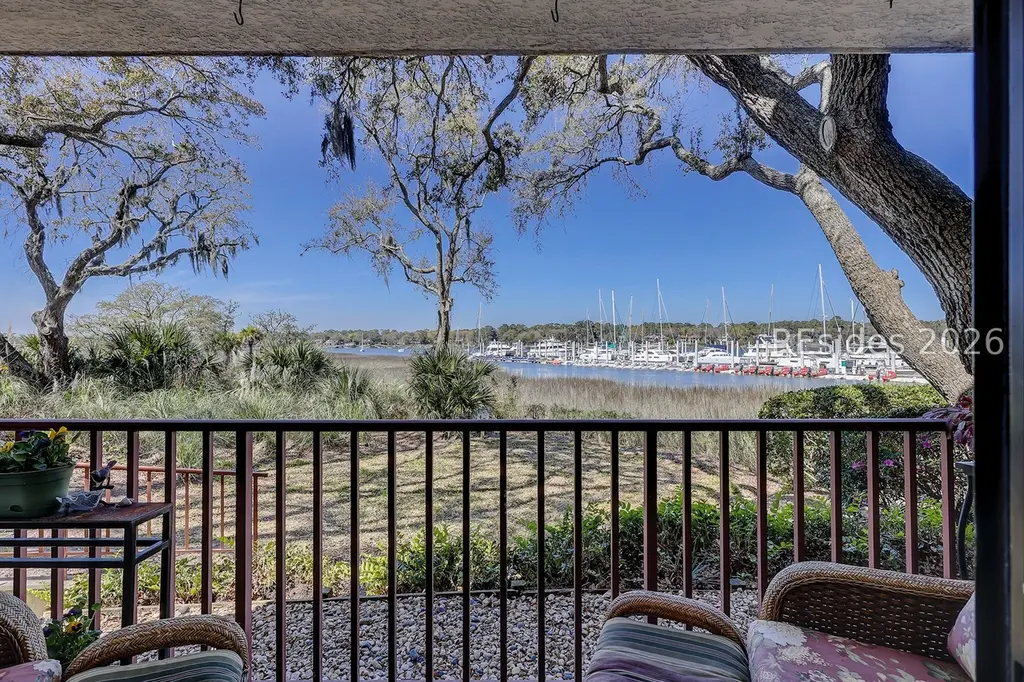
MOVE IN READY, Water front unit on the ground floor with long Southwest views across Broad Creek to Brams Point. Freshly painted with new vinyl planking teak affect floors. Ceilings, walls & trim just pained in July 2017.
Key facts
- Hidden pull-down bed
- Private ev charger
- Updated kitchen
Tags
Property features AI
Finance
- Other: Pets allowed with breed restrictions and owner-only policy
- HOA & community: Association management, cable TV, flood insurance, insurance, internet, grounds maintenance, structure maintenance, phone, sewer, trash and water included in association fee; Community marina; On-site fitness center
Exterior
- Parking: Unassigned parking
- Security: Key card entry
- Utilities: Public water
- Home design: Stucco construction; Asphalt roof
- Construction: Stucco exterior; Asphalt roof
- Exterior features: Balcony; Has view
Interior
- Kitchen: Dishwasher; Microwave; Oven; Refrigerator
- Flooring: Wood
- Bathrooms: 1 full bathroom
- Heating & cooling: Central heating; Electric heating; Heat pump; Central air conditioning; Electric cooling; Heat pump cooling
- Interior features: Insulated windows; Ceiling fan(s); Cable TV; Furnished
- Laundry & utility: Washer; Dryer
Neighborhood map
What this means for you Summary
Snapshot
- This is a 1-bed/1.0-bath condo listed at $329k.
Deal economics
- At list price, monthly cash flow is $-391 ($-5k/yr) — negative.
- The deal already cash-flows at list — no discount required.
- To meet the 1% rule (rent ≥ 1% of price), the offer needs to be $264k (19.8% below list).
- Recommended offer: $264k (19.8% below list) — sets the bar for 1% rule.
- Cap rate 5.1% vs local median 3.0% in Hilton Head Island — top-decile yield for the area; either an underpriced asset or a hidden risk that comps aren't pricing in. Stress-test before assuming the spread holds.
Location & tenants
- Location reads 64/100 on livability (#157 in SC) — a middle-class / working-renter tenant base. Strengths: employment A+, crime A-; Watch: amenities F, commute F, cost of living F.
- Beaufort 01 (town): math 42% / reading 51% proficiency, ranked #17 of 80 in SC (top 21%) — families likely to look elsewhere, expect single-tenant / working-renter base with shorter leases.
- Market conditions: Rents rising (+3.2%/yr); 838 active listings in the ZIP; 2 comparable units currently listed for rent nearby; solid renter incomes; 1,824 units permitted in Beaufort County in 2024 (618 in 5+ unit buildings).
- This rent runs 32% of the median local income ($98k/yr) — at the standard rent-burdened threshold; future hikes will face affordability resistance.
Forward outlook
- In year one you build about $13k of equity ($2k loan paydown + $11k appreciation (3.2% local appreciation)).
- Beaufort County population projected at +30% by 2050 — long-run rental-demand tailwind backs the buy-and-hold thesis.
- By year 3, paydown + projected appreciation supports a ~$32k cash-out refi (75% LTV) — recoverable capital for the next deal without selling this one.
Negotiation context
- It's been on market 22 days — a 2% lower offer ($324k) is reasonable based on typical stale-listing flexibility.
- 4 sale attempts since 9y ago with the ask held roughly flat each time — persistent listings suggest the price (not the market) is what's stuck; bring a comps-based counter.
- Current owner paid $165k; list at $329k implies a 99% gain — meaningful room to come down on a strong offer.
Risks & watch-outs
- Watch-outs: flood insurance adds $66/mo.
- Climate carrying-cost: severe flood risk; severe wind risk, 99% chance of damaging wind over 30y; extreme-heat days projected 7→18/yr by 2055 (HVAC capex compounding) — expect insurance premiums to compound above CPI over the hold.
Questions for the listing agent
- What do current leases actually rent for vs. the listed asking? Can we see a recent rent roll and the last 12 months of T-12 income?
- What's the actual annual flood-insurance premium (NFIP or private), and is the property in a SFHA with mandatory coverage?
- What does the HOA fee cover, when was the last increase, and are there any pending special assessments or reserve-fund shortfalls?
- Any open or pending special assessments — roof, HVAC, plumbing, elevator, façade? What's the per-unit balance and payoff schedule, and is the seller paying it off at close or rolling it to the buyer?
- Is there a deadline driving the sale (1031 exchange, divorce, estate, relocation)? That informs how much negotiation room exists.
- Schools are B-rated — typically a magnet for longer-tenancy family renters. What's the average tenant stay here, and is there a school-zone premium baked into asking?
- The area grade is low — what's the realistic commute time and amenity access for the typical tenant pool here? Any planned neighborhood developments (good or bad) we should know about?
- What's the average days-on-market for RENTAL listings here right now (not sales)? A rising rental-DOM trend means longer vacancies and softer asking-rent achievability than the comps imply.
- What's the recent tenant-quality profile in this submarket — average credit score on applications, eviction rate, late-payment / NSF rate, and stable-employment percentage? A property-management company in the area should have these aggregated.
- How much new apartment / multifamily construction is in the pipeline within 1–3 miles? Heavy new supply (>2% of stock underway) typically softens rents 12–24 months out; light construction supports rent growth.
Investment metrics
- 1% rule
- 0.80% ✗
- Cap rate
- 5.11%
- Cash-on-cash
- -4.23%
- DSCR
- 0.81
- GRM
- 10.4
CMA / ARV
No comps found within radius.
Projected returns pro-forma
3.21% appreciation · 3.23% rent growth · sell at horizon
- IRR
- 3.6%
- Equity multiple
- 1.21×
- Total profit
- $19,133
- Equity at exit
- $151,790
- IRR
- 6.9%
- Equity multiple
- 2.08×
- Total profit
- $99,708
- Equity at exit
- $236,970
Cash invested: $92,120 (down + closing). Projections, not guarantees.
Landlord ↔ Tenant lean methodology
- Overall (STATE)
- 90 Strongly Landlord-Friendly
- State South Carolina
- 90 Strongly Landlord-Friendly · R+6
- County
- — inherits STATE
- City
- — inherits STATE
ZIP-level market 29928
- Home prices YoY
- 1.3%
- Rents YoY
- 3.2%
- Active inventory
- 838
- Price-to-rent
- 10.4×
Monthly cashflow live
- Estimated rent
- $2,640 medium interval (Pro) →
- Mortgage (P&I)
- −$1,725
- Tax from tax record
- −$87 /mo · $1,048/yr
- Insurance
- −$137
- Flood insurance flood zone
- −$66 /mo · $798/yr
- HOA est. from 6 same-building comps
- −$460
- Vacancy / Maint / Mgmt
- −$554
- Net cashflow
- $-391
Break-even live
UW: 25.0% down · 7.5% · 30yr · 1.5% tax · 5.0% vac · 8.0% maint · 8.0% mgmt
Financing live
Cash to close
- Down payment
- $82,250
- Closing costs
- $9,870
- Reserves months
- —
- Total cash needed
- —
Loan-product check · same deal, 3 products live
Conventional
25% down · 7.5% · 30yr
- Down + closing
- —
- Monthly P&I
- —
- Monthly cashflow
- —
- DSCR
- —
- Eligible?
- —
Personal DTI + credit; lowest rate.
DSCR
20% down · 8.5% · 30yr
- Down + closing
- —
- Monthly P&I
- —
- Monthly cashflow
- —
- DSCR
- —
- Eligible?
- —
No personal income docs; deal must DSCR.
Hard money
10% down · 12.0% · 12mo
- Down + closing
- —
- Monthly P&I
- —
- Monthly cashflow
- —
- DSCR
- —
- Eligible?
- —
Short-term bridge; refi at stabilization.
Rent comps 2 comps
| Address | Beds | Baths | Sqft | Rent | $/sqft | DOM | Units | Dist |
|---|---|---|---|---|---|---|---|---|
| 380 Marshland Rd Hilton Head Island, SC | 1.0–2.0 | 1.0–2.0 | 919 | $1,900 | $2.07 | 43d | 2 | 0.94mi |
| 13 Forest Cove Rd Hilton Head Island, SC | 2.0 | 2.0 | 1000 | $2,150 | $2.15 | 13d | 1 | 1.03mi |
HOA detail condo
- Monthly dues
- $0 · $0/yr
- Likely covers
- water
- Assessments
- None detected in remarks — confirm with the listing agent.
Listing history 23 events
-
2026-06-18days on market $329,000 Active 22 DOM
-
2026-06-17days on market $329,000 Active 21 DOM
-
2026-06-16days on market $329,000 Active 20 DOM
-
2026-06-15days on market $329,000 Active 19 DOM
-
2026-06-14days on market $329,000 Active 17 DOM
-
2026-06-13days on market $329,000 Active 16 DOM
-
2026-06-10days on market $329,000 Active 14 DOM
-
2026-06-09days on market $329,000 Active 13 DOM
-
2026-06-08days on market $329,000 Active 12 DOM
-
2026-06-07days on market $329,000 Active 11 DOM
-
2026-06-05days on market $329,000 Active 8 DOM
-
2026-06-03days on market $329,000 Active 7 DOM
-
2026-06-02days on market $329,000 Active 6 DOM
-
2026-06-01days on market $329,000 Active 5 DOM
-
2026-05-31days on market $329,000 Active 4 DOM
-
2026-05-30days on market $329,000 Active 3 DOM
-
2026-05-27$329,000 Active
-
2024-03-18$349,900 Active
-
2018-01-05soldstatus $165,000
-
2017-12-28soldstatus $165,000 227-char remark
Show marketing remark (227 chars)
MOVE IN READY, Water front unit on the ground floor with long Southwest views across Broad Creek to Brams Point. Freshly painted with new vinyl planking teak affect floors. Ceilings, walls & trim just pained in July 2017.
-
2017-12-21$169,000 227-char remark
Show marketing remark (227 chars)
MOVE IN READY, Water front unit on the ground floor with long Southwest views across Broad Creek to Brams Point. Freshly painted with new vinyl planking teak affect floors. Ceilings, walls & trim just pained in July 2017.
-
2017-08-03$168,900
-
1993-08-20soldstatus $50,000
ⓘ Source: listings_history table (triggers on properties + properties_extension) + one-shot
backfill from property_details.listing_events for pre-trigger history.
Tax reassessment forecast SC · Resets to sale price
- Current annual tax
- $1,048 · $87/mo
- Projected year-2 tax
- $1,875 · $156/mo
- Expected delta
- +$827/yr (+$69/mo · 78.9%)
ⓘ Screening estimate from a state-policy table — verify with the county assessor before closing.
Climate risk First Street
- Flood 10/10 Extreme FEMA zone X (shaded) · 99% chance over 30 yrs
- Wildfire 2/10 Low
- Heat 10/10 Extreme 7 d/yr ≥107°F today · 18 d/yr by 30 yrs out
- Wind 9/10 Extreme 99% chance of damaging wind over 30 yrs
- Air quality 2/10 Low 2 unhealthy d/yr today · 2 by 30 yrs out
Nearby sold comps map
Loading sold comps map…
Walkable amenities ~0.75 mi
Loading nearby amenities…
Taxation est. · year 1
- Rental income
- $31,674
- − Mortgage interest
- −$18,429
- − Property taxes
- −$1,048
- − Insurance
- −$2,442
- − Repairs & maintenance
- −$2,534
- − Management
- −$2,534
- − HOA
- −$5,520
- − Depreciation
- −$9,571
- Taxable loss
- −$10,404
- Est. tax savings @ 24.0%
- +$2,497
- After-tax cash flow
- $-2,195/yr
For passive investors: Depreciation is non-cash, so a rental often shows a tax loss while cash-flowing — sheltering income. Rental losses are passive: they offset passive income freely, and up to $25,000/yr can offset ordinary (W-2) income if you actively participate and your MAGI is under $100k (phasing out to $0 by $150k); unused losses carry forward. On sale, claimed depreciation is recaptured at up to 25%, and gains may owe capital-gains tax (a 1031 exchange can defer both). Figures are a year-1 estimate at your 24.0% rate — not tax advice; consult a CPA.
Schools (NCES district)
- District
- Beaufort 01
- NCES district ID
- 4501110
- Math proficiency
- 42% ▼ -8.00%
- Reading proficiency
- 51% ▲ 2.00%
- Median HH income
- $57,430
- Composite
- 40.56/100
- National rank
- #3699
- State rank
- #17 of 80 in SC
Livability — Hilton Head Island
- Score
- 64/100
- State rank
- #157
- US rank
- #14648
Category grades
Schools grade is shown separately in the Schools card above.
Census & demographics
- Census place
- Hilton Head Island, SC
- County
- Beaufort County · 163,770 people
- City population
- 40,243
- Metro
- Hilton Head Island-Bluffton, SC
- Population (ZIP)
- 15,785
- Household income
- $97,576
- Rent vs Own
- Severe rent burden
- 216.0
Population outlook (Beaufort County) Hauer SSP2
- Today (2025)
- 211,915 people
- By 2030
- 227,272 · +7.2%
- By 2040
- 253,861 · +19.8%
- By 2050
- 275,126 · +29.8%
- By 2075
- 311,022 · +46.8%
- By 2100
- 321,286 · +51.6%
Race, ethnicity, and origin ACS 2023
- Neighborhood character
- Predominantly White (87%)
- Race & ethnicity
- White 87% Hispanic / Latino 6% Two or more races 2% Black 2% Asian 1%
- Hispanic origin (detail)
- Mexican 3%
- Common ancestry
- Lithuanian 4% Slovak 4% Romanian 4%
- Foreign-born
- 9% · Canada, China
- Languages at home
- 91% English-only · Spanish 5% French/Haitian/Cajun 1% Chinese 1%
Political lean MEDSL · Beaufort
- 2024 margin
- R (+14.5) · D 42.1% · R 56.6% · Other 1.2%
- 2008→2024 swing
- -3.7pp toward R · 2008: -10.8pp · 2024: -14.5pp
- All cycles
- 2024: R+14.5 2020: R+10.0 2016: R+14.3 2012: R+17.5 2008: R+10.8
Not yet ingested
- Civics
- —
Market trends
- HPI YoY
- ▲ 3.21%
- Current HPI
- 243.4136
- Rent YoY
- ▲ 3.23%
- Metro
- Hilton Head Island-Bluffton, SC
- State GDP YoY
- ▲ 4.51%
- F500 in state
- 2
Industry mix (Fortune 500 HQ in SC)
| Industry | F500 HQs | Revenue |
|---|---|---|
| Packaging | 1 | $7B |
|
||
Price history
+558.0% since first listed7 events — show timeline
- 2026-05-27 Listed $329,000 RSMLS
- 2024-03-18 Listed $349,900 RSMLS
- 2018-01-05 Sold (Public Records) $165,000 Public Records
- 2017-12-28 Sold (MLS) $165,000 RSMLS
- 2017-12-21 Listed $169,000 RSMLS
- 2017-08-03 Listed $168,900 RSMLS
- 1993-08-20 Sold (Public Records) $50,000 Public Records
Property tax history
-6.0%/yrLatest (2025): $1,048 · -0.7% YoY. Source: county tax records.
Cash-flow waterfall
monthlySold comps — $/sqft
last 12 mo · ≤1 miLoading sold comps…