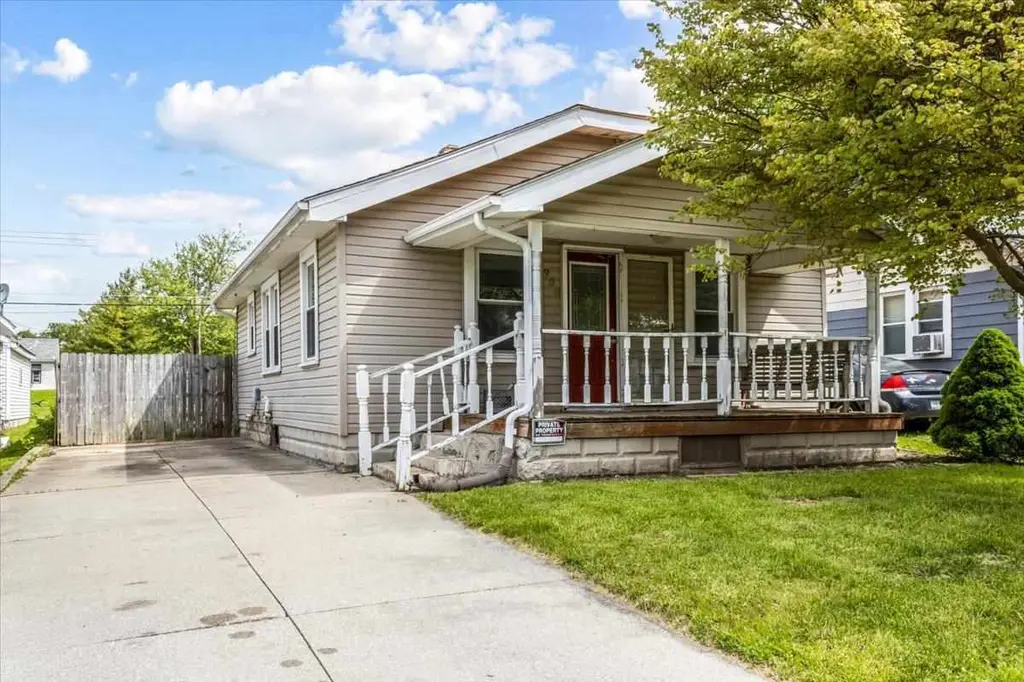
908 W 14th St · Muncie, IN
Flood risk 1/10 · Minimal
- FEMA flood zone
- X (unshaded)
- Chance of flooding over 30 yrs
- 0.0%
- Est. flood insurance / yr
- $473 – $860
Fire risk 1/10 · Minimal
- Est. fire insurance / yr
- $717 – $1,331
Heat risk 3/10 · Minor
- Hot days now (above 100°F)
- 7 days/yr
- Hot days in 30 yrs
- 18 days/yr
Wind risk 2/10 · Minimal
- Chance of severe wind over 30 yrs
- 0.0%
Air-quality risk 3/10 · Minor
- Unhealthy air days now
- 2 days/yr
- Unhealthy air days in 30 yrs
- 3 days/yr
Risk factors via First Street. Map © Google.
Why this score? — see what drove the B- grade
The composite is a weighted blend of 9 inputs, each scored 0–100. Each bar is that input's sub-score; the figure is the points it added to the 100-point composite (weight × sub-score).
- Cash flow +30.0/30.0
- 1% rule +10.0/10.0
- DSCR +10.0/10.0
- ARV discount +5.3/15.0
- Rent growth +4.0/5.0
- Livability +4.0/5.0
- Condition / age +2.5/5.0
- Schools +1.7/10.0
- Appreciation +0.0/10.0
$69,900
🖨 Deal sheet (PDF) 📄 Offer letter ✓ Due diligence
Listing remarks MLS
2-bedroom, 1-bath home in Muncie with all the essentials in a manageable layout. Enjoy relaxing mornings on the covered front porch and a functional open-concept living and kitchen area that creates an inviting flow throughout the home. The open back porch overlooks a fenced backyard, providing great space. Located near everyday amenities, this property offers a practical and welcoming place to call home.
Key facts
- Covered front porch
- Open-concept living
- Fenced backyard
Tags
Property features AI
Exterior
- Parking: Concrete parking
- Utilities: Public water; Public sewer
- Home design: Single-family site-built home; One story
- Construction: Vinyl siding
- Exterior features: Wood privacy fencing; Asphalt shingle roof
Interior
- Flooring: Carpet; Vinyl
- Bathrooms: 1 full bathroom (main level)
- Heating & cooling: Central air; Ceiling fans; Natural gas forced air heating; Has heating and cooling
- Interior features: Breakfast bar; Ceiling fans
- Laundry & utility: Electric dryer hookup on main level; Full unfinished basement
Neighborhood map
What this means for you Summary
Snapshot
- This is a 2-bed/1.0-bath single-family listed at $70k.
Deal economics
- At list price, monthly cash flow is $433 ($5k/yr) — positive.
- The deal already cash-flows at list — no discount required.
- Meets the 1% rule at list price ($1k rent vs $70k).
- Cap rate 13.7% vs local median 6.0% in Muncie — top-decile yield for the area; either an underpriced asset or a hidden risk that comps aren't pricing in. Stress-test before assuming the spread holds.
Location & tenants
- Location reads 80/100 on livability (#18 in IN, #1,654 nationally) — a professional / high-income tenant draw. Strengths: amenities A+, commute A+, cost of living A+; Watch: crime F, employment F.
- Muncie Community Schools (urban): math 18% / reading 25% proficiency, ranked #275 of 301 in IN (top 91%) — low school quality limits family demand, transient renter base, plan for 1-2y turnover; 68% free/reduced lunch — lower-income household profile, screen leases tightly.
- Zoned schools: Southside Middle School (math 7% / reading 15%, grade F, #312 of 330 statewide, top 95%, 443 students, 85% FRL) — zoned schools average 85% FRL vs 68% district-wide (17 pts higher); higher-poverty schools than district average — tighter screening recommended.
- Market conditions: Rents rising fast (+6.1%/yr); 148 active listings in the ZIP; 15 comparable units currently listed for rent nearby; rentals lingering (median 45d on market — plan ~5-8 weeks vacancy on turnover, expect pricing pressure); 100% of comp listings sitting > 30 days — soft ceiling on asking rent; 171 units permitted in Delaware County in 2024 (57 in 5+ unit buildings).
Forward outlook
- Local home prices are declining (-3.0%/yr); year-one equity from $483 of loan paydown is wiped out by about $2k of value loss. Plan a longer hold.
- Delaware County population projected at -11% by 2050 — secular population decline; favor cash flow + early exit over multi-decade hold.
- At projected returns (-3.0% appreciation + 6.1% rent growth), your $20k cash investment doubles in ~5 years — after that, you're playing with house money.
Negotiation context
- Only 7 days on market — expect competitive offers; lowballing is unlikely to land.
- 4 sale attempts since 13y ago with the ask held roughly flat each time — persistent listings suggest the price (not the market) is what's stuck; bring a comps-based counter.
- Current owner paid $36k; list at $70k implies a 94% gain — meaningful room to come down on a strong offer.
Risks & watch-outs
- Watch-outs: built in 1924 — expect roof / HVAC / electrical / plumbing capex.
Questions for the listing agent
- Built in 1924 — when were the roof, HVAC, electrical panel, plumbing, and water heater last replaced?
- Is there a deadline driving the sale (1031 exchange, divorce, estate, relocation)? That informs how much negotiation room exists.
- Schools are D-rated, which usually means shorter tenancies and higher turnover. Who's the typical renter profile here, and what's been the actual vacancy rate?
- Crime grade is F in this area — have there been break-ins, vandalism, or insurance claims at this property in the last 3 years? What carrier currently insures it and at what premium?
- What's the average days-on-market for RENTAL listings here right now (not sales)? A rising rental-DOM trend means longer vacancies and softer asking-rent achievability than the comps imply.
- What's the recent tenant-quality profile in this submarket — average credit score on applications, eviction rate, late-payment / NSF rate, and stable-employment percentage? A property-management company in the area should have these aggregated.
- How much new for-sale + rental construction is in the pipeline within 1–3 miles? Heavy new supply typically softens prices + rents 12–24 months out; constrained supply supports both.
Investment metrics
- 1% rule
- 1.61% ✓
- Cap rate
- 13.73%
- Cash-on-cash
- 26.57%
- DSCR
- 2.18
- GRM
- 5.2
CMA / ARV
- ARV (median comp)
- $66,696
- List price
- $69,900
- Delta
- 4.80%
- Verdict
- FAIR
- Comps
- 20 within 1.0 mi
Show comp detail 12 sales within ~0.75 mi
| Address | Dist | Beds/Ba | Sqft | Sold | Price | $/sf | Match |
|---|---|---|---|---|---|---|---|
| 605 W 10th St | 0.30mi | 3/1.0 (+1) | 1,688 (+4%) | 3mo | $73,500 | $44 | 72 |
| 1712 W 15th St | 0.52mi | 2/1.0 | 1,663 (+2%) | 5mo | $81,000 | $49 | 68 |
| 1114 W 17th St | 0.20mi | 3/1.0 (+1) | 1,871 (+15%) | 0mo | $75,500 | $40 | 61 |
| 2409 S Elliott St | 0.21mi | 3/2.0 (+1) | 1,456 (-11%) | 3mo | $120,000 | $82 | 61 |
| 2300 S Hoyt Ave | 0.32mi | 2/1.0 | 1,848 (+13%) | 4mo | $65,000 | $35 | 60 |
| 2111 S Mulberry St | 0.57mi | 3/1.0 (+1) | 1,680 (+3%) | 8mo | $29,900 | $18 | 57 |
| 1438 W 13th St | 0.37mi | 3/1.5 (+1) | 1,462 (-10%) | 2mo | $149,900 | $103 | 57 |
| 1720 W 7th St | 0.68mi | 3/1.0 (+1) | 1,722 (+6%) | 2mo | $6,500 | $4 | 52 |
| 2823 S High St | 0.73mi | 3/1.0 (+1) | 1,548 (-5%) | 1mo | $18,500 | $12 | 52 |
| 1724 S Elm St | 0.73mi | 2/1.0 | 1,746 (+7%) | 9mo | $67,000 | $38 | 47 |
| 124 E 8th St | 0.68mi | 3/1.0 (+1) | 1,456 (-11%) | 8mo | $97,150 | $67 | 39 |
| 2001 S Jefferson St | 0.63mi | 3/2.0 (+1) | 1,804 (+11%) | 8mo | $165,000 | $91 | 38 |
Match score weights: distance 35% · size 25% · config 20% · recency 20%. Top-matched comps best support the ARV.
Projected returns pro-forma
-3.0% appreciation · 6.11% rent growth · sell at horizon
- IRR
- 23.8%
- Equity multiple
- 2.02×
- Total profit
- $19,896
- Equity at exit
- $10,422
- IRR
- 33.5%
- Equity multiple
- 4.51×
- Total profit
- $68,708
- Equity at exit
- $6,044
Cash invested: $19,572 (down + closing). Projections, not guarantees.
Landlord ↔ Tenant lean methodology
- Overall (STATE)
- 90 Strongly Landlord-Friendly
- State Indiana
- 90 Strongly Landlord-Friendly · R+11
- County
- — inherits STATE
- City
- — inherits STATE
ZIP-level market 47302
- Home prices YoY
- -12.6%
- Rents YoY
- 6.1%
- Active inventory
- 148
- Price-to-rent
- 5.2×
Monthly cashflow live
- Estimated rent
- $1,123 high interval (Pro) →
- Mortgage (P&I)
- −$367
- Tax from tax record
- −$58 /mo · $695/yr
- Insurance
- −$29
- HOA
- −$0
- Vacancy / Maint / Mgmt
- −$236
- Net cashflow
- $433
Break-even live
Sensitivity live
| Price | -10% $473 | -5% $453 | +0% $433 | +5% $414 | +10% $394 |
|---|---|---|---|---|---|
| Rent | -10% $345 | -5% $389 | +0% $433 | +5% $478 | +10% $522 |
| Rate | -1.0pp $469 | -0.5pp $451 | base $433 | +0.5pp $415 | +1.0pp $397 |
UW: 25.0% down · 7.5% · 30yr · 1.5% tax · 5.0% vac · 8.0% maint · 8.0% mgmt
Financing live
Cash to close
- Down payment
- $17,475
- Closing costs
- $2,097
- Reserves months
- —
- Total cash needed
- —
Loan-product check · same deal, 3 products live
Conventional
25% down · 7.5% · 30yr
- Down + closing
- —
- Monthly P&I
- —
- Monthly cashflow
- —
- DSCR
- —
- Eligible?
- —
Personal DTI + credit; lowest rate.
DSCR
20% down · 8.5% · 30yr
- Down + closing
- —
- Monthly P&I
- —
- Monthly cashflow
- —
- DSCR
- —
- Eligible?
- —
No personal income docs; deal must DSCR.
Hard money
10% down · 12.0% · 12mo
- Down + closing
- —
- Monthly P&I
- —
- Monthly cashflow
- —
- DSCR
- —
- Eligible?
- —
Short-term bridge; refi at stabilization.
Rent comps 15 comps
| Address | Beds | Baths | Sqft | Rent | $/sqft | DOM | Units | Dist |
|---|---|---|---|---|---|---|---|---|
| 605 W 10th St Muncie, IN | 3.0 | 1.0 | 1688 | $1,150 | $0.68 | 45d | 1 | 0.29mi |
| 623 W 9th St Muncie, IN | 3.0 | 1.0 | 1574 | $1,499 | $0.95 | 45d | 1 | 0.32mi |
| 301 E Memorial Dr Muncie, IN | 3.0 | 1.5 | 1172 | $1,099 | $0.94 | 45d | 1 | 0.64mi |
| 1001 W 1st St Unit 1 Muncie, IN | 3.0 | 1.5 | 1098 | $875 | $0.80 | 45d | 1 | 0.74mi |
| 2112 W 11th St Muncie, IN | 3.0 | 2.0 | 1646 | $1,000 | $0.61 | 45d | 1 | 0.79mi |
| 417 S Council St Muncie, IN | 3.0 | 1.0 | 1132 | $1,025 | $0.91 | 45d | 1 | 0.96mi |
| 412 W Howard St Muncie, IN | 3.0 | 1.0 | 1300 | $1,000 | $0.77 | 45d | 1 | 0.97mi |
| 514 W Charles St Muncie, IN | 2.0 | 1.0 | 1062 | $800 | $0.75 | 45d | 1 | 1.02mi |
| 522 W Adams St Muncie, IN | 2.0 | 1.0 | 750 | $810 | $1.08 | 45d | 6 | 1.08mi |
| 312 S Calvert St Muncie, IN | 3.0 | 1.0 | 1813 | $1,500 | $0.83 | 45d | 1 | 1.16mi |
| 3106 S Vine St Muncie, IN | 3.0 | 1.0 | 1080 | $1,200 | $1.11 | 45d | 1 | 1.17mi |
| 1719 W Adams St Muncie, IN | 2.0 | 1.0 | 1159 | $1,000 | $0.86 | 45d | 1 | 1.18mi |
| 2800 W Memorial Dr Muncie, IN | 3.0 | 2.0 | 1216 | $1,139 | $0.94 | 45d | 1 | 1.23mi |
| 328 S Talley Ave Muncie, IN | 2.0 | 1.0 | 1770 | $1,400 | $0.79 | 45d | 1 | 1.25mi |
| 1109 E Kirby Ave Muncie, IN | 2.0–3.0 | 1.0 | 971 | $835 | $0.86 | 45d | 2 | 1.37mi |
Listing history 5 events
-
2026-05-14$69,900 Active 408-char remark
Show marketing remark (408 chars)
2-bedroom, 1-bath home in Muncie with all the essentials in a manageable layout. Enjoy relaxing mornings on the covered front porch and a functional open-concept living and kitchen area that creates an inviting flow throughout the home. The open back porch overlooks a fenced backyard, providing great space. Located near everyday amenities, this property offers a practical and welcoming place to call home.
-
2019-05-13soldstatus $36,000
-
2019-03-25$36,000
-
2013-09-20$29,900
ⓘ Source: listings_history table (triggers on properties + properties_extension) + one-shot
backfill from property_details.listing_events for pre-trigger history.
Tax reassessment forecast IN · Partial reset (capped growth)
- Current annual tax
- $695 · $58/mo
- Projected year-2 tax
- $695 · $58/mo
- Expected delta
- $0/yr ($0/mo · 0.0%)
ⓘ Screening estimate from a state-policy table — verify with the county assessor before closing.
Climate risk First Street
- Flood 1/10 Low FEMA zone X (unshaded) · 0% chance over 30 yrs
- Wildfire 1/10 Low
- Heat 3/10 Moderate 7 d/yr ≥100°F today · 18 d/yr by 30 yrs out
- Wind 2/10 Low 0% chance of damaging wind over 30 yrs
- Air quality 3/10 Moderate 2 unhealthy d/yr today · 3 by 30 yrs out
Nearby sold comps map
Loading sold comps map…
Walkable amenities ~0.75 mi
Loading nearby amenities…
Taxation est. · year 1
- Rental income
- $13,473
- − Mortgage interest
- −$3,915
- − Property taxes
- −$695
- − Insurance
- −$350
- − Repairs & maintenance
- −$1,078
- − Management
- −$1,078
- − Depreciation
- −$2,033
- Taxable income
- $4,324
- Est. tax owed @ 24.0%
- −$1,038
- After-tax cash flow
- $4,163/yr
For passive investors: Depreciation is non-cash, so a rental often shows a tax loss while cash-flowing — sheltering income. Rental losses are passive: they offset passive income freely, and up to $25,000/yr can offset ordinary (W-2) income if you actively participate and your MAGI is under $100k (phasing out to $0 by $150k); unused losses carry forward. On sale, claimed depreciation is recaptured at up to 25%, and gains may owe capital-gains tax (a 1031 exchange can defer both). Figures are a year-1 estimate at your 24.0% rate — not tax advice; consult a CPA.
Schools (NCES district)
- District
- Muncie Community Schools
- NCES district ID
- 1807320
- Math proficiency
- 18% ▼ -9.00%
- Reading proficiency
- 25% ▼ -4.00%
- Median HH income
- $30,052
- Composite
- 17.22/100
- National rank
- #9099
- State rank
- #275 of 301 in IN
Livability — Muncie
- Score
- 80/100
- State rank
- #18
- US rank
- #1654
Category grades
Schools grade is shown separately in the Schools card above.
Census & demographics
- Census place
- Muncie, IN
- County
- Delaware County · 84,658 people
- City population
- 84,658
- Metro
- Muncie, IN
- Population (ZIP)
- 25,473
- Household income
- $47,837
- Rent vs Own
- Severe rent burden
- 1150.0
Population outlook (Delaware County) Hauer SSP2
- Today (2025)
- 113,036 people
- By 2030
- 111,313 · -1.5%
- By 2040
- 106,432 · -5.8%
- By 2050
- 100,747 · -10.9%
- By 2075
- 91,000 · -19.5%
- By 2100
- 80,687 · -28.6%
Race, ethnicity, and origin ACS 2023
- Neighborhood character
- Predominantly White (84%)
- Race & ethnicity
- White 84% Two or more races 6% Black 6% Hispanic / Latino 4%
- Common ancestry
- Italian 2% Slovak 1% Romanian 1%
- Foreign-born
- 1% · Canada
- Languages at home
- 98% English-only · Spanish 1% German/W. Germanic 1%
Political lean MEDSL · Delaware
- 2024 margin
- R (+15.8) · D 41.2% · R 57.0% · Other 1.8%
- 2008→2024 swing
- -30.8pp toward R · 2008: 15.0pp · 2024: -15.8pp
- All cycles
- 2024: R+15.8 2020: R+13.2 2016: R+13.7 2012: D+3.1 2008: D+15.0
Not yet ingested
- Civics
- —
Market trends
- HPI YoY
- ▼ -30.32%
- Current HPI
- 210.431
- Rent YoY
- ▲ 6.11%
- Metro
- Muncie, IN
- State GDP YoY
- ▲ 2.90%
- F500 in state
- 18
Industry mix (Fortune 500 HQ in IN)
| Industry | F500 HQs | Revenue |
|---|---|---|
| Industrial Machinery | 2 | $37B |
|
||
| Healthcare | 1 | $177B |
|
||
| Pharmaceuticals | 1 | $45B |
|
||
| Metals / Steel | 1 | $18B |
|
||
| Agriculture | 1 | $17B |
|
||
| Packaging | 1 | $12B |
|
||
Price history
+133.8% since first listed7 events — show timeline
- 2026-05-23 Pending — RRELMS
- 2026-05-21 Pending — IRMLS
- 2026-05-14 Listed $69,900 IRMLS
- 2026-05-14 Listed $69,900 RRELMS
- 2019-05-13 Sold (MLS) $36,000 IRMLS
- 2019-03-25 Listed $36,000 IRMLS
- 2013-09-20 Listed $29,900 IRMLS
Property tax history
-6.5%/yrLatest (2024): $695 · +10.1% YoY. Source: county tax records.
Cash-flow waterfall
monthlySold comps — $/sqft
last 12 mo · ≤1 miLoading sold comps…