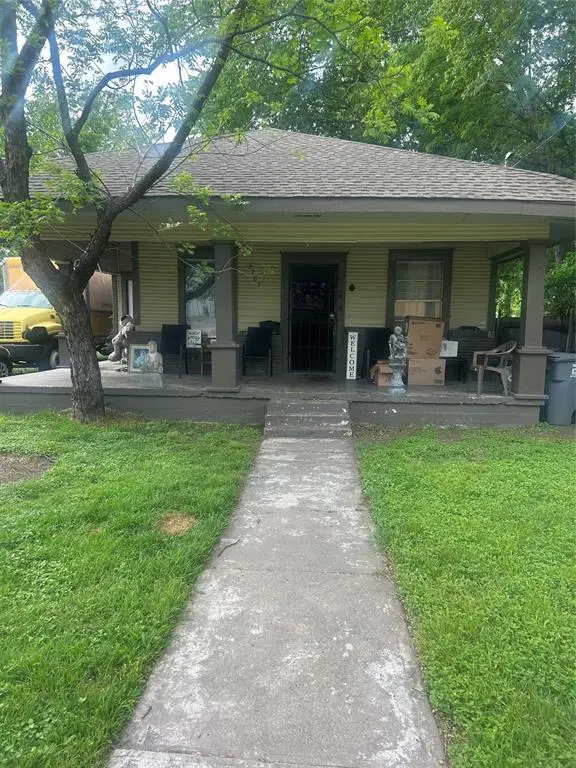
2705 Warren Ave · Dallas, TX
Flood risk 7/10 · Major
- FEMA flood zone
- X (unshaded)
- Chance of flooding over 30 yrs
- 0.99%
- Est. flood insurance / yr
- $507 – $1,088
Fire risk 1/10 · Minimal
- Est. fire insurance / yr
- $1,222 – $2,270
Heat risk 7/10 · Major
- Hot days now (above 110°F)
- 7 days/yr
- Hot days in 30 yrs
- 24 days/yr
Wind risk 6/10 · Moderate
- Chance of severe wind over 30 yrs
- 27.0%
Air-quality risk 3/10 · Minor
- Unhealthy air days now
- 2 days/yr
- Unhealthy air days in 30 yrs
- 3 days/yr
Risk factors via First Street. Map © Google.
Why this score? — see what drove the A- grade
The composite is a weighted blend of 9 inputs, each scored 0–100. Each bar is that input's sub-score; the figure is the points it added to the 100-point composite (weight × sub-score).
- Cash flow +28.8/30.0
- ARV discount +15.0/15.0
- DSCR +10.0/10.0
- 1% rule +9.0/10.0
- Appreciation +5.4/10.0
- Rent growth +4.3/5.0
- Livability +4.0/5.0
- Schools +2.8/10.0
- Condition / age +2.5/5.0
$179,900
🖨 Deal sheet 📄 Offer letter ✓ Due diligence
Listing remarks MLS
Located in the heart of historic South Dallas, this 4-bedroom, 2-bath single-story home is full of character and ready for its next chapter. With timeless architectural details and a spacious layout, this property offers the perfect canvas for renovation, restoration, or investment. Set in a well-established neighborhood rich in history, this home is ideal for buyers looking to bring new life to a classic property. Whether you're envisioning a personal residence or a value-add project, the potential here is undeniable. Conveniently situated just minutes from downtown Dallas, Fair Park, and major highways including I-45 and I-30, you’ll enjoy easy access to dining, entertainment, and employment centers. Sold as-is, this is a rare opportunity to invest in a location with strong upside and long-term growth potential.
Key facts
- Spacious layout
- 7,057 sq ft lot
- Built 1926
Tags
Neighborhood map
What this means for you Summary
Snapshot
- This is a 4-bed/2.0-bath single-family listed at $180k.
Deal economics
- At list price, monthly cash flow is $536 ($6k/yr) — positive.
- The deal already cash-flows at list — no discount required.
- Meets the 1% rule at list price ($3k rent vs $180k).
- Recommended offer: $175k (3.0% below list) — sets the bar for market timing.
- Cap rate 10.3% vs local median 2.3% in Dallas — top-decile yield for the area; either an underpriced asset or a hidden risk that comps aren't pricing in. Stress-test before assuming the spread holds.
Location & tenants
- Location reads 81/100 on livability (#24 in TX, #1,380 nationally) — a professional / high-income tenant draw. Strengths: amenities A+, commute A+, housing A+; Watch: schools C-, crime F.
- Dallas ISD (urban): math 31% / reading 36% proficiency, ranked #559 of 826 in TX (top 68%) — families likely to look elsewhere, expect single-tenant / working-renter base with shorter leases; 83% free/reduced lunch — lower-income household profile, screen leases tightly.
- Market conditions: Rents rising fast (+7.2%/yr); 248 active listings in the ZIP; 36 comparable units currently listed for rent nearby; rentals at typical pace (median 25d on market — plan ~3-4 weeks tenant-placement turnaround); 42% of comp listings sitting > 30 days — soft ceiling on asking rent; 12,577 units permitted in Dallas County in 2024 (6,829 in 5+ unit buildings).
- At $2,522/mo this rent would consume 66% of the median local household income ($46k/yr) (locally 1464% of renters already pay >50% of income on rent) — very limited rent-growth headroom before tenants either downsize or default.
Forward outlook
- In year one you build about $3k of equity ($1k loan paydown + $1k appreciation (0.8% local appreciation)).
- Dallas County population projected at +35% by 2050 — long-run rental-demand tailwind backs the buy-and-hold thesis.
- At projected returns (0.8% appreciation + 7.2% rent growth), your $50k cash investment doubles in ~5 years — after that, you're playing with house money.
Negotiation context
- It's been on market 58 days — a 3% lower offer ($175k) is reasonable based on typical stale-listing flexibility.
- 4 sale attempts since 2y ago; this cycle's ask has dropped $40k (18%) from the opening price — seller is motivated, your offer sets the floor, not the list.
Risks & watch-outs
- Watch-outs: flood insurance adds $66/mo; built in 1926 — expect roof / HVAC / electrical / plumbing capex.
- Climate carrying-cost: major flood risk; major wind risk, 27% chance of damaging wind over 30y; extreme-heat days projected 7→24/yr by 2055 (HVAC capex compounding) — expect insurance premiums to compound above CPI over the hold.
Questions for the listing agent
- It's been on market 58 days. Have you received any prior offers? Is the seller open to a 3% concession, seller financing, or rate buy-down credit?
- Built in 1926 — when were the roof, HVAC, electrical panel, plumbing, and water heater last replaced?
- What's the actual annual flood-insurance premium (NFIP or private), and is the property in a SFHA with mandatory coverage?
- Is there a deadline driving the sale (1031 exchange, divorce, estate, relocation)? That informs how much negotiation room exists.
- Crime grade is F in this area — have there been break-ins, vandalism, or insurance claims at this property in the last 3 years? What carrier currently insures it and at what premium?
- What's the average days-on-market for RENTAL listings here right now (not sales)? A rising rental-DOM trend means longer vacancies and softer asking-rent achievability than the comps imply.
- What's the recent tenant-quality profile in this submarket — average credit score on applications, eviction rate, late-payment / NSF rate, and stable-employment percentage? A property-management company in the area should have these aggregated.
- How much new for-sale + rental construction is in the pipeline within 1–3 miles? Heavy new supply typically softens prices + rents 12–24 months out; constrained supply supports both.
Investment metrics
- 1% rule
- 1.40% ✓
- Cap rate
- 10.31%
- Cash-on-cash
- 14.34%
- DSCR
- 1.64
- GRM
- 5.9
CMA / ARV
- ARV (median comp)
- $333,639
- List price
- $179,900
- Delta
- -46.08%
- Verdict
- UNDERPRICED
- Comps
- 20 within 1.0 mi
Show comp detail 12 sales within ~0.75 mi
| Address | Dist | Beds/Ba | Sqft | Sold | Price | $/sf | Match |
|---|---|---|---|---|---|---|---|
| 2618 Birmingham Ave | 0.06mi | 3/2.5 (-1) | 1,800 (-0%) | 1mo | $314,900 | $175 | 88 |
| 2807 Tanner St | 0.13mi | 3/2.0 (-1) | 1,782 (-1%) | 1mo | $264,000 | $148 | 86 |
| 2317 Peabody Ave | 0.36mi | 4/2.5 | 1,792 (-1%) | 4mo | $314,500 | $176 | 77 |
| 2620 Peabody Ave | 0.16mi | 3/3.5 (-1) | 1,850 (+2%) | 3mo | $345,000 | $186 | 75 |
| 3516 Booker St | 0.20mi | 4/2.0 | 1,606 (-11%) | 1mo | $268,500 | $167 | 71 |
| 2616 Peabody Ave | 0.17mi | 3/3.5 (-1) | 1,690 (-6%) | 2mo | $345,000 | $204 | 69 |
| 3503 Meyers St | 0.27mi | 3/1.0 (-1) | 1,890 (+4%) | 3mo | $105,000 | $56 | 68 |
| 2512 Peabody Ave | 0.23mi | 3/3.5 (-1) | 1,700 (-6%) | 2mo | $355,000 | $209 | 67 |
| 3113 Pennsylvania Ave | 0.44mi | 4/2.0 | 1,658 (-8%) | 2mo | $200,000 | $121 | 64 |
| 3144 Harmon St | 0.59mi | 3/2.5 (-1) | 1,813 (+0%) | 5mo | $297,000 | $164 | 61 |
| 2823 South Blvd | 0.37mi | 3/3.5 (-1) | 1,601 (-11%) | 0mo | $199,500 | $125 | 52 |
| 3604 Wendelkin St | 0.58mi | 4/3.0 | 2,000 (+11%) | 3mo | $388,500 | $194 | 49 |
Match score weights: distance 35% · size 25% · config 20% · recency 20%. Top-matched comps best support the ARV.
Projected returns pro-forma
0.79% appreciation · 7.19% rent growth · sell at horizon
- IRR
- 17.7%
- Equity multiple
- 1.93×
- Total profit
- $46,876
- Equity at exit
- $59,449
- IRR
- 24.1%
- Equity multiple
- 4.31×
- Total profit
- $166,536
- Equity at exit
- $77,505
Cash invested: $50,372 (down + closing). Projections, not guarantees.
Landlord ↔ Tenant lean methodology
- Overall (STATE)
- 87 Strongly Landlord-Friendly
- State Texas
- 87 Strongly Landlord-Friendly · R+5
- County
- — inherits STATE
- City
- — inherits STATE
ZIP-level market 75215
- Home prices YoY
- 0.3%
- Rents YoY
- 7.2%
- Active inventory
- 248
- Price-to-rent
- 5.9×
Monthly cashflow live
- Estimated rent
- $2,522 high interval (Pro) →
- Mortgage (P&I)
- −$943
- Tax from tax record
- −$372 /mo · $4,465/yr
- Insurance
- −$75
- Flood insurance flood zone
- −$66 /mo · $798/yr
- HOA
- −$0
- Vacancy / Maint / Mgmt
- −$530
- Net cashflow
- $536
Break-even live
UW: 25.0% down · 7.5% · 30yr · 1.5% tax · 5.0% vac · 8.0% maint · 8.0% mgmt
Financing live
Cash to close
- Down payment
- $44,975
- Closing costs
- $5,397
- Reserves months
- —
- Total cash needed
- —
Loan-product check · same deal, 3 products live
Conventional
25% down · 7.5% · 30yr
- Down + closing
- —
- Monthly P&I
- —
- Monthly cashflow
- —
- DSCR
- —
- Eligible?
- —
Personal DTI + credit; lowest rate.
DSCR
20% down · 8.5% · 30yr
- Down + closing
- —
- Monthly P&I
- —
- Monthly cashflow
- —
- DSCR
- —
- Eligible?
- —
No personal income docs; deal must DSCR.
Hard money
10% down · 12.0% · 12mo
- Down + closing
- —
- Monthly P&I
- —
- Monthly cashflow
- —
- DSCR
- —
- Eligible?
- —
Short-term bridge; refi at stabilization.
Rent comps 36 comps
| Address | Beds | Baths | Sqft | Rent | $/sqft | DOM | Units | Dist |
|---|---|---|---|---|---|---|---|---|
| 2507 Birmingham Ave Dallas, TX | 3.0 | 2.5 | 1516 | $2,500 | $1.65 | 24d | 1 | 0.22mi |
| 2847 Metropolitan Ave Dallas, TX | 3.0 | 1.0 | 1344 | $2,050 | $1.53 | 22d | 1 | 0.29mi |
| 3502 Edgewood St Dallas, TX | 4.0 | 2.0 | 1866 | $2,523 | $1.35 | 2d | 1 | 0.36mi |
| 3521 S Harwood St Dallas, TX | 3.0 | 2.5 | 1750 | $2,700 | $1.54 | 3d | 1 | 0.54mi |
| 3413 Wendelkin St Dallas, TX | 3.0 | 2.5 | 1724 | $2,650 | $1.54 | 2d | 1 | 0.59mi |
| 3915 Coolidge St Dallas, TX | 4.0 | 2.0 | 1416 | $2,100 | $1.48 | 44d | 1 | 0.64mi |
| 3331 Spring Ave Dallas, TX | 3.0 | 2.0 | 1652 | $2,200 | $1.33 | 7d | 1 | 0.81mi |
| 3331 Spring Ave Dallas, TX | 3.0 | 2.0 | 1652 | $2,200 | $1.33 | 24d | 1 | 0.81mi |
| 2406 Merlin St Dallas, TX | 3.0 | 2.5 | 2004 | $2,500 | $1.25 | 7d | 1 | 0.81mi |
| 3523 Herrling St Dallas, TX | 3.0 | 2.0 | 1525 | $1,800 | $1.18 | 17d | 1 | 0.84mi |
| 2618 Carpenter Ave Dallas, TX | 4.0 | 3.0 | 2050 | $3,200 | $1.56 | 44d | 1 | 0.86mi |
| 4024 Colonial Ave Dallas, TX | 4.0 | 2.0 | 1560 | $2,400 | $1.54 | 24d | 1 | 0.87mi |
| 3609 Cleveland St Dallas, TX | 4.0 | 2.5 | 1500 | $2,700 | $1.80 | 7d | 1 | 0.88mi |
| 2312 Stoneman St Dallas, TX | 4.0 | 3.0 | 2106 | $3,100 | $1.47 | 4d | 1 | 0.94mi |
| 2714 Hector St Dallas, TX | 3.0 | 2.0 | 1233 | $2,100 | $1.70 | 24d | 1 | 0.95mi |
| 4503 Bradshaw St Dallas, TX | 4.0 | 2.0 | 1263 | $1,600 | $1.27 | 7d | 1 | 1.01mi |
| 3726 Copeland St Dallas, TX | 3.0 | 2.0 | 1298 | $1,690 | $1.30 | 6d | 1 | 1.12mi |
| 4220 Hamilton Ave Dallas, TX | 4.0 | 2.0 | 1692 | $2,350 | $1.39 | 44d | 1 | 1.16mi |
| 3619 York St Dallas, TX | 3.0 | 2.0 | 1298 | $1,740 | $1.34 | 7d | 1 | 1.18mi |
| 3801 Carpenter Ave Dallas, TX | 4.0 | 2.0 | 1454 | $2,400 | $1.65 | 44d | 1 | 1.20mi |
| 1874 Beaumont St Dallas, TX | 4.0 | 5.0 | 2578 | $4,900 | $1.90 | 44d | 1 | 1.21mi |
| 1713 Herald St Dallas, TX | 3.0 | 2.5 | 2142 | $2,300 | $1.07 | 7d | 1 | 1.22mi |
| 4934 Echo Ave Dallas, TX | 5.0 | 4.0 | 1815 | $2,900 | $1.60 | 44d | 1 | 1.22mi |
| 1711 Herald St Dallas, TX | 3.0 | 2.5 | 2140 | $2,350 | $1.10 | 44d | 1 | 1.23mi |
| 1512 Seegar St Unit 1508 Dallas, TX | 3.0 | 3.5 | 2003 | $3,250 | $1.62 | 44d | 1 | 1.23mi |
| 1508 Seegar St Dallas, TX | 3.0 | 3.5 | 1966 | $3,124 | $1.59 | 15d | 9 | 1.23mi |
| 2724 Swanson St Dallas, TX | 4.0 | 2.0 | 1368 | $2,350 | $1.72 | 44d | 1 | 1.26mi |
| 5000 Linder Ave Dallas, TX | 3.0 | 2.0 | 1327 | $1,950 | $1.47 | 44d | 1 | 1.26mi |
| 4014 Marshall Dr Dallas, TX | 4.0 | 2.0 | 1600 | $1,850 | $1.16 | 24d | 1 | 1.27mi |
| 2720 Morning Ave Dallas, TX | 3.0 | 2.0 | 1332 | $2,350 | $1.76 | 44d | 1 | 1.29mi |
| 2811 Morning Ave Dallas, TX | 3.0 | 2.0 | 1634 | $2,200 | $1.35 | 15d | 1 | 1.30mi |
| 1100 Corinth St Dallas, TX | 2.0–3.0 | 2.5–3.5 | 1572 | $3,595 | $2.29 | 44d | 10 | 1.33mi |
| 2840 Oakdale St Dallas, TX | 3.0 | 2.0 | 1379 | $1,900 | $1.38 | 44d | 1 | 1.33mi |
| 1805 Browder St Unit 1019612P Dallas, TX | 3.0 | 3.5 | 2357 | $6,830 | $2.90 | 6d | 1 | 1.34mi |
| 1805 Browder St #103 Dallas, TX | 3.0 | 3.5 | 2358 | $8,000 | $3.39 | 44d | 1 | 1.34mi |
| 2246 Hooper St Dallas, TX | 3.0 | 3.0 | 1870 | $2,400 | $1.28 | 44d | 1 | 1.49mi |
Listing history 25 events
-
2026-06-18days on market $179,900 Active 58 DOM
-
2026-06-17days on market $179,900 Active 57 DOM
-
2026-06-16days on market $179,900 Active 56 DOM
-
2026-06-15days on market $179,900 Active 55 DOM
-
2026-06-13days on market $179,900 Active 53 DOM
-
2026-06-09days on market $179,900 Active 49 DOM
-
2026-06-08days on market $179,900 Active 48 DOM
-
2026-06-07pricedays on market $179,900 Active 47 DOM
-
2026-06-04days on market $220,000 Active 44 DOM
-
2026-06-03days on market $220,000 Active 43 DOM
-
2026-06-02days on market $220,000 Active 42 DOM
-
2026-06-01days on market $220,000 Active 41 DOM
-
2026-05-31days on market $220,000 Active 40 DOM
-
2026-04-17$220,000 Active 834-char remark
Show marketing remark (834 chars)
Located in the heart of historic South Dallas, this 4-bedroom, 2-bath single-story home is full of character and ready for its next chapter. With timeless architectural details and a spacious layout, this property offers the perfect canvas for renovation, restoration, or investment. Set in a well-established neighborhood rich in history, this home is ideal for buyers looking to bring new life to a classic property. Whether you're envisioning a personal residence or a value-add project, the potential here is undeniable. Conveniently situated just minutes from downtown Dallas, Fair Park, and major highways including I-45 and I-30, you’ll enjoy easy access to dining, entertainment, and employment centers. Sold as-is, this is a rare opportunity to invest in a location with strong upside and long-term growth potential.
-
2025-02-27status Pending
-
2025-02-27historical
-
2024-12-30$195,000 Active
-
2024-09-30historical
-
2024-09-16status Active
-
2024-09-15historical
-
2024-08-20price $200,000
-
2024-07-19$225,000 Active
-
2009-01-26soldstatus
-
2009-01-26soldstatus
-
2005-03-17soldstatus
ⓘ Source: listings_history table (triggers on properties + properties_extension) + one-shot
backfill from property_details.listing_events for pre-trigger history.
Tax reassessment forecast TX · Resets to sale price
- Current annual tax
- $4,465 · $372/mo
- Projected year-2 tax
- $4,465 · $372/mo
- Expected delta
- $0/yr ($0/mo · 0.0%)
ⓘ Screening estimate from a state-policy table — verify with the county assessor before closing.
Climate risk First Street
- Flood 7/10 Severe FEMA zone X (unshaded) · 99% chance over 30 yrs
- Wildfire 1/10 Low
- Heat 7/10 Severe 7 d/yr ≥110°F today · 24 d/yr by 30 yrs out
- Wind 6/10 Major 27% chance of damaging wind over 30 yrs
- Air quality 3/10 Moderate 2 unhealthy d/yr today · 3 by 30 yrs out
Nearby sold comps map
Loading sold comps map…
Walkable amenities ~0.75 mi
Loading nearby amenities…
Taxation est. · year 1
- Rental income
- $30,265
- − Mortgage interest
- −$10,077
- − Property taxes
- −$4,465
- − Insurance
- −$1,697
- − Repairs & maintenance
- −$2,421
- − Management
- −$2,421
- − Depreciation
- −$5,233
- Taxable income
- $3,950
- Est. tax owed @ 24.0%
- −$948
- After-tax cash flow
- $5,479/yr
For passive investors: Depreciation is non-cash, so a rental often shows a tax loss while cash-flowing — sheltering income. Rental losses are passive: they offset passive income freely, and up to $25,000/yr can offset ordinary (W-2) income if you actively participate and your MAGI is under $100k (phasing out to $0 by $150k); unused losses carry forward. On sale, claimed depreciation is recaptured at up to 25%, and gains may owe capital-gains tax (a 1031 exchange can defer both). Figures are a year-1 estimate at your 24.0% rate — not tax advice; consult a CPA.
Schools (NCES district)
- District
- Dallas ISD
- NCES district ID
- 4816230
- Math proficiency
- 31% ▼ -16.00%
- Reading proficiency
- 36% ▼ -4.00%
- Median HH income
- $42,881
- Composite
- 28.41/100
- National rank
- #6763
- State rank
- #559 of 826 in TX
Livability — Dallas
- Score
- 81/100
- State rank
- #24
- US rank
- #1380
Category grades
Schools grade is shown separately in the Schools card above.
Census & demographics
- Census place
- Dallas, TX
- County
- Dallas County · 2,612,404 people
- City population
- 1,168,437
- Metro
- Dallas-Fort Worth-Arlington, TX
- Population (ZIP)
- 18,895
- Household income
- $45,557
- Rent vs Own
- Severe rent burden
- 1464.0
Population outlook (Dallas County) Hauer SSP2
- Today (2025)
- 2,979,839 people
- By 2030
- 3,191,823 · +7.1%
- By 2040
- 3,619,611 · +21.5%
- By 2050
- 4,026,915 · +35.1%
- By 2075
- 4,957,073 · +66.4%
- By 2100
- 5,508,725 · +84.9%
Race, ethnicity, and origin ACS 2023
- Neighborhood character
- Diverse neighborhood (Simpson 0.58)
- Race & ethnicity
- Black 59% Hispanic / Latino 25% White 11% Two or more races 10%
- Hispanic origin (detail)
- Mexican 21%
- Common ancestry
- Italian 1% Hispanic 1%
- Foreign-born
- 16% · Canada
- Languages at home
- 74% English-only · Spanish 26%
Political lean MEDSL · Dallas
- 2024 margin
- Strong D (+22.2) · D 60.2% · R 38.0% · Other 1.8%
- 2008→2024 swing
- +6.9pp toward D · 2008: 15.3pp · 2024: 22.2pp
- All cycles
- 2024: D+22.2 2020: D+31.6 2016: D+26.2 2012: D+15.4 2008: D+15.3
Not yet ingested
- Civics
- —
Market trends
- HPI YoY
- ▲ 0.79%
- Current HPI
- 224.2955
- Rent YoY
- ▲ 7.19%
- Metro
- Dallas-Fort Worth-Arlington, TX
- State GDP YoY
- ▲ 3.95%
- F500 in state
- 110
Industry mix (Fortune 500 HQ in TX)
| Industry | F500 HQs | Revenue |
|---|---|---|
| Energy | 16 | $1,198B |
|
||
| Technology | 5 | $198B |
|
||
| Engineering / Construction | 4 | $72B |
|
||
| Energy Services | 3 | $60B |
|
||
| Utilities | 3 | $41B |
|
||
| Healthcare | 2 | $330B |
|
||
Price history
-2.2% since first listed12 events — show timeline
- 2026-04-17 Listed $220,000 NTREIS
- 2025-02-27 Pending — NTREIS
- 2025-02-27 Listing Removed — NTREIS
- 2024-12-30 Listed $195,000 NTREIS
- 2024-09-30 Listing Removed — NTREIS
- 2024-09-16 Relisted — NTREIS
- 2024-09-15 Listing Removed — NTREIS
- 2024-08-20 Price Changed $200,000 NTREIS
- 2024-07-19 Listed $225,000 NTREIS
- 2009-01-26 Sold (Public Records) — Public Records
- 2009-01-26 Sold (Public Records) — Public Records
- 2005-03-17 Sold (Public Records) — Public Records
Property tax history
+9.8%/yrLatest (2025): $4,465 · +14.4% YoY. Source: county tax records.
Cash-flow waterfall
monthlySold comps — $/sqft
last 12 mo · ≤1 miLoading sold comps…