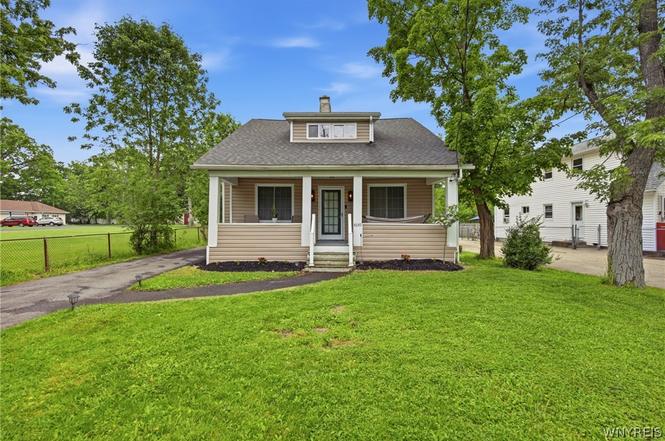
4649 Seneca St · West Seneca, NY
Flood risk 1/10 · Minimal
- FEMA flood zone
- X (unshaded)
- Chance of flooding over 30 yrs
- 0.0%
- Est. flood insurance / yr
- $473 – $860
Fire risk 3/10 · Minor
- Est. fire insurance / yr
- $691 – $1,283
Heat risk 2/10 · Minimal
- Hot days now (above 92°F)
- 7 days/yr
- Hot days in 30 yrs
- 16 days/yr
Wind risk 1/10 · Minimal
- Chance of severe wind over 30 yrs
- —
Air-quality risk 2/10 · Minimal
- Unhealthy air days now
- 1 days/yr
- Unhealthy air days in 30 yrs
- 2 days/yr
Risk factors via First Street. Map © Google.
Why this score? — see what drove the C+ grade
The composite is a weighted blend of 9 inputs, each scored 0–100. Each bar is that input's sub-score; the figure is the points it added to the 100-point composite (weight × sub-score).
- Cash flow +21.4/30.0
- ARV discount +15.0/15.0
- DSCR +6.8/10.0
- 1% rule +6.1/10.0
- Schools +4.5/10.0
- Livability +4.0/5.0
- Rent growth +2.5/5.0
- Condition / age +2.5/5.0
- Appreciation +0.0/10.0
$229,900
🖨 Deal sheet (PDF) 📄 Offer letter ✓ Due diligence
Listing remarks MLS
4649 Seneca Creek is a 3 bed 2 bath home in West Seneca. Completely renovated top to bottom!
Key facts
- Remodeled kitchen
- Custom molding
- Updated flooring
Tags
Property features AI
Exterior
- Parking: No garage
- Utilities: Public water connected; Sewer connected; Public utilities available
- Home design: Single-story home; Vinyl siding; Block foundation; Resale property
- Construction: Vinyl siding exterior; Block foundation; Existing (previously built) structure
- Exterior features: Blacktop driveway; Rectangular residential lot; City street frontage; Lot dimensions approximately 48 x 283
Interior
- Kitchen: Dishwasher; Gas oven; Gas range; Microwave; Refrigerator; Kitchen appliances negotiable
- Flooring: Carpet; Vinyl; Varied flooring
- Bathrooms: Two full bathrooms; One bathroom on the main level
- Heating & cooling: Gas forced-air heating; Central air conditioning; Gas water heater
- Interior features: Separate/formal dining room; Granite counters; Kitchen island; Primary bedroom with private bath; Full basement; Family room; Has fireplace (1)
- Laundry & utility: Washer; Dryer; Main-level laundry
Neighborhood map
What this means for you Summary
Snapshot
- This is a 4-bed/1.5-bath single-family listed at $230k.
Deal economics
- At list price, monthly cash flow is $341 ($4k/yr) — positive.
- The deal already cash-flows at list — no discount required.
- Meets the 1% rule at list price ($3k rent vs $230k).
- Cap rate 8.1% vs local median 3.7% in West Seneca — top-decile yield for the area; either an underpriced asset or a hidden risk that comps aren't pricing in. Stress-test before assuming the spread holds.
Location & tenants
- Location reads 79/100 on livability (#130 in NY, #2,089 nationally) — a middle-class / working-renter tenant base. Strengths: housing A+, health & safety A+, crime A-; Watch: amenities D, commute F.
- West Seneca Central School District (suburban): math 49% / reading 55% proficiency, ranked #336 of 590 in NY (top 57%) — acceptable for families but not a draw, mixed tenant base, ~2y average lease.
- Market conditions: 201 active listings in the ZIP; 1 comparable units currently listed for rent nearby; 1,244 units permitted in Erie County in 2024 (563 in 5+ unit buildings).
Forward outlook
- Local home prices are declining (-3.0%/yr); year-one equity from $2k of loan paydown is wiped out by about $7k of value loss. Plan a longer hold.
Negotiation context
- Only 8 days on market — expect competitive offers; lowballing is unlikely to land.
- 5 sale attempts since 6y ago with the ask held roughly flat each time — persistent listings suggest the price (not the market) is what's stuck; bring a comps-based counter.
- Current owner paid $190k; 21% above their basis — modest negotiation headroom, anchor on the comps not their cost.
Risks & watch-outs
- Watch-outs: built in 1945 — expect roof / HVAC / electrical / plumbing capex.
Questions for the listing agent
- Built in 1945 — when were the roof, HVAC, electrical panel, plumbing, and water heater last replaced?
- Is there a deadline driving the sale (1031 exchange, divorce, estate, relocation)? That informs how much negotiation room exists.
- Schools are B-rated — typically a magnet for longer-tenancy family renters. What's the average tenant stay here, and is there a school-zone premium baked into asking?
- What's the average days-on-market for RENTAL listings here right now (not sales)? A rising rental-DOM trend means longer vacancies and softer asking-rent achievability than the comps imply.
- What's the recent tenant-quality profile in this submarket — average credit score on applications, eviction rate, late-payment / NSF rate, and stable-employment percentage? A property-management company in the area should have these aggregated.
- How much new for-sale + rental construction is in the pipeline within 1–3 miles? Heavy new supply typically softens prices + rents 12–24 months out; constrained supply supports both.
Investment metrics
- 1% rule
- 1.11% ✓
- Cap rate
- 8.07%
- Cash-on-cash
- 6.36%
- DSCR
- 1.28
- GRM
- 7.5
CMA / ARV
- ARV (on-the-fly)
- $322,848
- Comps found
- 12
Show comp detail 12 sales within ~0.75 mi
| Address | Dist | Beds/Ba | Sqft | Sold | Price | $/sf | Match |
|---|---|---|---|---|---|---|---|
| 39 Joann Dr | 0.49mi | 3/1.5 (-1) | 1,388 (+2%) | 9mo | $327,000 | $236 | 62 |
| 261 Ehinger Dr | 0.61mi | 3/2.0 (-1) | 1,363 (-0%) | 8mo | $265,000 | $194 | 58 |
| 142 Sky Hi Dr | 0.38mi | 3/1.5 (-1) | 1,253 (-8%) | 7mo | $283,000 | $226 | 57 |
| 18 Joann Dr | 0.45mi | 4/2.0 | 1,220 (-11%) | 3mo | $345,000 | $283 | 57 |
| 277 Woodward Dr | 0.71mi | 3/1.5 (-1) | 1,430 (+4%) | 3mo | $344,960 | $241 | 52 |
| 1530 Center Rd | 0.70mi | 3/1.5 (-1) | 1,272 (-7%) | 0mo | $295,000 | $232 | 50 |
| 257 Ehinger Dr | 0.60mi | 4/1.0 | 1,456 (+6%) | 11mo | $277,000 | $190 | 50 |
| 386 Woodward Cres | 0.42mi | 3/2.0 (-1) | 1,524 (+11%) | 7mo | $401,000 | $263 | 48 |
| 22 Carol Dr | 0.65mi | 3/2.0 (-1) | 1,319 (-4%) | 10mo | $370,000 | $281 | 48 |
| 24 Lorry Dr | 0.71mi | 3/2.0 (-1) | 1,216 (-11%) | 6mo | $260,000 | $214 | 36 |
| 16 Treehaven Rd | 0.60mi | 3/1.0 (-1) | 1,562 (+14%) | 8mo | $330,000 | $211 | 35 |
| 272 Woodward Dr | 0.70mi | 3/2.0 (-1) | 1,192 (-13%) | 8mo | $350,000 | $294 | 32 |
Match score weights: distance 35% · size 25% · config 20% · recency 20%. Top-matched comps best support the ARV.
Projected returns pro-forma
-3.0% appreciation · 3.0% rent growth · sell at horizon
- IRR
- -6.5%
- Equity multiple
- 0.76×
- Total profit
- $-15,428
- Equity at exit
- $34,279
- IRR
- 3.2%
- Equity multiple
- 1.23×
- Total profit
- $14,921
- Equity at exit
- $19,878
Cash invested: $64,372 (down + closing). Projections, not guarantees.
Landlord ↔ Tenant lean methodology
- Overall (STATE)
- 15 Strongly Tenant-Friendly
- State New York
- 15 Strongly Tenant-Friendly · D+10
- County
- — inherits STATE
- City
- — inherits STATE
ZIP-level market 14224
- Active inventory
- 201
- Price-to-rent
- 7.5×
Monthly cashflow live
- Estimated rent
- $2,550 medium interval (Pro) →
- Mortgage (P&I)
- −$1,206
- Tax from tax record
- −$372 /mo · $4,462/yr
- Insurance
- −$96
- HOA
- −$0
- Vacancy / Maint / Mgmt
- −$536
- Net cashflow
- $341
Break-even live
Sensitivity live
| Price | -10% $471 | -5% $406 | +0% $341 | +5% $276 | +10% $211 |
|---|---|---|---|---|---|
| Rent | -10% $140 | -5% $241 | +0% $341 | +5% $442 | +10% $543 |
| Rate | -1.0pp $457 | -0.5pp $400 | base $341 | +0.5pp $282 | +1.0pp $221 |
UW: 25.0% down · 7.5% · 30yr · 1.5% tax · 5.0% vac · 8.0% maint · 8.0% mgmt
Financing live
Cash to close
- Down payment
- $57,475
- Closing costs
- $6,897
- Reserves months
- —
- Total cash needed
- —
Loan-product check · same deal, 3 products live
Conventional
25% down · 7.5% · 30yr
- Down + closing
- —
- Monthly P&I
- —
- Monthly cashflow
- —
- DSCR
- —
- Eligible?
- —
Personal DTI + credit; lowest rate.
DSCR
20% down · 8.5% · 30yr
- Down + closing
- —
- Monthly P&I
- —
- Monthly cashflow
- —
- DSCR
- —
- Eligible?
- —
No personal income docs; deal must DSCR.
Hard money
10% down · 12.0% · 12mo
- Down + closing
- —
- Monthly P&I
- —
- Monthly cashflow
- —
- DSCR
- —
- Eligible?
- —
Short-term bridge; refi at stabilization.
Rent comps 1 comps
| Address | Beds | Baths | Sqft | Rent | $/sqft | DOM | Units | Dist |
|---|---|---|---|---|---|---|---|---|
| 940 Reserve Rd Buffalo, NY | 3.0 | 1.5 | 1144 | $2,550 | $2.23 | 2d | 1 | 1.36mi |
Listing history 7 events
-
2026-06-19status $229,900 Pending 8 DOM
-
2026-06-18days on market $229,900 Active 8 DOM
-
2026-06-17days on market $229,900 Active 7 DOM
-
2026-06-16days on market $229,900 Active 6 DOM
-
2026-06-15days on market $229,900 Active 5 DOM
-
2026-06-13remarks 699-char remark
-
2026-06-13$229,900 Active 3 DOM
ⓘ Source: listings_history table (triggers on properties + properties_extension) + one-shot
backfill from property_details.listing_events for pre-trigger history.
Tax reassessment forecast NY · Partial reset (capped growth)
- Current annual tax
- $4,462 · $372/mo
- Projected year-2 tax
- $4,462 · $372/mo
- Expected delta
- $0/yr ($0/mo · 0.0%)
ⓘ Screening estimate from a state-policy table — verify with the county assessor before closing.
Climate risk First Street
- Flood 1/10 Low FEMA zone X (unshaded) · 0% chance over 30 yrs
- Wildfire 3/10 Moderate
- Heat 2/10 Low 7 d/yr ≥92°F today · 16 d/yr by 30 yrs out
- Wind 1/10 Low
- Air quality 2/10 Low 1 unhealthy d/yr today · 2 by 30 yrs out
Nearby sold comps map
Loading sold comps map…
Walkable amenities ~0.75 mi
Loading nearby amenities…
Taxation est. · year 1
- Rental income
- $30,600
- − Mortgage interest
- −$12,878
- − Property taxes
- −$4,462
- − Insurance
- −$1,150
- − Repairs & maintenance
- −$2,448
- − Management
- −$2,448
- − Depreciation
- −$6,688
- Taxable income
- $527
- Est. tax owed @ 24.0%
- −$126
- After-tax cash flow
- $3,969/yr
For passive investors: Depreciation is non-cash, so a rental often shows a tax loss while cash-flowing — sheltering income. Rental losses are passive: they offset passive income freely, and up to $25,000/yr can offset ordinary (W-2) income if you actively participate and your MAGI is under $100k (phasing out to $0 by $150k); unused losses carry forward. On sale, claimed depreciation is recaptured at up to 25%, and gains may owe capital-gains tax (a 1031 exchange can defer both). Figures are a year-1 estimate at your 24.0% rate — not tax advice; consult a CPA.
Schools (NCES district)
- District
- West Seneca Central School District
- NCES district ID
- 3630780
- Math proficiency
- 49% ▼ -15.00%
- Reading proficiency
- 55% ▼ -4.00%
- Median HH income
- $54,231
- Composite
- 44.83/100
- National rank
- #2735
- State rank
- #336 of 590 in NY
Livability — West Seneca
- Score
- 79/100
- State rank
- #130
- US rank
- #2089
Category grades
Schools grade is shown separately in the Schools card above.
Census & demographics
- Census place
- West Seneca, NY
- City population
- 41,101
- Population (ZIP)
- 41,101
Population outlook (Erie County) Hauer SSP2
- Today (2025)
- 933,037 people
- By 2030
- 935,181 · +0.2%
- By 2040
- 928,531 · -0.5%
- By 2050
- 905,725 · -2.9%
- By 2075
- 834,037 · -10.6%
- By 2100
- 708,033 · -24.1%
Race, ethnicity, and origin ACS 2023
- Neighborhood character
- Predominantly White (91%)
- Race & ethnicity
- White 91% Hispanic / Latino 4% Two or more races 3% Black 2%
- Common ancestry
- Romanian 22% Lithuanian 2% Iranian 1%
- Foreign-born
- 2% · Canada
- Languages at home
- 95% English-only · Spanish 2% Russian/Polish/Slavic 1% Arabic 1%
Political lean MEDSL · Erie
- 2024 margin
- Lean D (+9.7) · D 54.8% · R 45.2%
- 2008→2024 swing
- -7.9pp toward R · 2008: 17.5pp · 2024: 9.7pp
- All cycles
- 2024: D+9.7 2020: D+14.7 2016: D+4.8 2012: D+15.6 2008: D+17.5
Not yet ingested
- Civics
- —
Market trends
- HPI YoY
- ▼ -211.03%
- Current HPI
- 303.7523
- Rent YoY
- —
- Metro
- —
- State GDP YoY
- ▲ 2.60%
- F500 in state
- 92
Industry mix (Fortune 500 HQ in NY)
| Industry | F500 HQs | Revenue |
|---|---|---|
| Financial Services | 10 | $950B |
|
||
| Consumer Goods | 9 | $162B |
|
||
| Insurance | 4 | $225B |
|
||
| Telecommunications | 2 | $144B |
|
||
| Pharmaceuticals | 2 | $112B |
|
||
| Media / Entertainment | 2 | $69B |
|
||
Price history
+126.1% since first listed13 events — show timeline
- 2026-06-10 Listed $229,900 WNYREIS
- 2021-05-05 Sold (Public Records) $189,500 Public Records
- 2021-04-30 Listed $189,500 WNYREIS
- 2021-04-30 Sold (MLS) $189,500 WNYREIS
- 2020-06-23 Sold (MLS) $80,000 WNYREIS
- 2020-06-01 Pending — WNYREIS
- 2020-05-20 Price Changed $81,500 WNYREIS
- 2020-05-11 Relisted — WNYREIS
- 2020-05-01 Pending — WNYREIS
- 2020-05-01 Relisted — WNYREIS
- 2020-04-30 Pending — WNYREIS
- 2020-04-22 Price Changed $91,500 WNYREIS
- 2020-03-24 Listed $101,700 WNYREIS
Property tax history
+1.8%/yrLatest (2025): $4,462 · +0.3% YoY. Source: county tax records.
Cash-flow waterfall
monthlySold comps — $/sqft
last 12 mo · ≤1 miLoading sold comps…