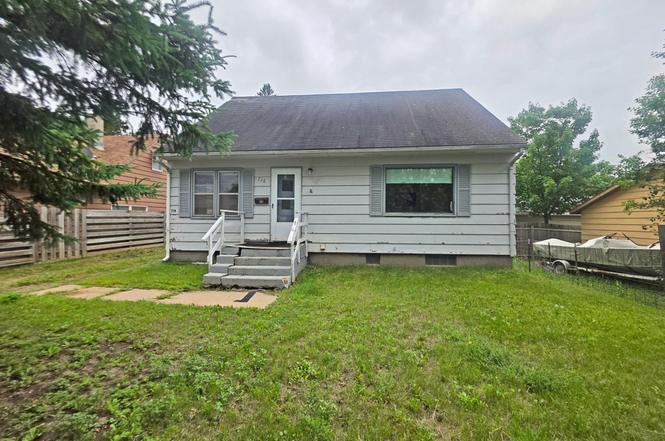
716 E 37th St · Hibbing, MN
Flood risk 1/10 · Minimal
- FEMA flood zone
- X
- Chance of flooding over 30 yrs
- 0.0%
- Est. flood insurance / yr
- $473 – $860
Fire risk 3/10 · Minor
- Est. fire insurance / yr
- $888 – $1,650
Heat risk 1/10 · Minimal
- Hot days now (above 91°F)
- 7 days/yr
- Hot days in 30 yrs
- 12 days/yr
Wind risk 1/10 · Minimal
- Chance of severe wind over 30 yrs
- —
Air-quality risk 2/10 · Minimal
- Unhealthy air days now
- 0 days/yr
- Unhealthy air days in 30 yrs
- 1 days/yr
Risk factors via First Street. Map © Google.
Why this score? — see what drove the B grade
The composite is a weighted blend of 9 inputs, each scored 0–100. Each bar is that input's sub-score; the figure is the points it added to the 100-point composite (weight × sub-score).
- Cash flow +30.0/30.0
- 1% rule +10.0/10.0
- DSCR +10.0/10.0
- ARV discount +7.5/15.0
- Schools +4.1/10.0
- Livability +4.0/5.0
- Rent growth +2.5/5.0
- Condition / age +2.5/5.0
- Appreciation +0.0/10.0
$53,000
🖨 Deal sheet 📄 Offer letter ✓ Due diligence
Listing remarks
Move-in ready 3BR, 2BA home in a quiet Hibbing neighborhood near parks, schools, shopping, dining, and more. Enjoy the spacious feel of 1,120 sq ft of well-laid-out living space with great natural light. Located just minutes from schools, plus easy access to trails, groceries, and medical facilities. With room to relax and everything close by, this home is perfect for comfort and convenience!
Key facts
- 0.31 acre lot
- Built 1955
- Listed 70 days
Neighborhood map
What this means for you Summary
Snapshot
- This is a 3-bed/2.0-bath single-family listed at $53k.
Deal economics
- At list price, monthly cash flow is $699 ($8k/yr) — positive.
- The deal already cash-flows at list — no discount required.
- Meets the 1% rule at list price ($1k rent vs $53k).
- Recommended offer: $50k (6.0% below list) — sets the bar for market timing.
- Cap rate 22.1% vs local median 6.4% in Hibbing — top-decile yield for the area; either an underpriced asset or a hidden risk that comps aren't pricing in. Stress-test before assuming the spread holds.
Location & tenants
- Location reads 79/100 on livability (#103 in MN, #2,307 nationally) — a middle-class / working-renter tenant base. Strengths: crime A+, cost of living A+, housing A+; Watch: employment D+, amenities F, commute F.
- Hibbing Public School District (town): math 43% / reading 54% proficiency, ranked #150 of 301 in MN (top 50%) — families likely to look elsewhere, expect single-tenant / working-renter base with shorter leases.
- Market conditions: 96 active listings in the ZIP; 5 comparable units currently listed for rent nearby; rentals leasing fast (median 14d on market — plan ~1-2 weeks tenant-placement turnaround); 40% of comp listings sitting > 30 days — soft ceiling on asking rent; 639 units permitted in St. Louis County in 2024 (338 in 5+ unit buildings).
- This rent runs 30% of the median local income ($56k/yr) — at the standard rent-burdened threshold; future hikes will face affordability resistance.
Forward outlook
- Local home prices are declining (-3.0%/yr); year-one equity from $366 of loan paydown is wiped out by about $2k of value loss. Plan a longer hold.
- At projected returns (-3.0% appreciation + 3.0% rent growth), your $15k cash investment doubles in ~3 years — after that, you're playing with house money.
Negotiation context
- It's been on market 70 days — a 6% lower offer ($50k) is reasonable based on typical stale-listing flexibility.
- 3 sale attempts; this cycle's ask has dropped $27k (34%) from the opening price — seller is motivated, your offer sets the floor, not the list.
Risks & watch-outs
- Watch-outs: property tax is 2.5% of price; built in 1955 — expect roof / HVAC / electrical / plumbing capex.
Questions for the listing agent
- It's been on market 70 days. Have you received any prior offers? Is the seller open to a 6% concession, seller financing, or rate buy-down credit?
- Built in 1955 — when were the roof, HVAC, electrical panel, plumbing, and water heater last replaced?
- Property tax is high relative to price — has the assessment been appealed recently, and will the sale trigger a re-assessment?
- Why hasn't it sold? Are there any deal-killer items the seller is aware of (foundation, flood, title, zoning, code violations)?
- Is there a deadline driving the sale (1031 exchange, divorce, estate, relocation)? That informs how much negotiation room exists.
- Schools are A-rated — typically a magnet for longer-tenancy family renters. What's the average tenant stay here, and is there a school-zone premium baked into asking?
- What's the average days-on-market for RENTAL listings here right now (not sales)? A rising rental-DOM trend means longer vacancies and softer asking-rent achievability than the comps imply.
- What's the recent tenant-quality profile in this submarket — average credit score on applications, eviction rate, late-payment / NSF rate, and stable-employment percentage? A property-management company in the area should have these aggregated.
- How much new for-sale + rental construction is in the pipeline within 1–3 miles? Heavy new supply typically softens prices + rents 12–24 months out; constrained supply supports both.
Investment metrics
- 1% rule
- 2.65% ✓
- Cap rate
- 22.12%
- Cash-on-cash
- 56.54%
- DSCR
- 3.52
- GRM
- 3.1
CMA / ARV
- ARV (on-the-fly)
- $151,200
- Comps found
- 12
Show comp detail 12 sales within ~0.75 mi
| Address | Dist | Beds/Ba | Sqft | Sold | Price | $/sf | Match |
|---|---|---|---|---|---|---|---|
| 1427 E 39th St | 0.36mi | 3/1.7 | 1,258 (+12%) | 1mo | $119,000 | $95 | 60 |
| 4053 Stuntz Dr | 0.61mi | 3/2.0 | 1,048 (-6%) | 4mo | $169,500 | $162 | 58 |
| 3825 E 4th Ave | 0.39mi | 2/1.7 (-1) | 975 (-13%) | 2mo | $79,000 | $81 | 53 |
| 3825 W 2nd Ave | 0.69mi | 3/1.8 | 1,123 (+0%) | 20mo | $140,000 | $125 | 50 |
| 3923 12th Ave Ave E | 0.33mi | 3/2.0 | 1,243 (+11%) | 21mo | $150,000 | $121 | 49 |
| 324 E 41st St | 0.59mi | 4/1.5 (+1) | 1,176 (+5%) | 14mo | $150,000 | $128 | 46 |
| 3330 Outer Dr | 0.52mi | 2/2.0 (-1) | 977 (-13%) | 6mo | $131,500 | $135 | 45 |
| 427 E 33rd St | 0.58mi | 4/1.3 (+1) | 1,021 (-9%) | 8mo | $140,000 | $137 | 44 |
| 4228 4th Ave. Ave E | 0.69mi | 2/1.2 (-1) | 992 (-11%) | 5mo | $141,500 | $143 | 37 |
| 3425 2nd Ave Ave W | 0.73mi | 2/2.0 (-1) | 1,020 (-9%) | 17mo | $128,500 | $126 | 32 |
| 3020 3rd Avenue Ave E | 0.74mi | 3/1.0 | 1,248 (+11%) | 22mo | $180,000 | $144 | 24 |
| 305 E 32nd St | 0.68mi | 3/1.5 | 968 (-14%) | 23mo | $165,000 | $170 | 24 |
Match score weights: distance 35% · size 25% · config 20% · recency 20%. Top-matched comps best support the ARV.
Projected returns pro-forma
-3.0% appreciation · 3.0% rent growth · sell at horizon
- IRR
- 55.0%
- Equity multiple
- 3.43×
- Total profit
- $35,993
- Equity at exit
- $7,902
- IRR
- 60.1%
- Equity multiple
- 6.99×
- Total profit
- $88,883
- Equity at exit
- $4,582
Cash invested: $14,840 (down + closing). Projections, not guarantees.
Landlord ↔ Tenant lean methodology
- Overall (STATE)
- 46 Balanced
- State Minnesota
- 46 Balanced · D+2
- County
- — inherits STATE
- City
- — inherits STATE
ZIP-level market 55746
- Home prices YoY
- -18.7%
- Active inventory
- 96
- Price-to-rent
- 3.1×
Monthly cashflow live
- Estimated rent
- $1,407 high interval (Pro) →
- Mortgage (P&I)
- −$278
- Tax from tax record
- −$112 /mo · $1,344/yr
- Insurance
- −$22
- HOA
- −$0
- Vacancy / Maint / Mgmt
- −$295
- Net cashflow
- $699
Break-even live
UW: 25.0% down · 7.5% · 30yr · 1.5% tax · 5.0% vac · 8.0% maint · 8.0% mgmt
Financing live
Cash to close
- Down payment
- $13,250
- Closing costs
- $1,590
- Reserves months
- —
- Total cash needed
- —
Loan-product check · same deal, 3 products live
Conventional
25% down · 7.5% · 30yr
- Down + closing
- —
- Monthly P&I
- —
- Monthly cashflow
- —
- DSCR
- —
- Eligible?
- —
Personal DTI + credit; lowest rate.
DSCR
20% down · 8.5% · 30yr
- Down + closing
- —
- Monthly P&I
- —
- Monthly cashflow
- —
- DSCR
- —
- Eligible?
- —
No personal income docs; deal must DSCR.
Hard money
10% down · 12.0% · 12mo
- Down + closing
- —
- Monthly P&I
- —
- Monthly cashflow
- —
- DSCR
- —
- Eligible?
- —
Short-term bridge; refi at stabilization.
Rent comps 5 comps
| Address | Beds | Baths | Sqft | Rent | $/sqft | DOM | Units | Dist |
|---|---|---|---|---|---|---|---|---|
| 600 E 40th St Hibbing, MN | 1.0–2.0 | 1.0 | 729 | $1,135 | $1.56 | 13d | 1 | 0.31mi |
| 1643 E 29th St Hibbing, MN | 2.0 | 1.0 | 1000 | $1,160 | $1.16 | 13d | 1 | 0.88mi |
| 1606 E 29th St Hibbing, MN | 2.0 | 1.0 | 1000 | $1,160 | $1.16 | 13d | 1 | 0.88mi |
| 1605 E 29th St Hibbing, MN | 2.0 | 1.0 | 1000 | $1,160 | $1.16 | 43d | 1 | 0.89mi |
| 1627 E 29th St Hibbing, MN | 3.0 | 1.0 | 1200 | $1,535 | $1.28 | 43d | 1 | 0.91mi |
Listing history 10 events
-
2026-03-11status Pending
-
2026-03-09price $53,000
-
2026-02-25status Active
-
2026-02-06price $58,000
-
2026-01-27price $65,000
-
2026-01-15price $69,000
-
2026-01-10price $74,900
-
2025-12-18$79,900 Active
-
2025-08-13historical
-
2025-07-20$79,000 Active
ⓘ Source: listings_history table (triggers on properties + properties_extension) + one-shot
backfill from property_details.listing_events for pre-trigger history.
Tax reassessment forecast MN · Partial reset (capped growth)
- Current annual tax
- $1,344 · $112/mo
- Projected year-2 tax
- $1,344 · $112/mo
- Expected delta
- $0/yr ($0/mo · 0.0%)
ⓘ Screening estimate from a state-policy table — verify with the county assessor before closing.
Climate risk First Street
- Flood 1/10 Low FEMA zone X · 0% chance over 30 yrs
- Wildfire 3/10 Moderate
- Heat 1/10 Low 7 d/yr ≥91°F today · 12 d/yr by 30 yrs out
- Wind 1/10 Low
- Air quality 2/10 Low 0 unhealthy d/yr today · 1 by 30 yrs out
Nearby sold comps map
Loading sold comps map…
Walkable amenities ~0.75 mi
Loading nearby amenities…
Taxation est. · year 1
- Rental income
- $16,879
- − Mortgage interest
- −$2,969
- − Property taxes
- −$1,344
- − Insurance
- −$265
- − Repairs & maintenance
- −$1,350
- − Management
- −$1,350
- − Depreciation
- −$1,542
- Taxable income
- $8,059
- Est. tax owed @ 24.0%
- −$1,934
- After-tax cash flow
- $6,456/yr
For passive investors: Depreciation is non-cash, so a rental often shows a tax loss while cash-flowing — sheltering income. Rental losses are passive: they offset passive income freely, and up to $25,000/yr can offset ordinary (W-2) income if you actively participate and your MAGI is under $100k (phasing out to $0 by $150k); unused losses carry forward. On sale, claimed depreciation is recaptured at up to 25%, and gains may owe capital-gains tax (a 1031 exchange can defer both). Figures are a year-1 estimate at your 24.0% rate — not tax advice; consult a CPA.
Schools (NCES district)
- District
- Hibbing Public School District
- NCES district ID
- 2713980
- Math proficiency
- 43% ▼ -14.00%
- Reading proficiency
- 54% ▼ -13.00%
- Median HH income
- $41,666
- Composite
- 40.7/100
- National rank
- #3667
- State rank
- #150 of 301 in MN
Livability — Hibbing
- Score
- 79/100
- State rank
- #103
- US rank
- #2307
Category grades
Schools grade is shown separately in the Schools card above.
Census & demographics
- Census place
- Hibbing, MN
- County
- Saint Louis County · 115,152 people
- City population
- 16,730
- Metro
- Duluth, MN-WI
- Population (ZIP)
- 16,730
- Household income
- $55,823
- Rent vs Own
- Severe rent burden
- 623.0
Population outlook (St. Louis County) Hauer SSP2
- Today (2025)
- 202,411 people
- By 2030
- 203,234 · +0.4%
- By 2040
- 202,520 · +0.1%
- By 2050
- 200,853 · -0.8%
- By 2075
- 200,943 · -0.7%
- By 2100
- 192,058 · -5.1%
Race, ethnicity, and origin ACS 2023
- Neighborhood character
- Predominantly White (93%)
- Race & ethnicity
- White 93% Two or more races 4% Black 2% Hispanic / Latino 2%
- Common ancestry
- Portuguese 10% Lithuanian 2% Romanian 2%
- Foreign-born
- 2% · Canada
- Languages at home
- 96% English-only · Spanish 1% German/W. Germanic 1%
Political lean MEDSL · St. Louis
- 2024 margin
- D (+13.7) · D 55.9% · R 42.2% · Other 1.8%
- 2008→2024 swing
- -18.8pp toward R · 2008: 32.5pp · 2024: 13.7pp
- All cycles
- 2024: D+13.7 2020: D+15.6 2016: D+11.8 2012: D+29.6 2008: D+32.5
Not yet ingested
- Civics
- —
Market trends
- HPI YoY
- ▼ -50.85%
- Current HPI
- 220.7198
- Rent YoY
- —
- Metro
- Duluth, MN-WI
- State GDP YoY
- ▲ 2.41%
- F500 in state
- 34
Industry mix (Fortune 500 HQ in MN)
| Industry | F500 HQs | Revenue |
|---|---|---|
| Healthcare | 2 | $407B |
|
||
| Retail | 2 | $150B |
|
||
| Consumer Goods | 2 | $32B |
|
||
| Industrial Machinery | 2 | $6B |
|
||
| Agriculture | 1 | $40B |
|
||
| Healthcare / Medical Devices | 1 | $32B |
|
||
Price history
-32.9% since first listed10 events — show timeline
- 2026-03-11 Pending — NORTHSTARMLS as Distributed by MLS Grid
- 2026-03-09 Price Changed $53,000 NORTHSTARMLS as Distributed by MLS Grid
- 2026-02-25 Relisted — NORTHSTARMLS as Distributed by MLS Grid
- 2026-02-06 Price Changed $58,000 NORTHSTARMLS as Distributed by MLS Grid
- 2026-01-27 Price Changed $65,000 NORTHSTARMLS as Distributed by MLS Grid
- 2026-01-15 Price Changed $69,000 NORTHSTARMLS as Distributed by MLS Grid
- 2026-01-10 Price Changed $74,900 NORTHSTARMLS as Distributed by MLS Grid
- 2025-12-18 Listed $79,900 NORTHSTARMLS as Distributed by MLS Grid
- 2025-08-13 Listing Removed — NORTHSTARMLS as Distributed by MLS Grid
- 2025-07-20 Listed $79,000 NORTHSTARMLS as Distributed by MLS Grid
Property tax history
+13.4%/yrLatest (2025): $1,344 · +9.6% YoY. Source: county tax records.
Cash-flow waterfall
monthlySold comps — $/sqft
last 12 mo · ≤1 miLoading sold comps…