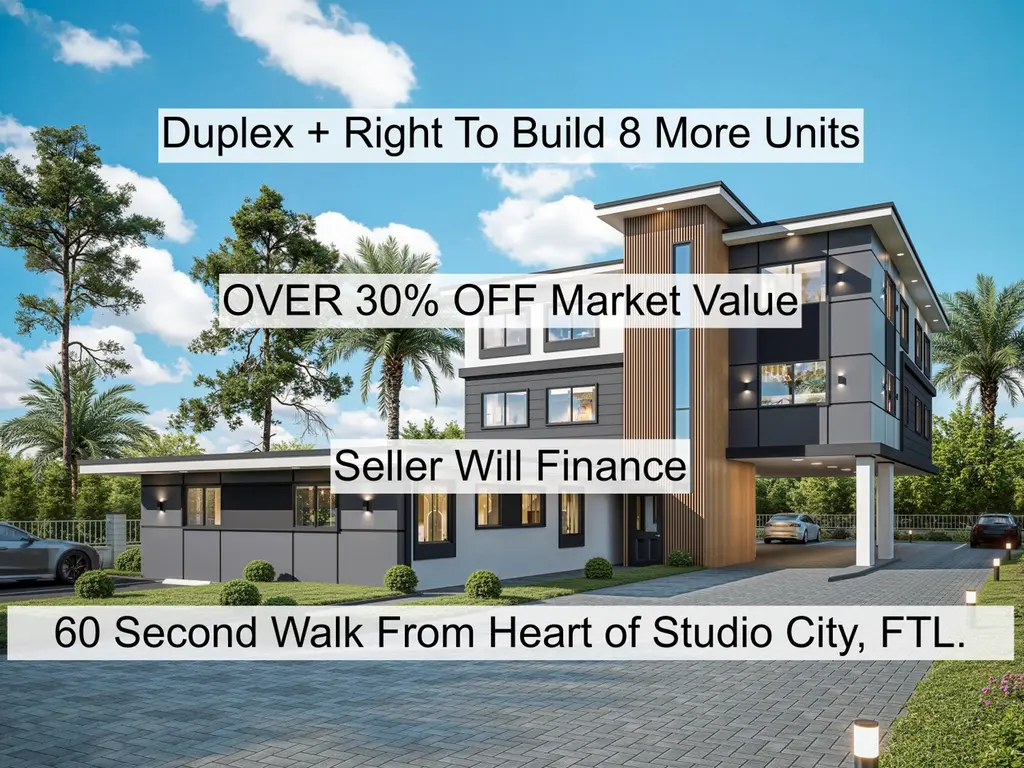
1219 NE 5th Ter Unit 1-2 · Fort Lauderdale, FL
Flood risk 4/10 · Minor
- FEMA flood zone
- X (shaded)
- Chance of flooding over 30 yrs
- 0.2%
- Est. flood insurance / yr
- $507 – $1,088
Fire risk 1/10 · Minimal
- Est. fire insurance / yr
- $947 – $1,759
Heat risk 10/10 · Severe
- Hot days now (above 105°F)
- 7 days/yr
- Hot days in 30 yrs
- 29 days/yr
Wind risk 10/10 · Severe
- Chance of severe wind over 30 yrs
- 99.0%
Air-quality risk 2/10 · Minimal
- Unhealthy air days now
- 1 days/yr
- Unhealthy air days in 30 yrs
- 1 days/yr
Risk factors via First Street. Map © Google.
Why this score? — see what drove the F grade
The composite is a weighted blend of 9 inputs, each scored 0–100. Each bar is that input's sub-score; the figure is the points it added to the 100-point composite (weight × sub-score).
- ARV discount +7.5/15.0
- Schools +4.1/10.0
- Livability +4.1/5.0
- Rent growth +3.2/5.0
- Condition / age +2.5/5.0
- Cash flow +1.8/30.0
- 1% rule +0.0/10.0
- DSCR +0.0/10.0
- Appreciation +0.0/10.0
$747,850
🖨 Deal sheet (PDF) 📄 Offer letter ✓ Due diligence
Listing remarks
Rare opportunity to acquire income-producing duplex (2 1/1s) w/ additional development capacity in Fort Lauderdale's rapidly developing Studio City at over 30% below market value. Keep the existing duplex (w/ separate water & electric meters) & add 8 units for 10 units total. Included site plan shows layout, parking, & access. Meeting with city has been held; feasibility & zoning compliance confirmed. Land comps:$91k-$117k per unit sold, $129k-$162k per unit active. Active & sold multifamily comps:$200k(not renovated)-$320k(renovated) per unit. Subject property: partially renovated duplex + 8 units of buildable land; market value ~$1.2M. 1 bed rents:$1.6k-$2.3k/
Key facts
- Buildable land
- 0.23 acre lot
- Built 1957
Tags
Property features AI
Finance
- Other: Lot dimensions approximately 75 x 135; Paved public maintained road; Not waterfront; Building area reported by appraiser
- Financial info: Two total units; Two units in the community; Tenants pay electricity, sewer, and water; Pets allowed with no restrictions
Exterior
- Utilities: Public water; Public sewer; Cable available; Electricity connected; Phone available; Sewer connected; Water connected; Two separate electric meters; Two separate water meters
- Home design: Duplex; One-story; Resale property; Facing: not specified
- Construction: Stucco and CBS construction; Flat roof
- Exterior features: Open patio; Open porch
Interior
- Flooring: Terrazzo
- Heating & cooling: Window/wall heating; Ceiling fans; Wall/window cooling units
- Interior features: Terrazzo flooring; Storm windows
Neighborhood map
What this means for you Summary
Snapshot
- This is a condo listed at $748k.
Deal economics
- At list price, monthly cash flow is $-3k ($-34k/yr) — negative.
- To cash-flow at today's rent, offer at most $247k (66.9% below list).
- To meet the 1% rule (rent ≥ 1% of price), the offer needs to be $253k (66.1% below list).
- Recommended offer: $247k (66.9% below list) — sets the bar for cash-flow.
Location & tenants
- Location reads 82/100 on livability (#78 in FL, #1,293 nationally) — a professional / high-income tenant draw. Strengths: crime A+, amenities A+, health & safety A+; Watch: cost of living D-.
- Broward (suburban): math 42% / reading 53% proficiency, ranked #46 of 73 in FL (top 63%) — families likely to look elsewhere, expect single-tenant / working-renter base with shorter leases.
- Zoned schools: North Side Elementary School (math 32% / reading 32%, grade F, #1,797 of 2,144 statewide, top 86%, 329 students, 87% FRL); Sunrise Middle School (math 50% / reading 52%, grade C, #237 of 571 statewide, top 43%, 1,242 students, 64% FRL); Fort Lauderdale High School (math 38% / reading 67%, grade C-, #154 of 667 statewide, top 24%, 2,228 students, 57% FRL) — zoned schools average 69% FRL vs 51% district-wide (18 pts higher); higher-poverty schools than district average — tighter screening recommended.
- Market conditions: Rents rising (+2.8%/yr); 630 active listings in the ZIP; 40 comparable units currently listed for rent nearby; rentals at typical pace (median 19d on market — plan ~3-4 weeks tenant-placement turnaround); solid renter incomes; 2,111 units permitted in Broward County in 2024 (1,265 in 5+ unit buildings).
- This rent runs 36% of the median local income ($85k/yr) — at the standard rent-burdened threshold; future hikes will face affordability resistance.
Forward outlook
- Local home prices are declining (-3.0%/yr); year-one equity from $5k of loan paydown is wiped out by about $22k of value loss. Plan a longer hold.
- Broward County population projected at +34% by 2050 — long-run rental-demand tailwind backs the buy-and-hold thesis.
Negotiation context
- It's been on market 24 days — a 2% lower offer ($737k) is reasonable based on typical stale-listing flexibility.
- Current owner paid $430k; list at $748k implies a 74% gain — meaningful room to come down on a strong offer.
Risks & watch-outs
- Watch-outs: built in 1957 — expect roof / HVAC / electrical / plumbing capex.
- Climate carrying-cost: severe wind risk, 99% chance of damaging wind over 30y; extreme-heat days projected 7→29/yr by 2055 (HVAC capex compounding) — expect insurance premiums to compound above CPI over the hold.
Questions for the listing agent
- What do current leases actually rent for vs. the listed asking? Can we see a recent rent roll and the last 12 months of T-12 income?
- Built in 1957 — when were the roof, HVAC, electrical panel, plumbing, and water heater last replaced?
- Any open or pending special assessments — roof, HVAC, plumbing, elevator, façade? What's the per-unit balance and payoff schedule, and is the seller paying it off at close or rolling it to the buyer?
- Is there a deadline driving the sale (1031 exchange, divorce, estate, relocation)? That informs how much negotiation room exists.
- Schools are B-rated — typically a magnet for longer-tenancy family renters. What's the average tenant stay here, and is there a school-zone premium baked into asking?
- The area grade is low — what's the realistic commute time and amenity access for the typical tenant pool here? Any planned neighborhood developments (good or bad) we should know about?
- What's the average days-on-market for RENTAL listings here right now (not sales)? A rising rental-DOM trend means longer vacancies and softer asking-rent achievability than the comps imply.
- What's the recent tenant-quality profile in this submarket — average credit score on applications, eviction rate, late-payment / NSF rate, and stable-employment percentage? A property-management company in the area should have these aggregated.
- How much new apartment / multifamily construction is in the pipeline within 1–3 miles? Heavy new supply (>2% of stock underway) typically softens rents 12–24 months out; light construction supports rent growth.
Investment metrics
- 1% rule
- 0.34% ✗
- Cap rate
- 1.75%
- Cash-on-cash
- -16.24%
- DSCR
- 0.28
- GRM
- 24.6
CMA / ARV
No comps found within radius.
Projected returns pro-forma
-3.0% appreciation · 2.75% rent growth · sell at horizon
- IRR
- -48.3%
- Equity multiple
- -0.44×
- Total profit
- $-302,459
- Equity at exit
- $111,507
- IRR
- -95.4%
- Equity multiple
- -1.38×
- Total profit
- $-499,036
- Equity at exit
- $64,660
Cash invested: $209,398 (down + closing). Projections, not guarantees.
Landlord ↔ Tenant lean methodology
- Overall (STATE)
- 87 Strongly Landlord-Friendly
- State Florida
- 87 Strongly Landlord-Friendly · R+3
- County
- — inherits STATE
- City
- — inherits STATE
ZIP-level market 33304
- Rents YoY
- 2.8%
- Active inventory
- 630
- Price-to-rent
- 24.6×
Monthly cashflow live
- Estimated rent
- $2,532 high interval (Pro) →
- Mortgage (P&I)
- −$3,922
- Tax from tax record
- −$600 /mo · $7,203/yr
- Insurance
- −$312
- HOA
- −$0
- Vacancy / Maint / Mgmt
- −$532
- Net cashflow
- $-2,834
Break-even live
Sensitivity live
| Price | -10% $-2,410 | -5% $-2,622 | +0% $-2,834 | +5% $-3,045 | +10% $-3,257 |
|---|---|---|---|---|---|
| Rent | -10% $-3,034 | -5% $-2,934 | +0% $-2,834 | +5% $-2,734 | +10% $-2,634 |
| Rate | -1.0pp $-2,457 | -0.5pp $-2,643 | base $-2,834 | +0.5pp $-3,027 | +1.0pp $-3,225 |
UW: 25.0% down · 7.5% · 30yr · 1.5% tax · 5.0% vac · 8.0% maint · 8.0% mgmt
Financing live
Cash to close
- Down payment
- $186,962
- Closing costs
- $22,436
- Reserves months
- —
- Total cash needed
- —
Loan-product check · same deal, 3 products live
Conventional
25% down · 7.5% · 30yr
- Down + closing
- —
- Monthly P&I
- —
- Monthly cashflow
- —
- DSCR
- —
- Eligible?
- —
Personal DTI + credit; lowest rate.
DSCR
20% down · 8.5% · 30yr
- Down + closing
- —
- Monthly P&I
- —
- Monthly cashflow
- —
- DSCR
- —
- Eligible?
- —
No personal income docs; deal must DSCR.
Hard money
10% down · 12.0% · 12mo
- Down + closing
- —
- Monthly P&I
- —
- Monthly cashflow
- —
- DSCR
- —
- Eligible?
- —
Short-term bridge; refi at stabilization.
Rent comps 40 comps
| Address | Beds | Baths | Sqft | Rent | $/sqft | DOM | Units | Dist |
|---|---|---|---|---|---|---|---|---|
| 1208 NE 5th Ave Unit 1 Fort Lauderdale, FL | 2.0 | 1.0 | 1000 | $2,700 | $2.70 | 5d | 1 | 0.02mi |
| 1208 NE 5th Ave Unit 3 Fort Lauderdale, FL | 1.0 | 1.0 | 900 | $2,200 | $2.44 | 5d | 1 | 0.02mi |
| 1204 NE 3rd Ave Fort Lauderdale, FL | 3.0 | 2.0 | 1500 | $3,550 | $2.37 | 26d | 1 | 0.14mi |
| 630 NE 14th Ct Unit 205 Fort Lauderdale, FL | 2.0 | 2.0 | 1100 | $2,650 | $2.41 | 4d | 1 | 0.24mi |
| 1316 NE 2nd Ave Fort Lauderdale, FL | 2.0 | 1.0 | 891 | $3,200 | $3.59 | 26d | 1 | 0.25mi |
| 1316 NE 2nd Ave Fort Lauderdale, FL | 2.0 | 1.0 | 998 | $3,200 | $3.21 | 19d | 1 | 0.25mi |
| 1140 NE 1st Ave Unit 1140 Fort Lauderdale, FL | 2.0 | 1.0 | 900 | $2,200 | $2.44 | 26d | 1 | 0.26mi |
| 800 NE 14th St Unit 800 Fort Lauderdale, FL | 2.0 | 1.0 | 900 | $1,750 | $1.94 | 26d | 1 | 0.28mi |
| 748 NE 13th Ct Fort Lauderdale, FL | 1.0 | 1.0 | 750 | $1,725 | $2.30 | 19d | 1 | 0.28mi |
| 1018 NE 2nd Ave Fort Lauderdale, FL | 3.0 | 2.0 | 800 | $3,150 | $3.94 | 7d | 1 | 0.30mi |
| 1018 NE 2nd Ave Fort Lauderdale, FL | 3.0 | 2.0 | 800 | $3,300 | $4.12 | 26d | 1 | 0.30mi |
| 1202 N Andrews Ave Fort Lauderdale, FL | 2.0 | 1.5 | 1400 | $2,500 | $1.79 | 19d | 1 | 0.32mi |
| 1409 NE 2nd Ave Fort Lauderdale, FL | 3.0 | 2.0 | 1269 | $3,700 | $2.92 | 26d | 1 | 0.33mi |
| 1015 NE 9th Ave Fort Lauderdale, FL | 2.0 | 1.0 | 750 | $1,475 | $1.97 | 1d | 1 | 0.34mi |
| 1507 NE 5th Ave #3 Fort Lauderdale, FL | 1.0 | 1.0 | 700 | $1,600 | $2.29 | 26d | 1 | 0.35mi |
| 1035 NE 10th Ave Unit 1 Fort Lauderdale, FL | 2.0 | 1.0 | 900 | $1,995 | $2.22 | 26d | 1 | 0.37mi |
| 1138 NW 1st Ave Fort Lauderdale, FL | 3.0 | 2.0 | 1359 | $3,450 | $2.54 | 1d | 1 | 0.38mi |
| 1138 NW 1st Ave Fort Lauderdale, FL | 3.0 | 2.0 | 1359 | $3,450 | $2.54 | 26d | 1 | 0.38mi |
| 1244 NW 1st Ave Fort Lauderdale, FL | 3.0 | 2.0 | 1316 | $3,100 | $2.36 | 26d | 1 | 0.39mi |
| 1401 Holly Heights Dr Fort Lauderdale, FL | 2.0 | 1.0 | 800 | $1,850 | $2.31 | 26d | 1 | 0.39mi |
| 1337 N Andrews Ave Unit 2 Fort Lauderdale, FL | 2.0 | 2.0 | 1121 | $2,500 | $2.23 | 13d | 1 | 0.39mi |
| 1033 N Andrews Ave Fort Lauderdale, FL | 2.0 | 1.0 | 702 | $1,995 | $2.84 | 26d | 1 | 0.40mi |
| 1407 Holly Heights Dr Fort Lauderdale, FL | 2.0 | 1.0 | 800 | $1,800 | $2.25 | 26d | 1 | 0.40mi |
| 530 NE 15th Ct #7 Fort Lauderdale, FL | 2.0 | 1.0 | 800 | $2,250 | $2.81 | 5d | 1 | 0.41mi |
| 1517 NE 3rd Ave Fort Lauderdale, FL | 3.0 | 2.0 | 1499 | $3,250 | $2.17 | 19d | 1 | 0.42mi |
| 1517 NE 3rd Ave Fort Lauderdale, FL | 3.0 | 2.0 | 1499 | $3,250 | $2.17 | 10d | 1 | 0.42mi |
| 1464 Dixie Hwy Unit 2 Fort Lauderdale, FL | 2.0 | 1.0 | 750 | $2,050 | $2.73 | 26d | 1 | 0.42mi |
| 1423 Holly Heights Dr #4 Fort Lauderdale, FL | 2.0 | 1.0 | 745 | $1,950 | $2.62 | 7d | 1 | 0.42mi |
| 1423 Holly Heights Dr #4 Fort Lauderdale, FL | 2.0 | 1.0 | 745 | $1,950 | $2.62 | 10d | 1 | 0.42mi |
| 1470 N Dixie Hwy Fort Lauderdale, FL | 1.0–2.0 | 1.0 | 658 | $1,900 | $2.89 | 1d | 2 | 0.44mi |
| 1218 NW 2nd Ave Fort Lauderdale, FL | 3.0 | 2.0 | 1209 | $3,199 | $2.65 | 6d | 1 | 0.44mi |
| 1218 NW 2nd Ave Fort Lauderdale, FL | 3.0 | 2.0 | 1209 | $3,199 | $2.65 | 10d | 1 | 0.44mi |
| 1534 NE 3rd Ave Fort Lauderdale, FL | 2.0 | 1.0 | 900 | $1,800 | $2.00 | 26d | 1 | 0.44mi |
| 1455 Holly Heights Dr #40 Fort Lauderdale, FL | 2.0 | 2.0 | 1012 | $2,250 | $2.22 | 17d | 1 | 0.45mi |
| 806 NE 16th St Unit 6 Fort Lauderdale, FL | 2.0 | 1.0 | 900 | $1,525 | $1.69 | 10d | 1 | 0.49mi |
| 309 NE 16th St Unit C-4 Fort Lauderdale, FL | 2.0 | 1.0 | 800 | $2,600 | $3.25 | 26d | 1 | 0.49mi |
| 309 NE 16th St #4 Fort Lauderdale, FL | 2.0 | 1.0 | 800 | $2,200 | $2.75 | 4d | 1 | 0.49mi |
| 1448 Holly Heights Dr Unit 3 Fort Lauderdale, FL | 1.0 | 1.0 | 800 | $1,800 | $2.25 | 26d | 1 | 0.49mi |
| 1448 Holly Heights Dr Unit 3 Fort Lauderdale, FL | 1.0 | 1.0 | 800 | $1,800 | $2.25 | 4d | 1 | 0.49mi |
| 1520 N Andrews Ave Fort Lauderdale, FL | 3.0 | 2.0 | 1110 | $3,100 | $2.79 | 26d | 1 | 0.50mi |
HOA detail condo
- Monthly dues
- $0 · $0/yr
- Likely covers
- waterelectric
- Assessments
- None detected in remarks — confirm with the listing agent.
Listing history 19 events
-
2026-06-21days on market $747,850 Active 24 DOM
-
2026-06-18days on market $747,850 Active 21 DOM
-
2026-06-17pricedays on market $747,850 Active 20 DOM
-
2026-06-16days on market $799,997 Active 19 DOM
-
2026-06-15days on market $799,997 Active 18 DOM
-
2026-06-13days on market $799,997 Active 16 DOM
-
2026-06-09days on market $799,997 Active 12 DOM
-
2026-06-08days on market $799,997 Active 11 DOM
-
2026-06-07days on market $799,997 Active 10 DOM
-
2026-06-04days on market $799,997 Active 7 DOM
-
2026-06-03days on market $799,997 Active 6 DOM
-
2026-06-02days on market $799,997 Active 5 DOM
-
2026-06-01days on market $799,997 Active 4 DOM
-
2026-05-31days on market $799,997 Active 3 DOM
-
2026-05-28$799,997 Active
-
2026-05-14soldstatus $430,000
-
2000-05-24soldstatus $80,000
-
1998-04-01soldstatus $45,000
-
1990-07-31soldstatus $53,300
ⓘ Source: listings_history table (triggers on properties + properties_extension) + one-shot
backfill from property_details.listing_events for pre-trigger history.
Tax reassessment forecast FL · Resets to sale price
- Current annual tax
- $7,203 · $600/mo
- Projected year-2 tax
- $7,203 · $600/mo
- Expected delta
- $0/yr ($0/mo · 0.0%)
ⓘ Screening estimate from a state-policy table — verify with the county assessor before closing.
Climate risk First Street
- Flood 4/10 Moderate FEMA zone X (shaded) · 20% chance over 30 yrs
- Wildfire 1/10 Low
- Heat 10/10 Extreme 7 d/yr ≥105°F today · 29 d/yr by 30 yrs out
- Wind 10/10 Extreme 99% chance of damaging wind over 30 yrs
- Air quality 2/10 Low 1 unhealthy d/yr today · 1 by 30 yrs out
Nearby sold comps map
Loading sold comps map…
Walkable amenities ~0.75 mi
Loading nearby amenities…
Taxation est. · year 1
- Rental income
- $30,381
- − Mortgage interest
- −$41,891
- − Property taxes
- −$7,203
- − Insurance
- −$3,739
- − Repairs & maintenance
- −$2,430
- − Management
- −$2,430
- − Depreciation
- −$21,756
- Taxable loss
- −$49,069
- Est. tax savings @ 24.0%
- +$11,777
- After-tax cash flow
- $-22,226/yr
For passive investors: Depreciation is non-cash, so a rental often shows a tax loss while cash-flowing — sheltering income. Rental losses are passive: they offset passive income freely, and up to $25,000/yr can offset ordinary (W-2) income if you actively participate and your MAGI is under $100k (phasing out to $0 by $150k); unused losses carry forward. On sale, claimed depreciation is recaptured at up to 25%, and gains may owe capital-gains tax (a 1031 exchange can defer both). Figures are a year-1 estimate at your 24.0% rate — not tax advice; consult a CPA.
Schools (NCES district)
- District
- Broward
- NCES district ID
- 1200180
- Math proficiency
- 42% ▼ -18.00%
- Reading proficiency
- 53% ▼ -5.00%
- Median HH income
- $52,139
- Composite
- 40.88/100
- National rank
- #3621
- State rank
- #46 of 73 in FL
Livability — Fort Lauderdale
- Score
- 82/100
- State rank
- #78
- US rank
- #1293
Category grades
Schools grade is shown separately in the Schools card above.
Census & demographics
- Census place
- Fort Lauderdale, FL
- County
- Broward County · 1,963,430 people
- City population
- 235,769
- Metro
- Miami-Fort Lauderdale-Pompano Beach, FL
- Population (ZIP)
- 18,332
- Household income
- $84,920
- Rent vs Own
- Severe rent burden
- 1534.0
Population outlook (Broward County) Hauer SSP2
- Today (2025)
- 2,207,033 people
- By 2030
- 2,360,704 · +7.0%
- By 2040
- 2,661,208 · +20.6%
- By 2050
- 2,946,698 · +33.5%
- By 2075
- 3,602,273 · +63.2%
- By 2100
- 3,970,984 · +79.9%
Race, ethnicity, and origin ACS 2023
- Neighborhood character
- Diverse neighborhood (Simpson 0.63)
- Race & ethnicity
- White 56% Hispanic / Latino 19% Two or more races 17% Black 13% Asian 4%
- Hispanic origin (detail)
- Mexican 2% Puerto Rican 4% Cuban 3%
- Common ancestry
- Hispanic 5% Scotch-Irish 3% Romanian 2%
- Foreign-born
- 32% · Canada, Jamaica, Vietnam
- Languages at home
- 61% English-only · Spanish 20% Other Indo-European 6% French/Haitian/Cajun 5%
Political lean MEDSL · Broward
- 2024 margin
- D (+17.0) · D 58.0% · R 41.0%
- 2008→2024 swing
- -17.8pp toward R · 2008: 34.7pp · 2024: 17.0pp
- All cycles
- 2024: D+17.0 2020: D+29.8 2016: D+35.0 2012: D+34.9 2008: D+34.7
Not yet ingested
- Civics
- —
Market trends
- HPI YoY
- ▼ -522.22%
- Current HPI
- 348.0065
- Rent YoY
- ▲ 2.75%
- Metro
- Miami-Fort Lauderdale-Pompano Beach, FL
- State GDP YoY
- ▲ 3.28%
- F500 in state
- 36
Industry mix (Fortune 500 HQ in FL)
| Industry | F500 HQs | Revenue |
|---|---|---|
| Industrial Technology | 2 | $29B |
|
||
| Insurance | 2 | $17B |
|
||
| Retail | 1 | $60B |
|
||
| Technology Distribution | 1 | $58B |
|
||
| Homebuilding | 1 | $35B |
|
||
| Technology Manufacturing | 1 | $35B |
|
||
Price history
+1400.9% since first listed5 events — show timeline
- 2026-05-28 Listed $799,997 Beaches MLS
- 2026-05-14 Sold (Public Records) $430,000 Public Records
- 2000-05-24 Sold (Public Records) $80,000 Public Records
- 1998-04-01 Sold (Public Records) $45,000 Public Records
- 1990-07-31 Sold (Public Records) $53,300 Public Records
Property tax history
+10.4%/yrLatest (2025): $7,203 · +4.1% YoY. Source: county tax records.
Cash-flow waterfall
monthlySold comps — $/sqft
last 12 mo · ≤1 miLoading sold comps…