201 Eastwood Dr · Sebeka, MN
Flood risk 1/10 · Minimal
- FEMA flood zone
- X
- Chance of flooding over 30 yrs
- 0.0%
- Est. flood insurance / yr
- $507 – $1,088
Fire risk 4/10 · Minor
- Est. fire insurance / yr
- $888 – $1,650
Heat risk 2/10 · Minimal
- Hot days now (above 94°F)
- 7 days/yr
- Hot days in 30 yrs
- 13 days/yr
Wind risk 1/10 · Minimal
- Chance of severe wind over 30 yrs
- —
Air-quality risk 3/10 · Minor
- Unhealthy air days now
- 2 days/yr
- Unhealthy air days in 30 yrs
- 3 days/yr
Risk factors via First Street. Map © Google.
Why this score? — see what drove the B grade
The composite is a weighted blend of 9 inputs, each scored 0–100. Each bar is that input's sub-score; the figure is the points it added to the 100-point composite (weight × sub-score).
- Cash flow +30.0/30.0
- DSCR +10.0/10.0
- 1% rule +9.7/10.0
- ARV discount +7.5/15.0
- Schools +4.3/10.0
- Livability +3.5/5.0
- Rent growth +2.5/5.0
- Condition / age +2.5/5.0
- Appreciation +0.0/10.0
$79,000
🖨 Deal sheet (PDF) 📄 Offer letter ✓ Due diligence
Listing remarks MLS
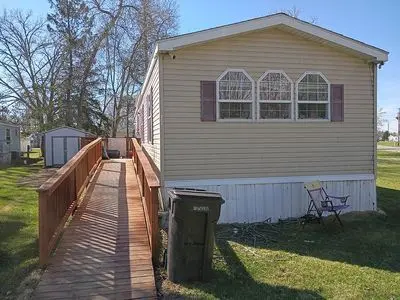
Beautiful, quiet corner lot in Sebeka Mn. Just across the street from the school. Nice single family home. Off street parking for two vehicles and conveniently located right next to the mailboxes. Washer, dryer, central air, and Minnesota energy forced air furnace.
Key facts
- Off street parking
- Central air
- Corner lot
Tags
Neighborhood map
What this means for you Summary
Snapshot
- This is a 3-bed/2.0-bath single-family listed at $79k.
Deal economics
- At list price, monthly cash flow is $374 ($4k/yr) — positive.
- The deal already cash-flows at list — no discount required.
- Meets the 1% rule at list price ($1k rent vs $79k).
- Recommended offer: $77k (3.0% below list) — sets the bar for market timing.
Location & tenants
- Location reads 70/100 on livability (#346 in MN) — a middle-class / working-renter tenant base. Strengths: crime A+, cost of living A+, housing A+; Watch: health & safety C-, employment D, amenities F.
- Sebeka Public School District (rural): math 49% / reading 54% proficiency, ranked #117 of 301 in MN (top 39%) — acceptable for families but not a draw, mixed tenant base, ~2y average lease.
- Zoned schools: Sebeka Elementary (math 57% / reading 57%, grade C+, #265 of 857 statewide, top 35%, 215 students, 61% FRL); Sebeka Secondary (math 37% / reading 52%, grade F, #189 of 471 statewide, top 44%, 258 students, 52% FRL) — zoned schools average 57% FRL vs 38% district-wide (19 pts higher); higher-poverty schools than district average — tighter screening recommended.
- Market conditions: 13 active listings in the ZIP; 52 units permitted in Wadena County in 2024 (0 in 5+ unit buildings).
Forward outlook
- Local home prices are declining (-3.0%/yr); year-one equity from $546 of loan paydown is wiped out by about $2k of value loss. Plan a longer hold.
- Wadena County population projected to shrink 6% by 2050 — rents likely to lag national; underwrite the cash flow, not the appreciation.
- At projected returns (-3.0% appreciation + 3.0% rent growth), your $22k cash investment doubles in ~6 years — after that, you're playing with house money.
Negotiation context
- It's been on market 52 days — a 3% lower offer ($77k) is reasonable based on typical stale-listing flexibility.
- 2 sale attempts with the ask held roughly flat each time — persistent listings suggest the price (not the market) is what's stuck; bring a comps-based counter.
Questions for the listing agent
- It's been on market 52 days. Have you received any prior offers? Is the seller open to a 3% concession, seller financing, or rate buy-down credit?
- Is there a deadline driving the sale (1031 exchange, divorce, estate, relocation)? That informs how much negotiation room exists.
- What's the average days-on-market for RENTAL listings here right now (not sales)? A rising rental-DOM trend means longer vacancies and softer asking-rent achievability than the comps imply.
- What's the recent tenant-quality profile in this submarket — average credit score on applications, eviction rate, late-payment / NSF rate, and stable-employment percentage? A property-management company in the area should have these aggregated.
- How much new for-sale + rental construction is in the pipeline within 1–3 miles? Heavy new supply typically softens prices + rents 12–24 months out; constrained supply supports both.
Investment metrics
- 1% rule
- 1.47% ✓
- Cap rate
- 11.98%
- Cash-on-cash
- 20.31%
- DSCR
- 1.90
- GRM
- 5.7
CMA / ARV
No comps found within radius.
Projected returns pro-forma
-3.0% appreciation · 3.0% rent growth · sell at horizon
- IRR
- 12.6%
- Equity multiple
- 1.50×
- Total profit
- $11,056
- Equity at exit
- $11,779
- IRR
- 21.5%
- Equity multiple
- 2.83×
- Total profit
- $40,397
- Equity at exit
- $6,830
Cash invested: $22,120 (down + closing). Projections, not guarantees.
Landlord ↔ Tenant lean methodology
- Overall (STATE)
- 46 Balanced
- State Minnesota
- 46 Balanced · D+2
- County
- — inherits STATE
- City
- — inherits STATE
ZIP-level market 56477
- Home prices YoY
- -6.1%
- Active inventory
- 13
- Price-to-rent
- 5.7×
Monthly cashflow live
- Estimated rent
- $1,165 medium interval (Pro) →
- Mortgage (P&I)
- −$414
- Tax est. 1.5%
- −$99 /mo · $1,185/yr
- Insurance
- −$33
- HOA
- −$0
- Vacancy / Maint / Mgmt
- −$245
- Net cashflow
- $374
Break-even live
Sensitivity live
| Price | -10% $429 | -5% $402 | +0% $374 | +5% $347 | +10% $320 |
|---|---|---|---|---|---|
| Rent | -10% $282 | -5% $328 | +0% $374 | +5% $420 | +10% $466 |
| Rate | -1.0pp $414 | -0.5pp $394 | base $374 | +0.5pp $354 | +1.0pp $333 |
UW: 25.0% down · 7.5% · 30yr · 1.5% tax · 5.0% vac · 8.0% maint · 8.0% mgmt
Financing live
Cash to close
- Down payment
- $19,750
- Closing costs
- $2,370
- Reserves months
- —
- Total cash needed
- —
Loan-product check · same deal, 3 products live
Conventional
25% down · 7.5% · 30yr
- Down + closing
- —
- Monthly P&I
- —
- Monthly cashflow
- —
- DSCR
- —
- Eligible?
- —
Personal DTI + credit; lowest rate.
DSCR
20% down · 8.5% · 30yr
- Down + closing
- —
- Monthly P&I
- —
- Monthly cashflow
- —
- DSCR
- —
- Eligible?
- —
No personal income docs; deal must DSCR.
Hard money
10% down · 12.0% · 12mo
- Down + closing
- —
- Monthly P&I
- —
- Monthly cashflow
- —
- DSCR
- —
- Eligible?
- —
Short-term bridge; refi at stabilization.
Listing history 19 events
-
2026-06-21days on market $79,000 Active 52 DOM
-
2026-06-21days on market $79,000 Active 51 DOM
-
2026-06-18days on market $79,000 Active 49 DOM
-
2026-06-17days on market $79,000 Active 48 DOM
-
2026-06-16days on market $79,000 Active 47 DOM
-
2026-06-15days on market $79,000 Active 46 DOM
-
2026-06-13days on market $79,000 Active 44 DOM
-
2026-06-12days on market $79,000 Active 43 DOM
-
2026-06-09days on market $79,000 Active 40 DOM
-
2026-06-08days on market $79,000 Active 39 DOM
-
2026-06-07days on market $79,000 Active 38 DOM
-
2026-06-05days on market $79,000 Active 36 DOM
-
2026-06-04days on market $79,000 Active 34 DOM
-
2026-06-02days on market $79,000 Active 33 DOM
-
2026-06-01days on market $79,000 Active 32 DOM
-
2026-05-31days on market $79,000 Active 31 DOM
-
2026-05-31days on market $79,000 Active 30 DOM
-
2026-05-12$79,000 Active 265-char remark
Show marketing remark (265 chars)
Beautiful, quiet corner lot in Sebeka Mn. Just across the street from the school. Nice single family home. Off street parking for two vehicles and conveniently located right next to the mailboxes. Washer, dryer, central air, and Minnesota energy forced air furnace.
-
2026-04-29$79,000 Active 265-char remark
ⓘ Source: listings_history table (triggers on properties + properties_extension) + one-shot
backfill from property_details.listing_events for pre-trigger history.
Climate risk First Street
- Flood 1/10 Low FEMA zone X · 0% chance over 30 yrs
- Wildfire 4/10 Moderate
- Heat 2/10 Low 7 d/yr ≥94°F today · 13 d/yr by 30 yrs out
- Wind 1/10 Low
- Air quality 3/10 Moderate 2 unhealthy d/yr today · 3 by 30 yrs out
Nearby sold comps map
Loading sold comps map…
Walkable amenities ~0.75 mi
Loading nearby amenities…
Taxation est. · year 1
- Rental income
- $13,979
- − Mortgage interest
- −$4,425
- − Property taxes
- −$1,185
- − Insurance
- −$395
- − Repairs & maintenance
- −$1,118
- − Management
- −$1,118
- − Depreciation
- −$2,298
- Taxable income
- $3,439
- Est. tax owed @ 24.0%
- −$825
- After-tax cash flow
- $3,666/yr
For passive investors: Depreciation is non-cash, so a rental often shows a tax loss while cash-flowing — sheltering income. Rental losses are passive: they offset passive income freely, and up to $25,000/yr can offset ordinary (W-2) income if you actively participate and your MAGI is under $100k (phasing out to $0 by $150k); unused losses carry forward. On sale, claimed depreciation is recaptured at up to 25%, and gains may owe capital-gains tax (a 1031 exchange can defer both). Figures are a year-1 estimate at your 24.0% rate — not tax advice; consult a CPA.
Schools (NCES district)
- District
- Sebeka Public School District
- NCES district ID
- 2732970
- Math proficiency
- 49% ▼ -8.00%
- Reading proficiency
- 54% ▼ -7.00%
- Median HH income
- $41,424
- Composite
- 43.19/100
- National rank
- #3064
- State rank
- #117 of 301 in MN
Livability — Sebeka
- Score
- 70/100
- State rank
- #346
- US rank
- #8005
Category grades
Schools grade is shown separately in the Schools card above.
Census & demographics
- Census place
- Sebeka, MN
- Population (ZIP)
- 2,498
Population outlook (Wadena County) Hauer SSP2
- Today (2025)
- 13,856 people
- By 2030
- 13,689 · -1.2%
- By 2040
- 13,382 · -3.4%
- By 2050
- 13,062 · -5.7%
- By 2075
- 12,185 · -12.1%
- By 2100
- 10,297 · -25.7%
Race, ethnicity, and origin ACS 2023
- Neighborhood character
- Predominantly White (92%)
- Race & ethnicity
- White 92% Two or more races 7%
- Common ancestry
- Portuguese 11% Italian 2% Iranian 2%
- Foreign-born
- 1% · Canada
- Languages at home
- 96% English-only · German/W. Germanic 2% Spanish 1%
Political lean MEDSL · Wadena
- 2024 margin
- Solid R (+51.5) · D 23.6% · R 75.1% · Other 1.2%
- 2008→2024 swing
- -34.1pp toward R · 2008: -17.4pp · 2024: -51.5pp
- All cycles
- 2024: R+51.5 2020: R+45.5 2016: R+45.7 2012: R+24.4 2008: R+17.4
Not yet ingested
- Civics
- —
Market trends
- HPI YoY
- ▼ -14.24%
- Current HPI
- 218.835
- Rent YoY
- —
- Metro
- —
- State GDP YoY
- ▲ 2.41%
- F500 in state
- 34
Industry mix (Fortune 500 HQ in MN)
| Industry | F500 HQs | Revenue |
|---|---|---|
| Healthcare | 2 | $407B |
|
||
| Retail | 2 | $150B |
|
||
| Consumer Goods | 2 | $32B |
|
||
| Industrial Machinery | 2 | $6B |
|
||
| Agriculture | 1 | $40B |
|
||
| Healthcare / Medical Devices | 1 | $32B |
|
||
Price history
+0.0% since first listed2 events — show timeline
- 2026-05-12 Listed $79,000 FSBO.com
- 2026-04-29 Listed $79,000 Fizber.com
Cash-flow waterfall
monthlySold comps — $/sqft
last 12 mo · ≤1 miLoading sold comps…