 🏷️ Likely Rental
102 Juliette Cir · Sterling, GA
Flood risk 1/10 · Minimal
- FEMA flood zone
- X (unshaded)
- Chance of flooding over 30 yrs
- 0.0%
- Est. flood insurance / yr
- $507 – $1,088
Fire risk 6/10 · Moderate
- Est. fire insurance / yr
- $963 – $1,789
Heat risk 10/10 · Severe
- Hot days now (above 109°F)
- 7 days/yr
- Hot days in 30 yrs
- 19 days/yr
Wind risk 9/10 · Severe
- Chance of severe wind over 30 yrs
- 99.0%
Air-quality risk 3/10 · Minor
- Unhealthy air days now
- 4 days/yr
- Unhealthy air days in 30 yrs
- 4 days/yr
Risk factors via First Street. Map © Google.
Why this score? — see what drove the B+ grade
The composite is a weighted blend of 9 inputs, each scored 0–100. Each bar is that input's sub-score; the figure is the points it added to the 100-point composite (weight × sub-score).
- Cash flow +30.0/30.0
- ARV discount +15.0/15.0
- DSCR +10.0/10.0
- 1% rule +9.6/10.0
- Schools +3.4/10.0
- Rent growth +2.5/5.0
- Livability +2.5/5.0
- Condition / age +2.5/5.0
- Appreciation +0.0/10.0
$140,000
🖨 Deal sheet 📄 Offer letter ✓ Due diligence
Listing remarks MLS
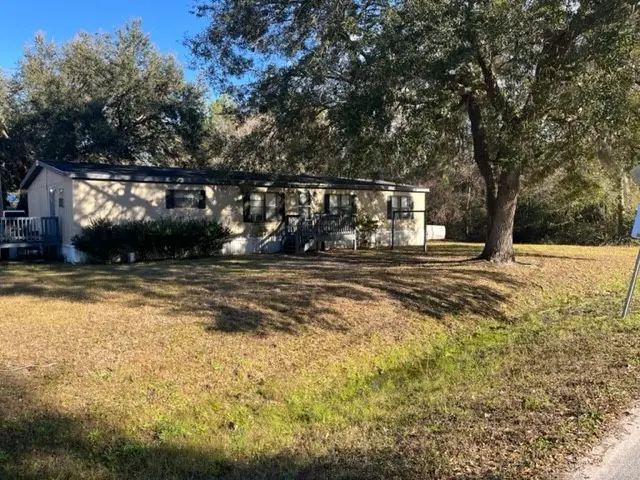
This Well-kept 3/2 mobile home is shaded and nestled beneath a beautiful Oak tree on almost half acre corner lot. Tenant has been there over a year and is currently month to month. very cooperative but works night shifts sometimes.
Key facts
- Oak tree
- Corner lot
- 0.41 acre lot
Tags
Neighborhood map
What this means for you Summary
Snapshot
- This is a 3-bed/2.0-bath manufactured listed at $140k.
Deal economics
- At list price, monthly cash flow is $793 ($10k/yr) — positive.
- The deal already cash-flows at list — no discount required.
- Meets the 1% rule at list price ($2k rent vs $140k).
- Recommended offer: $123k (12.0% below list) — sets the bar for market timing.
- Cap rate 13.1% vs local median 3.8% in Sterling — top-decile yield for the area; either an underpriced asset or a hidden risk that comps aren't pricing in. Stress-test before assuming the spread holds.
Location & tenants
- Location reads: area grade B — affects rentability + tenant quality, not the cash-flow math above.
- Glynn County (other): math 37% / reading 42% proficiency, ranked #47 of 174 in GA (top 27%) — families likely to look elsewhere, expect single-tenant / working-renter base with shorter leases.
- Market conditions: Rents soft (-0.2%/yr); 353 active listings in the ZIP; 13 comparable units currently listed for rent nearby; rentals lingering (median 44d on market — plan ~5-8 weeks vacancy on turnover, expect pricing pressure); 100% of comp listings sitting > 30 days — soft ceiling on asking rent; 734 units permitted in Glynn County in 2024 (136 in 5+ unit buildings).
- This rent runs 35% of the median local income ($69k/yr) — at the standard rent-burdened threshold; future hikes will face affordability resistance.
Forward outlook
- Local home prices are declining (-3.0%/yr); year-one equity from $968 of loan paydown is wiped out by about $4k of value loss. Plan a longer hold.
- Glynn County population projected at +13% by 2050 — modest demand growth; plan on rents tracking national, not racing it.
- At projected returns (-3.0% appreciation + 0.0% rent growth), your $39k cash investment doubles in ~6 years — after that, you're playing with house money.
Negotiation context
- It's been on market 359 days — a 12% lower offer ($123k) is reasonable based on typical stale-listing flexibility.
- 9 sale attempts since 25y ago; this cycle's ask has dropped $35k (20%) from the opening price — seller is motivated, your offer sets the floor, not the list.
- Current owner paid $80k; list at $140k implies a 75% gain — meaningful room to come down on a strong offer.
Risks & watch-outs
- Climate carrying-cost: severe wind risk, 99% chance of damaging wind over 30y; major wildfire risk; extreme-heat days projected 7→19/yr by 2055 (HVAC capex compounding) — expect insurance premiums to compound above CPI over the hold.
Questions for the listing agent
- It's been on market 359 days. Have you received any prior offers? Is the seller open to a 12% concession, seller financing, or rate buy-down credit?
- Why hasn't it sold? Are there any deal-killer items the seller is aware of (foundation, flood, title, zoning, code violations)?
- Is there a deadline driving the sale (1031 exchange, divorce, estate, relocation)? That informs how much negotiation room exists.
- What's the average days-on-market for RENTAL listings here right now (not sales)? A rising rental-DOM trend means longer vacancies and softer asking-rent achievability than the comps imply.
- What's the recent tenant-quality profile in this submarket — average credit score on applications, eviction rate, late-payment / NSF rate, and stable-employment percentage? A property-management company in the area should have these aggregated.
- How much new for-sale + rental construction is in the pipeline within 1–3 miles? Heavy new supply typically softens prices + rents 12–24 months out; constrained supply supports both.
Investment metrics
- 1% rule
- 1.46% ✓
- Cap rate
- 13.09%
- Cash-on-cash
- 24.28%
- DSCR
- 2.08
- GRM
- 5.7
CMA / ARV
- ARV (median comp)
- $201,158
- List price
- $140,000
- Delta
- -30.40%
- Verdict
- UNDERPRICED
- Comps
- 3 within 1.0 mi
Show comp detail 1 sale within ~0.75 mi
| Address | Dist | Beds/Ba | Sqft | Sold | Price | $/sf | Match |
|---|---|---|---|---|---|---|---|
| 102 Touchstone Dr | 0.35mi | 3/2.0 | 1,992 (+12%) | 6mo | $210,000 | $105 | 59 |
Match score weights: distance 35% · size 25% · config 20% · recency 20%. Top-matched comps best support the ARV.
Projected returns pro-forma
-3.0% appreciation · 0.0% rent growth · sell at horizon
- IRR
- 14.4%
- Equity multiple
- 1.56×
- Total profit
- $21,791
- Equity at exit
- $20,874
- IRR
- 21.0%
- Equity multiple
- 2.55×
- Total profit
- $60,659
- Equity at exit
- $12,105
Cash invested: $39,200 (down + closing). Projections, not guarantees.
Landlord ↔ Tenant lean methodology
- Overall (STATE)
- 90 Strongly Landlord-Friendly
- State Georgia
- 90 Strongly Landlord-Friendly · R+3
- County
- — inherits STATE
- City
- — inherits STATE
ZIP-level market 31525
- Rents YoY
- -0.2%
- Active inventory
- 353
- Price-to-rent
- 5.7×
Monthly cashflow live
- Estimated rent
- $2,042 high interval (Pro) →
- Mortgage (P&I)
- −$734
- Tax from tax record
- −$28 /mo · $330/yr
- Insurance
- −$58
- HOA
- −$0
- Vacancy / Maint / Mgmt
- −$429
- Net cashflow
- $793
Break-even live
UW: 25.0% down · 7.5% · 30yr · 1.5% tax · 5.0% vac · 8.0% maint · 8.0% mgmt
Financing live
Cash to close
- Down payment
- $35,000
- Closing costs
- $4,200
- Reserves months
- —
- Total cash needed
- —
Loan-product check · same deal, 3 products live
Conventional
25% down · 7.5% · 30yr
- Down + closing
- —
- Monthly P&I
- —
- Monthly cashflow
- —
- DSCR
- —
- Eligible?
- —
Personal DTI + credit; lowest rate.
DSCR
20% down · 8.5% · 30yr
- Down + closing
- —
- Monthly P&I
- —
- Monthly cashflow
- —
- DSCR
- —
- Eligible?
- —
No personal income docs; deal must DSCR.
Hard money
10% down · 12.0% · 12mo
- Down + closing
- —
- Monthly P&I
- —
- Monthly cashflow
- —
- DSCR
- —
- Eligible?
- —
Short-term bridge; refi at stabilization.
Rent comps 13 comps
| Address | Beds | Baths | Sqft | Rent | $/sqft | DOM | Units | Dist |
|---|---|---|---|---|---|---|---|---|
| 27 Duluth Dr Brunswick, GA | 4.0 | 2.5 | 2127 | $2,190 | $1.03 | 43d | 1 | 0.67mi |
| 17 Red Oak Dr Brunswick, GA | 4.0 | 2.0 | 1830 | $2,145 | $1.17 | 43d | 1 | 0.71mi |
| 19 Carrollton Dr Brunswick, GA | 3.0 | 2.0 | 1733 | $2,045 | $1.18 | 43d | 1 | 0.76mi |
| 30 Carrollton Dr Brunswick, GA | 4.0 | 2.0 | 1830 | $2,145 | $1.17 | 43d | 1 | 0.76mi |
| 15 Carrollton Dr Brunswick, GA | 3.0 | 2.0 | 1733 | $1,995 | $1.15 | 43d | 1 | 0.76mi |
| 12 Carrollton Dr Brunswick, GA | 3.0 | 2.0 | 1733 | $2,045 | $1.18 | 43d | 1 | 0.77mi |
| 138 Amber Mill Cir Brunswick, GA | 3.0 | 2.5 | 1606 | $1,945 | $1.21 | 43d | 1 | 0.90mi |
| 44 Autumns Wood Dr Brunswick, GA | 3.0 | 2.0 | 1615 | $2,450 | $1.52 | 43d | 1 | 1.10mi |
| 100 Odyssey Lk Dr Brunswick, GA | 1.0–3.0 | 1.0–2.0 | 1114 | $1,700 | $1.53 | 43d | 15 | 1.24mi |
| 11 Camper Cir Brunswick, GA | 3.0 | 2.0 | 1631 | $1,995 | $1.22 | 43d | 1 | 1.32mi |
| 132 Cottage Grove Rd Brunswick, GA | 3.0 | 2.0 | 1453 | $1,815 | $1.25 | 43d | 1 | 1.36mi |
| 155 Cottage Grove Rd Brunswick, GA | 3.0 | 2.0 | 1453 | $1,815 | $1.25 | 43d | 1 | 1.42mi |
| 153 Cottage Grove Rd Brunswick, GA | 3.0 | 2.0 | 1453 | $1,815 | $1.25 | 43d | 1 | 1.42mi |
Listing history 36 events
-
2026-06-16days on market $140,000 Active 359 DOM
-
2026-06-15days on market $140,000 Active 358 DOM
-
2026-06-14days on market $140,000 Active 356 DOM
-
2026-06-13days on market $140,000 Active 355 DOM
-
2026-06-10days on market $140,000 Active 353 DOM
-
2026-06-09days on market $140,000 Active 352 DOM
-
2026-06-08days on market $140,000 Active 351 DOM
-
2026-06-07days on market $140,000 Active 350 DOM
-
2026-06-05days on market $140,000 Active 347 DOM
-
2026-06-03days on market $140,000 Active 346 DOM
-
2026-06-02days on market $140,000 Active 345 DOM
-
2026-06-01days on market $140,000 Active 344 DOM
-
2026-05-31days on market $140,000 Active 343 DOM
-
2026-05-30days on market $140,000 Active 342 DOM
-
2026-04-15price $140,000 232-char remark
Show marketing remark (232 chars)
This Well-kept 3/2 mobile home is shaded and nestled beneath a beautiful Oak tree on almost half acre corner lot. Tenant has been there over a year and is currently month to month. very cooperative but works night shifts sometimes.
-
2025-08-01price $169,000 232-char remark
Show marketing remark (232 chars)
This Well-kept 3/2 mobile home is shaded and nestled beneath a beautiful Oak tree on almost half acre corner lot. Tenant has been there over a year and is currently month to month. very cooperative but works night shifts sometimes.
-
2025-06-22$175,000 Active 232-char remark
Show marketing remark (232 chars)
This Well-kept 3/2 mobile home is shaded and nestled beneath a beautiful Oak tree on almost half acre corner lot. Tenant has been there over a year and is currently month to month. very cooperative but works night shifts sometimes.
-
2025-06-10price $175,000
-
2025-01-22historical
-
2024-01-22$179,000 Active
-
2022-02-07soldstatus $80,000
-
2022-02-07soldstatus $80,000
-
2022-01-17$69,500
-
2017-11-03historical
-
2017-07-01$62,000
-
2016-08-07historical
-
2016-05-25$64,900
-
2012-09-11historical
-
2012-05-17$74,900
-
2008-05-15soldstatus $69,000
-
2007-12-31historical
-
2007-12-20historical
-
2007-07-27$79,900
-
2006-08-28$65,000
-
2001-07-09soldstatus $32,000
-
2001-01-03$45,000
ⓘ Source: listings_history table (triggers on properties + properties_extension) + one-shot
backfill from property_details.listing_events for pre-trigger history.
Tax reassessment forecast GA · Resets to sale price
- Current annual tax
- $330 · $28/mo
- Projected year-2 tax
- $1,288 · $107/mo
- Expected delta
- +$958/yr (+$80/mo · 290.0%)
ⓘ Screening estimate from a state-policy table — verify with the county assessor before closing.
Climate risk First Street
- Flood 1/10 Low FEMA zone X (unshaded) · 0% chance over 30 yrs
- Wildfire 6/10 Major
- Heat 10/10 Extreme 7 d/yr ≥109°F today · 19 d/yr by 30 yrs out
- Wind 9/10 Extreme 99% chance of damaging wind over 30 yrs
- Air quality 3/10 Moderate 4 unhealthy d/yr today · 4 by 30 yrs out
Nearby sold comps map
Loading sold comps map…
Walkable amenities ~0.75 mi
Loading nearby amenities…
Taxation est. · year 1
- Rental income
- $24,505
- − Mortgage interest
- −$7,842
- − Property taxes
- −$330
- − Insurance
- −$700
- − Repairs & maintenance
- −$1,960
- − Management
- −$1,960
- − Depreciation
- −$4,073
- Taxable income
- $7,639
- Est. tax owed @ 24.0%
- −$1,833
- After-tax cash flow
- $7,685/yr
For passive investors: Depreciation is non-cash, so a rental often shows a tax loss while cash-flowing — sheltering income. Rental losses are passive: they offset passive income freely, and up to $25,000/yr can offset ordinary (W-2) income if you actively participate and your MAGI is under $100k (phasing out to $0 by $150k); unused losses carry forward. On sale, claimed depreciation is recaptured at up to 25%, and gains may owe capital-gains tax (a 1031 exchange can defer both). Figures are a year-1 estimate at your 24.0% rate — not tax advice; consult a CPA.
Schools (NCES district)
- District
- Glynn County
- NCES district ID
- 1302400
- Math proficiency
- 37% ▼ -9.00%
- Reading proficiency
- 42% ▼ -7.00%
- Median HH income
- $47,554
- Composite
- 33.83/100
- National rank
- #5359
- State rank
- #47 of 174 in GA
Livability — Sterling
No livability data for this city. (Only ~50 U.S. cities are tracked.)
Census & demographics
- County
- Glynn County · 69,019 people
- Metro
- Brunswick, GA
- Population (ZIP)
- 28,926
- Household income
- $69,493
- Rent vs Own
- Severe rent burden
- 924.0
Population outlook (Glynn County) Hauer SSP2
- Today (2025)
- 91,404 people
- By 2030
- 94,806 · +3.7%
- By 2040
- 100,060 · +9.5%
- By 2050
- 103,258 · +13.0%
- By 2075
- 107,970 · +18.1%
- By 2100
- 103,363 · +13.1%
Race, ethnicity, and origin ACS 2023
- Neighborhood character
- Diverse neighborhood (Simpson 0.56)
- Race & ethnicity
- White 61% Black 23% Hispanic / Latino 9% Two or more races 7%
- Hispanic origin (detail)
- Mexican 4%
- Common ancestry
- Italian 3% Slovak 1% Lithuanian 1%
- Foreign-born
- 6% · Canada
- Languages at home
- 92% English-only · Spanish 7%
Political lean MEDSL · Glynn
- 2024 margin
- Strong R (+26.0) · D 36.8% · R 62.8%
- 2008→2024 swing
- -2.6pp toward R · 2008: -23.4pp · 2024: -26.0pp
- All cycles
- 2024: R+26.0 2020: R+23.2 2016: R+28.6 2012: R+27.0 2008: R+23.4
Not yet ingested
- Civics
- —
Market trends
- HPI YoY
- ▼ -133.03%
- Current HPI
- 162.2528
- Rent YoY
- ▼ -0.16%
- Metro
- Brunswick, GA
- State GDP YoY
- ▲ 2.66%
- F500 in state
- 28
Industry mix (Fortune 500 HQ in GA)
| Industry | F500 HQs | Revenue |
|---|---|---|
| Paper / Packaging | 2 | $29B |
|
||
| Retail | 1 | $160B |
|
||
| Transportation / Logistics | 1 | $91B |
|
||
| Airlines | 1 | $62B |
|
||
| Consumer Goods | 1 | $47B |
|
||
| Utilities | 1 | $25B |
|
||
Price history
+211.1% since first listed22 events — show timeline
- 2026-04-15 Price Changed $140,000 GIAR
- 2025-08-01 Price Changed $169,000 GIAR
- 2025-06-22 Listed $175,000 GIAR
- 2025-06-10 Price Changed $175,000 GIAR
- 2025-01-22 Listing Removed — GIAR
- 2024-01-22 Listed $179,000 GIAR
- 2022-02-07 Sold (Public Records) $80,000 Public Records
- 2022-02-07 Sold (MLS) $80,000 GIAR
- 2022-01-17 Listed $69,500 GIAR
- 2017-11-03 Listing Removed — GIAR
- 2017-07-01 Listed $62,000 GIAR
- 2016-08-07 Listing Removed — GIAR
- 2016-05-25 Listed $64,900 GIAR
- 2012-09-11 Listing Removed — GIAR
- 2012-05-17 Listed $74,900 GIAR
- 2008-05-15 Sold (Public Records) $69,000 Public Records
- 2007-12-31 Listing Removed — GIAR
- 2007-12-20 Listing Removed — GIAR
- 2007-07-27 Listed $79,900 GIAR
- 2006-08-28 Listed $65,000 GIAR
- 2001-07-09 Sold (MLS) $32,000 GIAR
- 2001-01-03 Listed $45,000 GIAR
Property tax history
-2.2%/yrLatest (2025): $330 · -19.1% YoY. Source: county tax records.
Cash-flow waterfall
monthlySold comps — $/sqft
last 12 mo · ≤1 miLoading sold comps…