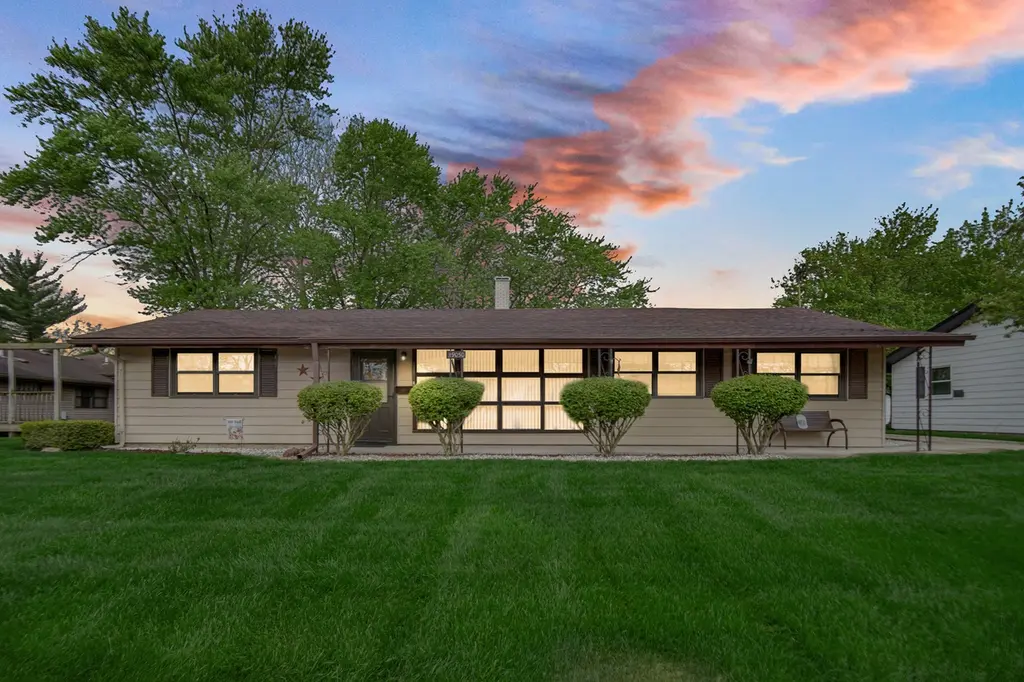
19050 Baker Ave · Country Club Hills, IL
Flood risk 1/10 · Minimal
- FEMA flood zone
- X (unshaded)
- Chance of flooding over 30 yrs
- 0.0%
- Est. flood insurance / yr
- $473 – $860
Fire risk 1/10 · Minimal
- Est. fire insurance / yr
- $804 – $1,492
Heat risk 3/10 · Minor
- Hot days now (above 101°F)
- 7 days/yr
- Hot days in 30 yrs
- 15 days/yr
Wind risk 2/10 · Minimal
- Chance of severe wind over 30 yrs
- —
Air-quality risk 2/10 · Minimal
- Unhealthy air days now
- 1 days/yr
- Unhealthy air days in 30 yrs
- 1 days/yr
Risk factors via First Street. Map © Google.
Why this score? — see what drove the C+ grade
The composite is a weighted blend of 9 inputs, each scored 0–100. Each bar is that input's sub-score; the figure is the points it added to the 100-point composite (weight × sub-score).
- Cash flow +27.2/30.0
- ARV discount +10.4/15.0
- DSCR +9.5/10.0
- 1% rule +6.5/10.0
- Livability +3.8/5.0
- Rent growth +2.5/5.0
- Condition / age +2.5/5.0
- Schools +0.9/10.0
- Appreciation +0.0/10.0
$224,900
🖨 Deal sheet 📄 Offer letter ✓ Due diligence
Listing remarks
* BACK ON THE MARKET DUE TO NO FAULT OF THE SELLER * NEW ROOF 2025(with transferrable warranty), NEW FURNACE 2024, AND NEWER WATER HEATER. This meticulously maintained, 3 bed, 2 bath ranch offers a charming, vintage design and a beautifully manicured lawn. Every inch of the home reflects pride of ownership with custom built-in shelving thoughtfully added throughout-providing both character and practical storage in nearly every space. A standout feature is the detached 3-CAR GARAGE, offering ample room for vehicles, storage, or hobbies. The third bay has been thoughtfully converted into a WORKSHOP, yet the modified door, with built-in entry facade, can be easily removed returning it to an o
Key facts
- Abundant wildlife
- Manicured lawn
- Converted workshop
Tags
Property features AI
Finance
- Other: Fee simple ownership
- HOA & community: No master association fee required
Exterior
- Parking: Detached garage; Concrete driveway; Garage door opener; 3 parking spaces (3 garage spaces)
- Utilities: Public water; Public sewer
- Home design: Detached single-family home; One-story
- Construction: Built 61–70 years ago; Aluminum siding; Asphalt roof; Not rebuilt or rehabbed
- Exterior features: Lot dimensions approximately 75 x 172; Lot less than 0.25 acre; County-recorded lot size
Interior
- Kitchen: Kitchen on main level (18 x 12)
- Bedrooms: 3 bedrooms (all on main level); Master bedroom on main level with a half bath; Bedroom 2 on main level (10 x 12); Bedroom 3 on main level (9 x 8); Bedroom 4 listed
- Bathrooms: 1 full bathroom; 1 half bathroom
- Heating & cooling: Natural gas heating; Central air conditioning
- Interior features: 6 total rooms; School bus service; Interstate access
- Laundry & utility: Main-level laundry; Gas dryer hookup; Laundry room (6 x 7)
Neighborhood map
What this means for you Summary
Snapshot
- This is a 3-bed/1.5-bath single-family listed at $225k.
Deal economics
- At list price, monthly cash flow is $646 ($8k/yr) — positive.
- The deal already cash-flows at list — no discount required.
- Meets the 1% rule at list price ($3k rent vs $225k).
- Recommended offer: $218k (3.0% below list) — sets the bar for market timing.
- Cap rate 9.7% vs local median 7.4% in Country Club Hills — top-decile yield for the area; either an underpriced asset or a hidden risk that comps aren't pricing in. Stress-test before assuming the spread holds.
Location & tenants
- Location reads 75/100 on livability (#212 in IL, #3,963 nationally) — a middle-class / working-renter tenant base. Strengths: commute A+, cost of living A+, housing A+; Watch: crime D+, health & safety D+, schools F.
- Rich Twp Hsd 227 (suburban): math 5% / reading 12% proficiency, ranked #577 of 620 in IL (top 93%) — low school quality limits family demand, transient renter base, plan for 1-2y turnover.
- Market conditions: 94 active listings in the ZIP; 8 comparable units currently listed for rent nearby; rentals leasing fast (median 1d on market — plan ~1-2 weeks tenant-placement turnaround); 6,272 units permitted in Cook County in 2024 (4,658 in 5+ unit buildings).
Forward outlook
- Local home prices are declining (-3.0%/yr); year-one equity from $2k of loan paydown is wiped out by about $7k of value loss. Plan a longer hold.
- At projected returns (-3.0% appreciation + 3.0% rent growth), your $63k cash investment doubles in ~10 years — after that, you're playing with house money.
Negotiation context
- It's been on market 42 days — a 3% lower offer ($218k) is reasonable based on typical stale-listing flexibility.
- 2 sale attempts with the ask held roughly flat each time — persistent listings suggest the price (not the market) is what's stuck; bring a comps-based counter.
Questions for the listing agent
- It's been on market 42 days. Have you received any prior offers? Is the seller open to a 3% concession, seller financing, or rate buy-down credit?
- Built in 1961 — when were the roof, HVAC, electrical panel, plumbing, and water heater last replaced?
- Is there a deadline driving the sale (1031 exchange, divorce, estate, relocation)? That informs how much negotiation room exists.
- Schools are F-rated, which usually means shorter tenancies and higher turnover. Who's the typical renter profile here, and what's been the actual vacancy rate?
- Crime grade is D in this area — have there been break-ins, vandalism, or insurance claims at this property in the last 3 years? What carrier currently insures it and at what premium?
- What's the average days-on-market for RENTAL listings here right now (not sales)? A rising rental-DOM trend means longer vacancies and softer asking-rent achievability than the comps imply.
- What's the recent tenant-quality profile in this submarket — average credit score on applications, eviction rate, late-payment / NSF rate, and stable-employment percentage? A property-management company in the area should have these aggregated.
- How much new for-sale + rental construction is in the pipeline within 1–3 miles? Heavy new supply typically softens prices + rents 12–24 months out; constrained supply supports both.
Investment metrics
- 1% rule
- 1.15% ✓
- Cap rate
- 9.74%
- Cash-on-cash
- 12.31%
- DSCR
- 1.55
- GRM
- 7.3
CMA / ARV
- ARV (on-the-fly)
- $240,284
- Comps found
- 12
Show comp detail 12 sales within ~0.75 mi
| Address | Dist | Beds/Ba | Sqft | Sold | Price | $/sf | Match |
|---|---|---|---|---|---|---|---|
| 19050 Baker Ave | 0.00mi | 3/1.5 | 1,397 (0%) | 0mo | $225,000 | $161 | 100 |
| 18921 John Ave | 0.17mi | 3/1.0 | 1,414 (+1%) | 0mo | $107,500 | $76 | 88 |
| 19011 John Ave | 0.12mi | 3/1.0 | 1,375 (-2%) | 12mo | $168,000 | $122 | 80 |
| 18741 Cicero Ave | 0.51mi | 3/1.0 | 1,400 (+0%) | 4mo | $90,000 | $64 | 70 |
| 19020 Cypress Ave | 0.43mi | 3/3.0 | 1,326 (-5%) | 7mo | $283,000 | $213 | 60 |
| 4601 188th St | 0.31mi | 3/1.5 | 1,199 (-14%) | 5mo | $80,000 | $67 | 57 |
| 4215 188th St | 0.44mi | 3/2.0 | 1,529 (+9%) | 5mo | $267,000 | $175 | 57 |
| 4211 190th Pl | 0.28mi | 3/2.0 | 1,560 (+12%) | 10mo | $267,732 | $172 | 57 |
| 4160 188th St | 0.50mi | 3/3.0 | 1,326 (-5%) | 7mo | $239,000 | $180 | 56 |
| 4640 185th Pl | 0.71mi | 3/2.0 | 1,350 (-3%) | 6mo | $239,900 | $178 | 54 |
| 18731 John Ave | 0.38mi | 4/2.0 (+1) | 1,575 (+13%) | 11mo | $239,900 | $152 | 45 |
| 18521 Cicero Ave | 0.75mi | 3/2.0 | 1,500 (+7%) | 9mo | $260,000 | $173 | 44 |
Match score weights: distance 35% · size 25% · config 20% · recency 20%. Top-matched comps best support the ARV.
Projected returns pro-forma
-3.0% appreciation · 3.0% rent growth · sell at horizon
- IRR
- 1.9%
- Equity multiple
- 1.07×
- Total profit
- $4,632
- Equity at exit
- $33,533
- IRR
- 11.5%
- Equity multiple
- 1.90×
- Total profit
- $56,756
- Equity at exit
- $19,445
Cash invested: $62,972 (down + closing). Projections, not guarantees.
Landlord ↔ Tenant lean methodology
- Overall (STATE)
- 43 Moderately Tenant-Leaning
- State Illinois
- 43 Moderately Tenant-Leaning · D+7
- County
- — inherits STATE
- City
- — inherits STATE
ZIP-level market 60478
- Home prices YoY
- -27.3%
- Active inventory
- 94
- Price-to-rent
- 7.3×
Monthly cashflow live
- Estimated rent
- $2,579 high interval (Pro) →
- Mortgage (P&I)
- −$1,179
- Tax from tax record
- −$119 /mo · $1,426/yr
- Insurance
- −$94
- HOA
- −$0
- Vacancy / Maint / Mgmt
- −$542
- Net cashflow
- $646
Break-even live
UW: 25.0% down · 7.5% · 30yr · 1.5% tax · 5.0% vac · 8.0% maint · 8.0% mgmt
Financing live
Cash to close
- Down payment
- $56,225
- Closing costs
- $6,747
- Reserves months
- —
- Total cash needed
- —
Loan-product check · same deal, 3 products live
Conventional
25% down · 7.5% · 30yr
- Down + closing
- —
- Monthly P&I
- —
- Monthly cashflow
- —
- DSCR
- —
- Eligible?
- —
Personal DTI + credit; lowest rate.
DSCR
20% down · 8.5% · 30yr
- Down + closing
- —
- Monthly P&I
- —
- Monthly cashflow
- —
- DSCR
- —
- Eligible?
- —
No personal income docs; deal must DSCR.
Hard money
10% down · 12.0% · 12mo
- Down + closing
- —
- Monthly P&I
- —
- Monthly cashflow
- —
- DSCR
- —
- Eligible?
- —
Short-term bridge; refi at stabilization.
Rent comps 8 comps
| Address | Beds | Baths | Sqft | Rent | $/sqft | DOM | Units | Dist |
|---|---|---|---|---|---|---|---|---|
| 18960 Keeler Ave Country Club Hills, IL | 4.0 | 2.0 | 1537 | $2,650 | $1.72 | 1d | 1 | 0.31mi |
| 4193 186th St Country Club Hills, IL | 4.0 | 2.5 | 1704 | $3,200 | $1.88 | 1d | 1 | 0.69mi |
| 2256 Windsor Ln Country Club Hills, IL | 3.0 | 1.0 | 1212 | $2,250 | $1.86 | 1d | 1 | 0.81mi |
| 4453 Provincetown Dr Country Club Hills, IL | 3.0 | 2.5 | 1300 | $2,500 | $1.92 | 1d | 1 | 0.81mi |
| 1153 Williamsburg Rd Country Club Hills, IL | 2.0 | 1.5 | 1216 | $1,900 | $1.56 | 1d | 1 | 0.87mi |
| 18019 Ravisloe Ter Country Club Hills, IL | 3.0 | 1.5 | 1150 | $2,800 | $2.43 | 1d | 1 | 1.34mi |
| 4962 Bennett St Matteson, IL | 2.0–3.0 | 2.5 | 1341 | $3,120 | $2.33 | 1d | 7 | 1.36mi |
| 17984 Amherst Ct Country Club Hills, IL | 2.0 | 1.0 | 1000 | $1,900 | $1.90 | 1d | 1 | 1.46mi |
Listing history 14 events
-
2026-06-10status $224,900 Pending 42 DOM
-
2026-06-09days on market $224,900 Contingent - No Showings 42 DOM
-
2026-06-08days on market $224,900 Contingent - No Showings 41 DOM
-
2026-06-07days on market $224,900 Contingent - No Showings 40 DOM
-
2026-06-04days on market $224,900 Contingent - No Showings 37 DOM
-
2026-06-03days on market $224,900 Contingent - No Showings 36 DOM
-
2026-06-02days on market $224,900 Contingent - No Showings 35 DOM
-
2026-06-01days on market $224,900 Contingent - No Showings 34 DOM
-
2026-05-31days on market $224,900 Contingent - No Showings 33 DOM
-
2026-05-14historical Contingent - No Showings
-
2026-05-08status Active
-
2026-05-08price $224,900
-
2026-05-05historical Contingent - Continue to Show
-
2026-04-28$230,000 Active
ⓘ Source: listings_history table (triggers on properties + properties_extension) + one-shot
backfill from property_details.listing_events for pre-trigger history.
Tax reassessment forecast IL · Partial reset (capped growth)
- Current annual tax
- $1,426 · $119/mo
- Projected year-2 tax
- $3,265 · $272/mo
- Expected delta
- +$1,840/yr (+$153/mo · 129.1%)
ⓘ Screening estimate from a state-policy table — verify with the county assessor before closing.
Climate risk First Street
- Flood 1/10 Low FEMA zone X (unshaded) · 0% chance over 30 yrs
- Wildfire 1/10 Low
- Heat 3/10 Moderate 7 d/yr ≥101°F today · 15 d/yr by 30 yrs out
- Wind 2/10 Low
- Air quality 2/10 Low 1 unhealthy d/yr today · 1 by 30 yrs out
Nearby sold comps map
Loading sold comps map…
Walkable amenities ~0.75 mi
Loading nearby amenities…
Taxation est. · year 1
- Rental income
- $30,954
- − Mortgage interest
- −$12,598
- − Property taxes
- −$1,426
- − Insurance
- −$1,124
- − Repairs & maintenance
- −$2,476
- − Management
- −$2,476
- − Depreciation
- −$6,543
- Taxable income
- $4,311
- Est. tax owed @ 24.0%
- −$1,035
- After-tax cash flow
- $6,716/yr
For passive investors: Depreciation is non-cash, so a rental often shows a tax loss while cash-flowing — sheltering income. Rental losses are passive: they offset passive income freely, and up to $25,000/yr can offset ordinary (W-2) income if you actively participate and your MAGI is under $100k (phasing out to $0 by $150k); unused losses carry forward. On sale, claimed depreciation is recaptured at up to 25%, and gains may owe capital-gains tax (a 1031 exchange can defer both). Figures are a year-1 estimate at your 24.0% rate — not tax advice; consult a CPA.
Schools (NCES district)
- District
- Rich Twp Hsd 227
- NCES district ID
- 1733420
- Math proficiency
- 5% ▼ -3.00%
- Reading proficiency
- 12% ▬ 0.00%
- Median HH income
- $56,056
- Composite
- 8.93/100
- National rank
- #9885
- State rank
- #577 of 620 in IL
Livability — Country Club Hills
- Score
- 75/100
- State rank
- #212
- US rank
- #3963
Category grades
Schools grade is shown separately in the Schools card above.
Census & demographics
- Census place
- Country Club Hills, IL
- City population
- 16,549
- Population (ZIP)
- 16,549
Population outlook (Cook County) Hauer SSP2
- Today (2025)
- 5,347,519 people
- By 2030
- 5,357,703 · +0.2%
- By 2040
- 5,324,924 · -0.4%
- By 2050
- 5,230,762 · -2.2%
- By 2075
- 4,785,735 · -10.5%
- By 2100
- 4,188,836 · -21.7%
Race, ethnicity, and origin ACS 2023
- Neighborhood character
- Predominantly Black (87%)
- Race & ethnicity
- Black 87% White 8% Hispanic / Latino 4% Two or more races 3%
- Common ancestry
- Romanian 1%
- Foreign-born
- 4% · Canada
- Languages at home
- 96% English-only · Spanish 2%
Political lean MEDSL · Cook
- 2024 margin
- Solid D (+42.0) · D 70.4% · R 28.4% · Other 1.2%
- 2008→2024 swing
- -11.4pp toward R · 2008: 53.4pp · 2024: 42.0pp
- All cycles
- 2024: D+42.0 2020: D+50.3 2016: D+53.0 2012: D+49.4 2008: D+53.4
Not yet ingested
- Civics
- —
Market trends
- HPI YoY
- ▼ -79.73%
- Current HPI
- 212.3917
- Rent YoY
- —
- Metro
- —
- State GDP YoY
- ▲ 1.59%
- F500 in state
- 60
Industry mix (Fortune 500 HQ in IL)
| Industry | F500 HQs | Revenue |
|---|---|---|
| Insurance | 4 | $201B |
|
||
| Consumer Goods | 4 | $87B |
|
||
| Industrial Machinery | 3 | $64B |
|
||
| Healthcare | 2 | $55B |
|
||
| Retail / Pharmacy | 1 | $148B |
|
||
| Agriculture / Food | 1 | $86B |
|
||
Price history
-2.2% since first listed5 events — show timeline
- 2026-05-14 Contingent — MRED as Distributed by MLS Grid
- 2026-05-08 Relisted — MRED as Distributed by MLS Grid
- 2026-05-08 Price Changed $224,900 MRED as Distributed by MLS Grid
- 2026-05-05 Contingent — MRED as Distributed by MLS Grid
- 2026-04-28 Listed $230,000 MRED as Distributed by MLS Grid
Property tax history
-4.5%/yrLatest (2023): $1,426 · -8.4% YoY. Source: county tax records.
Cash-flow waterfall
monthlySold comps — $/sqft
last 12 mo · ≤1 miLoading sold comps…