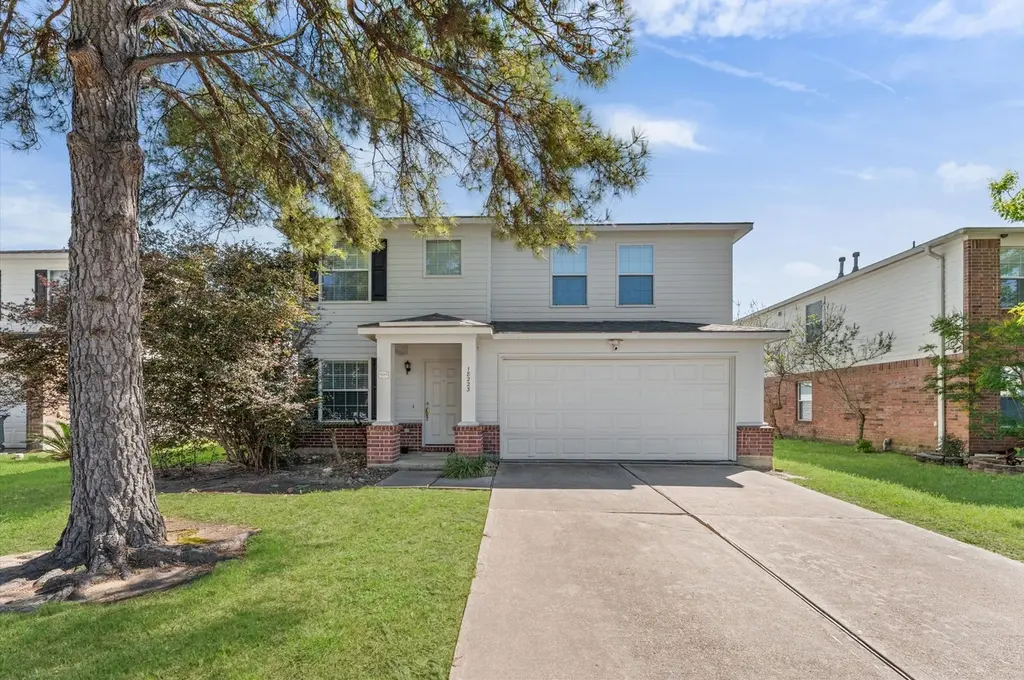
18223 Sable Tree Dr · Houston, TX
Flood risk 1/10 · Minimal
- FEMA flood zone
- X (unshaded)
- Chance of flooding over 30 yrs
- 0.0%
- Est. flood insurance / yr
- $507 – $1,088
Fire risk 3/10 · Minor
- Est. fire insurance / yr
- $1,222 – $2,270
Heat risk 9/10 · Severe
- Hot days now (above 110°F)
- 7 days/yr
- Hot days in 30 yrs
- 23 days/yr
Wind risk 9/10 · Severe
- Chance of severe wind over 30 yrs
- 99.0%
Air-quality risk 2/10 · Minimal
- Unhealthy air days now
- 2 days/yr
- Unhealthy air days in 30 yrs
- 2 days/yr
Risk factors via First Street. Map © Google.
Why this score? — see what drove the D grade
The composite is a weighted blend of 9 inputs, each scored 0–100. Each bar is that input's sub-score; the figure is the points it added to the 100-point composite (weight × sub-score).
- ARV discount +10.6/15.0
- Cash flow +7.3/30.0
- Schools +5.7/10.0
- Appreciation +4.3/10.0
- Livability +3.7/5.0
- 1% rule +2.9/10.0
- Condition / age +2.5/5.0
- Rent growth +1.8/5.0
- DSCR +1.5/10.0
$298,000
🖨 Deal sheet 📄 Offer letter ✓ Due diligence
Listing remarks MLS
Spacious two story home with four bedrooms, formal living/dining combo, family room, game room and large kitchen/breakfast area. Did NOT flood during Harvey.
Key facts
- Open floor plan
- No carpet
- Spacious kitchen
Tags
Property features AI
Finance
- HOA & community: Barkers Branch HOA with an annual fee of $475; Community pool
Exterior
- Parking: Detached garage; 2-car garage
- Utilities: Public water; Public sewer
- Home design: Residential property; Built in 2005; Slab foundation; Composition roof
- Construction: Brick and cement siding construction
- Exterior features: Subdivision lot; Concrete road surface
Interior
- Kitchen: Dishwasher; Free-standing range; Oven; Garbage disposal
- Bedrooms: Primary bedroom on the first floor (18x14); Three additional bedrooms on the second floor (10x13; 11x12; 12x14)
- Flooring: Plank flooring; Tile flooring; Vinyl flooring
- Bathrooms: 2 full bathrooms; 1 half bathroom
- Heating & cooling: Central heating (gas); Central electric air conditioning
- Interior features: Family room; Game room; Living room; Seller disclosure
Neighborhood map
What this means for you Summary
Snapshot
- This is a 4-bed/2.5-bath single-family listed at $298k.
Deal economics
- At list price, monthly cash flow is $-396 ($-5k/yr) — negative.
- To cash-flow at today's rent, offer at most $228k (23.4% below list).
- To meet the 1% rule (rent ≥ 1% of price), the offer needs to be $235k (21.0% below list).
- Recommended offer: $228k (23.4% below list) — sets the bar for cash-flow.
- Cap rate 4.7% vs local median 3.2% in Houston — top-decile yield for the area; either an underpriced asset or a hidden risk that comps aren't pricing in. Stress-test before assuming the spread holds.
Location & tenants
- Location reads 74/100 on livability (#184 in TX, #4,771 nationally) — a middle-class / working-renter tenant base. Strengths: amenities A+, cost of living A+, housing A+; Watch: crime F.
- Katy ISD (suburban): math 61% / reading 63% proficiency, ranked #29 of 826 in TX (top 4%) — acceptable for families but not a draw, mixed tenant base, ~2y average lease.
- Zoned schools: Mayde Creek J H (math 41% / reading 48%, grade D, #491 of 1,662 statewide, top 31%, 1,273 students, 77% FRL); Mayde Creek H S (math 42% / reading 54%, grade D, #571 of 1,632 statewide, top 36%, 2,940 students, 78% FRL) — zoned schools average 78% FRL vs 27% district-wide (50 pts higher); higher-poverty schools than district average — tighter screening recommended.
- Zoned-school proficiency averages 46% at this address vs 62% district-wide (-16 pts) — the specific schools serving this property underperform the Katy ISD average; the district grade overstates school quality for this exact location.
- Market conditions: Rents soft (-2.9%/yr); 494 active listings in the ZIP; 6 comparable units currently listed for rent nearby; rentals lingering (median 44d on market — plan ~5-8 weeks vacancy on turnover, expect pricing pressure); 67% of comp listings sitting > 30 days — soft ceiling on asking rent; solid renter incomes; 29,883 units permitted in Harris County in 2024 (8,621 in 5+ unit buildings).
- This rent runs 35% of the median local income ($81k/yr) — at the standard rent-burdened threshold; future hikes will face affordability resistance.
Forward outlook
- Local home prices are declining (-1.4%/yr); year-one equity from $2k of loan paydown is wiped out by about $4k of value loss. Plan a longer hold.
- Harris County population projected at +47% by 2050 — long-run rental-demand tailwind backs the buy-and-hold thesis.
Negotiation context
- It's been on market 32 days — a 3% lower offer ($289k) is reasonable based on typical stale-listing flexibility.
- 8 sale attempts since 11y ago with the ask held roughly flat each time — persistent listings suggest the price (not the market) is what's stuck; bring a comps-based counter.
Risks & watch-outs
- Climate carrying-cost: severe wind risk, 99% chance of damaging wind over 30y; extreme-heat days projected 7→23/yr by 2055 (HVAC capex compounding) — expect insurance premiums to compound above CPI over the hold.
Questions for the listing agent
- What do current leases actually rent for vs. the listed asking? Can we see a recent rent roll and the last 12 months of T-12 income?
- It's been on market 32 days. Have you received any prior offers? Is the seller open to a 23% concession, seller financing, or rate buy-down credit?
- What does the HOA fee cover, when was the last increase, and are there any pending special assessments or reserve-fund shortfalls?
- Is there a deadline driving the sale (1031 exchange, divorce, estate, relocation)? That informs how much negotiation room exists.
- Schools are D-rated, which usually means shorter tenancies and higher turnover. Who's the typical renter profile here, and what's been the actual vacancy rate?
- Crime grade is F in this area — have there been break-ins, vandalism, or insurance claims at this property in the last 3 years? What carrier currently insures it and at what premium?
- The area grade is low — what's the realistic commute time and amenity access for the typical tenant pool here? Any planned neighborhood developments (good or bad) we should know about?
- What's the average days-on-market for RENTAL listings here right now (not sales)? A rising rental-DOM trend means longer vacancies and softer asking-rent achievability than the comps imply.
- What's the recent tenant-quality profile in this submarket — average credit score on applications, eviction rate, late-payment / NSF rate, and stable-employment percentage? A property-management company in the area should have these aggregated.
- How much new for-sale + rental construction is in the pipeline within 1–3 miles? Heavy new supply typically softens prices + rents 12–24 months out; constrained supply supports both.
Investment metrics
- 1% rule
- 0.79% ✗
- Cap rate
- 4.70%
- Cash-on-cash
- -5.69%
- DSCR
- 0.75
- GRM
- 10.5
CMA / ARV
- ARV (median comp)
- $319,770
- List price
- $298,000
- Delta
- -6.81%
- Verdict
- FAIR
- Comps
- 20 within 1.0 mi
Show comp detail 12 sales within ~0.75 mi
| Address | Dist | Beds/Ba | Sqft | Sold | Price | $/sf | Match |
|---|---|---|---|---|---|---|---|
| 18326 Thicket Grove Rd | 0.21mi | 4/2.5 | 2,628 (-6%) | 3mo | $289,000 | $110 | 78 |
| 3723 Rowlock Vine Dr | 0.16mi | 4/3.5 | 3,043 (+9%) | 2mo | $320,000 | $105 | 73 |
| 18323 Hickory Trunnel Ln | 0.45mi | 4/2.5 | 2,935 (+5%) | 0mo | $340,000 | $116 | 71 |
| 3826 Rowlock Vine Dr | 0.25mi | 4/3.5 | 3,011 (+8%) | 1mo | $289,900 | $96 | 71 |
| 3662 Barkers Crossing Ave | 0.22mi | 5/3.0 (+1) | 2,585 (-8%) | 0mo | $322,500 | $125 | 69 |
| 3603 Barkers Crossing Ave | 0.12mi | 5/3.0 (+1) | 2,480 (-12%) | 0mo | $299,000 | $121 | 68 |
| 3234 Clipper Winds Way | 0.34mi | 5/2.5 (+1) | 2,649 (-6%) | 3mo | $295,000 | $111 | 68 |
| 3706 Siebinthaler Ln | 0.17mi | 5/3.5 (+1) | 3,043 (+9%) | 3mo | $325,000 | $107 | 66 |
| 3427 Cobblestone Creek Way | 0.61mi | 4/3.5 | 2,884 (+3%) | 4mo | $399,000 | $138 | 60 |
| 18538 Iron Lake Dr | 0.65mi | 4/3.5 | 2,884 (+3%) | 3mo | $399,000 | $138 | 58 |
| 18526 Fawn Run Ln | 0.67mi | 4/2.5 | 2,587 (-8%) | 2mo | $339,000 | $131 | 54 |
| 2802 Mossy Log Ct | 0.71mi | 4/3.5 | 3,158 (+13%) | 3mo | $389,000 | $123 | 40 |
Match score weights: distance 35% · size 25% · config 20% · recency 20%. Top-matched comps best support the ARV.
Projected returns pro-forma
-1.4% appreciation · 0.0% rent growth · sell at horizon
- IRR
- -17.9%
- Equity multiple
- 0.28×
- Total profit
- $-59,662
- Equity at exit
- $66,305
- IRR
- -14.8%
- Equity multiple
- -0.10×
- Total profit
- $-91,500
- Equity at exit
- $64,936
Cash invested: $83,440 (down + closing). Projections, not guarantees.
Landlord ↔ Tenant lean methodology
- Overall (STATE)
- 87 Strongly Landlord-Friendly
- State Texas
- 87 Strongly Landlord-Friendly · R+5
- County
- — inherits STATE
- City
- — inherits STATE
ZIP-level market 77084
- Home prices YoY
- -0.6%
- Rents YoY
- -2.9%
- Active inventory
- 494
- Price-to-rent
- 10.5×
Monthly cashflow live
- Estimated rent
- $2,354 high interval (Pro) →
- Mortgage (P&I)
- −$1,563
- Tax from tax record
- −$528 /mo · $6,339/yr
- Insurance
- −$124
- HOA
- −$40
- Vacancy / Maint / Mgmt
- −$494
- Net cashflow
- $-396
Break-even live
UW: 25.0% down · 7.5% · 30yr · 1.5% tax · 5.0% vac · 8.0% maint · 8.0% mgmt
Financing live
Cash to close
- Down payment
- $74,500
- Closing costs
- $8,940
- Reserves months
- —
- Total cash needed
- —
Loan-product check · same deal, 3 products live
Conventional
25% down · 7.5% · 30yr
- Down + closing
- —
- Monthly P&I
- —
- Monthly cashflow
- —
- DSCR
- —
- Eligible?
- —
Personal DTI + credit; lowest rate.
DSCR
20% down · 8.5% · 30yr
- Down + closing
- —
- Monthly P&I
- —
- Monthly cashflow
- —
- DSCR
- —
- Eligible?
- —
No personal income docs; deal must DSCR.
Hard money
10% down · 12.0% · 12mo
- Down + closing
- —
- Monthly P&I
- —
- Monthly cashflow
- —
- DSCR
- —
- Eligible?
- —
Short-term bridge; refi at stabilization.
Rent comps 6 comps
| Address | Beds | Baths | Sqft | Rent | $/sqft | DOM | Units | Dist |
|---|---|---|---|---|---|---|---|---|
| 3131 Zephyr Glen Way Houston, TX | 4.0 | 3.0 | 2619 | $2,300 | $0.88 | 43d | 1 | 0.44mi |
| 3027 Zephyr Glen Way Houston, TX | 4.0 | 2.5 | 2298 | $2,200 | $0.96 | 43d | 1 | 0.51mi |
| 3331 Dale Ridge Trl Houston, TX | 4.0 | 2.5 | 2216 | $2,121 | $0.96 | 22d | 1 | 0.52mi |
| 2923 Granite Vale Rd Houston, TX | 4.0 | 2.0 | 2319 | $2,350 | $1.01 | 43d | 1 | 1.03mi |
| 4206 Grand Sunnyview Ln Houston, TX | 5.0 | 3.5 | 4029 | $3,500 | $0.87 | 43d | 1 | 1.25mi |
| 19034 Village Maple Ct Houston, TX | 4.0 | 2.5 | 3142 | $2,525 | $0.80 | 22d | 1 | 1.39mi |
HOA detail
- Monthly dues
- $40 · $480/yr
Listing history 25 events
-
2026-06-02days on market $298,000 Pending 32 DOM
-
2026-06-01days on market $298,000 Pending 31 DOM
-
2026-05-31days on market $298,000 Pending 30 DOM
-
2026-05-01$298,000 Active 799-char remark
-
2026-04-30historical
-
2026-04-06price $308,000
-
2026-03-29status Active
-
2026-03-25historical
-
2026-03-18$319,000 Active
-
2019-01-25soldstatus
-
2019-01-24soldstatus Sold
Show marketing remark (157 chars)
Spacious two story home with four bedrooms, formal living/dining combo, family room, game room and large kitchen/breakfast area. Did NOT flood during Harvey.
-
2019-01-11status Pending
Show marketing remark (157 chars)
Spacious two story home with four bedrooms, formal living/dining combo, family room, game room and large kitchen/breakfast area. Did NOT flood during Harvey.
-
2019-01-03status Option Pending
Show marketing remark (157 chars)
Spacious two story home with four bedrooms, formal living/dining combo, family room, game room and large kitchen/breakfast area. Did NOT flood during Harvey.
-
2018-12-17status Active
Show marketing remark (157 chars)
Spacious two story home with four bedrooms, formal living/dining combo, family room, game room and large kitchen/breakfast area. Did NOT flood during Harvey.
-
2018-12-17status Pending
Show marketing remark (157 chars)
Spacious two story home with four bedrooms, formal living/dining combo, family room, game room and large kitchen/breakfast area. Did NOT flood during Harvey.
-
2018-12-07status Option Pending
Show marketing remark (157 chars)
Spacious two story home with four bedrooms, formal living/dining combo, family room, game room and large kitchen/breakfast area. Did NOT flood during Harvey.
-
2018-11-20price $197,000
Show marketing remark (157 chars)
Spacious two story home with four bedrooms, formal living/dining combo, family room, game room and large kitchen/breakfast area. Did NOT flood during Harvey.
-
2018-10-17$203,000 Active
Show marketing remark (157 chars)
Spacious two story home with four bedrooms, formal living/dining combo, family room, game room and large kitchen/breakfast area. Did NOT flood during Harvey.
-
2017-10-25historical
-
2017-09-16status Active
-
2017-09-02status Pending
-
2017-08-23status Option Pending
-
2017-08-15$189,500 Active
-
2015-06-19historical
-
2015-06-03$185,000 Active
ⓘ Source: listings_history table (triggers on properties + properties_extension) + one-shot
backfill from property_details.listing_events for pre-trigger history.
Tax reassessment forecast TX · Resets to sale price
- Current annual tax
- $6,339 · $528/mo
- Projected year-2 tax
- $6,339 · $528/mo
- Expected delta
- $0/yr ($0/mo · 0.0%)
ⓘ Screening estimate from a state-policy table — verify with the county assessor before closing.
Climate risk First Street
- Flood 1/10 Low FEMA zone X (unshaded) · 0% chance over 30 yrs
- Wildfire 3/10 Moderate
- Heat 9/10 Extreme 7 d/yr ≥110°F today · 23 d/yr by 30 yrs out
- Wind 9/10 Extreme 99% chance of damaging wind over 30 yrs
- Air quality 2/10 Low 2 unhealthy d/yr today · 2 by 30 yrs out
Nearby sold comps map
Loading sold comps map…
Walkable amenities ~0.75 mi
Loading nearby amenities…
Taxation est. · year 1
- Rental income
- $28,248
- − Mortgage interest
- −$16,693
- − Property taxes
- −$6,339
- − Insurance
- −$1,490
- − Repairs & maintenance
- −$2,260
- − Management
- −$2,260
- − HOA
- −$480
- − Depreciation
- −$8,669
- Taxable loss
- −$9,943
- Est. tax savings @ 24.0%
- +$2,386
- After-tax cash flow
- $-2,360/yr
For passive investors: Depreciation is non-cash, so a rental often shows a tax loss while cash-flowing — sheltering income. Rental losses are passive: they offset passive income freely, and up to $25,000/yr can offset ordinary (W-2) income if you actively participate and your MAGI is under $100k (phasing out to $0 by $150k); unused losses carry forward. On sale, claimed depreciation is recaptured at up to 25%, and gains may owe capital-gains tax (a 1031 exchange can defer both). Figures are a year-1 estimate at your 24.0% rate — not tax advice; consult a CPA.
Schools (NCES district)
- District
- Katy ISD
- NCES district ID
- 4825170
- Math proficiency
- 61% ▼ -7.00%
- Reading proficiency
- 63% ▼ -3.00%
- Median HH income
- $90,312
- Composite
- 56.59/100
- National rank
- #1146
- State rank
- #29 of 826 in TX
Livability — Houston
- Score
- 74/100
- State rank
- #184
- US rank
- #4771
Category grades
Schools grade is shown separately in the Schools card above.
Census & demographics
- County
- Harris County · 4,702,590 people
- City population
- 3,226,434
- Metro
- Houston-The Woodlands-Sugar Land, TX
- Population (ZIP)
- 110,217
- Household income
- $80,575
- Rent vs Own
- Severe rent burden
- 3257.0
Population outlook (Harris County) Hauer SSP2
- Today (2025)
- 5,571,493 people
- By 2030
- 6,089,821 · +9.3%
- By 2040
- 7,142,806 · +28.2%
- By 2050
- 8,185,864 · +46.9%
- By 2075
- 10,574,329 · +89.8%
- By 2100
- 12,109,958 · +117.4%
Race, ethnicity, and origin ACS 2023
- Neighborhood character
- Diverse neighborhood (Simpson 0.69)
- Race & ethnicity
- Hispanic / Latino 48% Two or more races 22% White 22% Black 16% Asian 11% Native American 2%
- Hispanic origin (detail)
- Mexican 27% Cuban 2%
- Common ancestry
- Lithuanian 1% Romanian 1% Slovak 1%
- Foreign-born
- 32% · Canada, Vietnam, Jamaica
- Languages at home
- 48% English-only · Spanish 38% Other Indo-European 5% Vietnamese 3%
Political lean MEDSL · Harris
- 2024 margin
- Lean D (+5.5) · D 52.0% · R 46.4% · Other 1.6%
- 2008→2024 swing
- +3.9pp toward D · 2008: 1.6pp · 2024: 5.5pp
- All cycles
- 2024: D+5.5 2020: D+13.3 2016: D+12.4 2012: D+0.1 2008: D+1.6
Not yet ingested
- Civics
- —
Market trends
- HPI YoY
- ▼ -1.40%
- Current HPI
- 251.8474
- Rent YoY
- ▼ -2.89%
- Metro
- Houston-The Woodlands-Sugar Land, TX
- State GDP YoY
- ▲ 3.95%
- F500 in state
- 110
Industry mix (Fortune 500 HQ in TX)
| Industry | F500 HQs | Revenue |
|---|---|---|
| Energy | 16 | $1,198B |
|
||
| Technology | 5 | $198B |
|
||
| Engineering / Construction | 4 | $72B |
|
||
| Energy Services | 3 | $60B |
|
||
| Utilities | 3 | $41B |
|
||
| Healthcare | 2 | $330B |
|
||
Price history
+61.1% since first listed24 events — show timeline
- 2026-06-03 Pending — HARMLS
- 2026-05-27 Pending — HARMLS
- 2026-05-01 Listed $298,000 HARMLS
- 2026-04-30 Listing Removed — HARMLS
- 2026-04-06 Price Changed $308,000 HARMLS
- 2026-03-29 Relisted — HARMLS
- 2026-03-25 Listing Removed — HARMLS
- 2026-03-18 Listed $319,000 HARMLS
- 2019-01-25 Sold (Public Records) — Public Records
- 2019-01-24 Sold (MLS) — HARMLS
- 2019-01-11 Pending — HARMLS
- 2019-01-03 Pending — HARMLS
- 2018-12-17 Relisted — HARMLS
- 2018-12-17 Pending — HARMLS
- 2018-12-07 Pending — HARMLS
- 2018-11-20 Price Changed $197,000 HARMLS
- 2018-10-17 Listed $203,000 HARMLS
- 2017-10-25 Listing Removed — HARMLS
- 2017-09-16 Relisted — HARMLS
- 2017-09-02 Pending — HARMLS
- 2017-08-23 Pending — HARMLS
- 2017-08-15 Listed $189,500 HARMLS
- 2015-06-19 Listing Removed — HARMLS
- 2015-06-03 Listed $185,000 HARMLS
Property tax history
+7.9%/yrLatest (2025): $6,339 · -3.1% YoY. Source: county tax records.
Cash-flow waterfall
monthlySold comps — $/sqft
last 12 mo · ≤1 miLoading sold comps…