 Duplex
40 42 Italy St · Conyngham, PA
Flood risk 9/10 · Severe
- FEMA flood zone
- X (shaded)
- Chance of flooding over 30 yrs
- 0.99%
- Est. flood insurance / yr
- $507 – $1,088
Fire risk 2/10 · Minimal
- Est. fire insurance / yr
- $511 – $949
Heat risk 4/10 · Minor
- Hot days now (above 97°F)
- 8 days/yr
- Hot days in 30 yrs
- 17 days/yr
Wind risk 3/10 · Minor
- Chance of severe wind over 30 yrs
- 4.0%
Air-quality risk 2/10 · Minimal
- Unhealthy air days now
- 1 days/yr
- Unhealthy air days in 30 yrs
- 2 days/yr
Risk factors via First Street. Map © Google.
Why this score? — see what drove the B grade
The composite is a weighted blend of 9 inputs, each scored 0–100. Each bar is that input's sub-score; the figure is the points it added to the 100-point composite (weight × sub-score).
- Cash flow +26.9/30.0
- Appreciation +10.0/10.0
- DSCR +9.3/10.0
- ARV discount +7.5/15.0
- 1% rule +6.9/10.0
- Livability +3.9/5.0
- Rent growth +2.5/5.0
- Condition / age +2.5/5.0
- Schools +2.0/10.0
$169,000
🖨 Deal sheet 📄 Offer letter ✓ Due diligence
Multi-family units
County records classify this as Multi-Family (2-4 Unit). Listing-text estimate: 2 units. confirmed
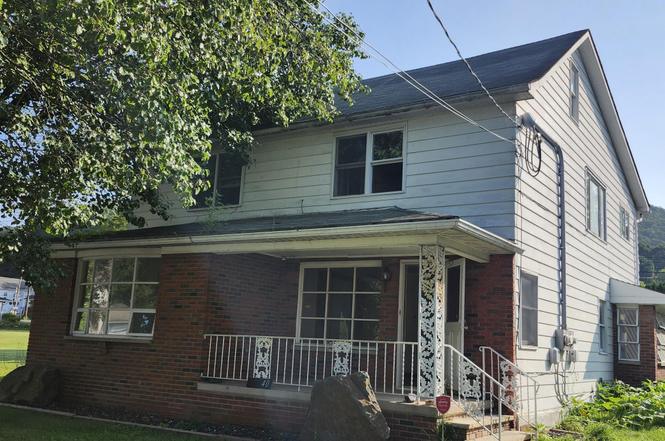
Listing remarks
Duplex with some updates, needs to be completed. Large garage in rear.
Key facts
- 7,500 sq ft lot
- 2 garage spots
- Listed 66 days
Property features AI
Exterior
- Parking: Detached off-street garage with 2 garage spaces
- Utilities: Public water; Public sewer
- Home design: Multi-family residential income property; Zoned residential
- Construction: Aluminum siding and brick exterior
- Exterior features: Front porch
Interior
- Heating & cooling: Oil baseboard heating
- Interior features: Full unfinished basement
Neighborhood map
What this means for you Summary
Snapshot
- This is a 2 × 2-bed/1.5-bath units multifamily listed at $169k.
Deal economics
- At list price, monthly cash flow is $400 ($5k/yr) — positive. Per door: $200/mo.
- The deal already cash-flows at list — no discount required.
- Meets the 1% rule at list price ($2k rent vs $169k).
- Recommended offer: $159k (6.0% below list) — sets the bar for market timing.
- Cap rate 9.6% vs local median 2.5% in Conyngham — top-decile yield for the area; either an underpriced asset or a hidden risk that comps aren't pricing in. Stress-test before assuming the spread holds.
Location & tenants
- Location reads 77/100 on livability (#331 in PA, #2,897 nationally) — a middle-class / working-renter tenant base. Strengths: crime A+, cost of living A+, housing A+; Watch: amenities F, commute F.
- Greater Nanticoke Area SD (suburban): math 14% / reading 34% proficiency, ranked #479 of 539 in PA (top 89%) — low school quality limits family demand, transient renter base, plan for 1-2y turnover.
- Market conditions: 35 active listings in the ZIP; 349 units permitted in Luzerne County in 2024 (16 in 5+ unit buildings).
Forward outlook
- In year one you build about $18k of equity ($1k loan paydown + $17k appreciation (10.0% local appreciation)).
- Luzerne County population projected at +4% by 2050 — modest demand growth; plan on rents tracking national, not racing it.
- At projected returns (10.0% appreciation + 3.0% rent growth), your $47k cash investment doubles in ~2 years — after that, you're playing with house money.
- By year 3, paydown + projected appreciation supports a ~$46k cash-out refi (75% LTV) — recoverable capital for the next deal without selling this one.
Negotiation context
- It's been on market 66 days — a 6% lower offer ($159k) is reasonable based on typical stale-listing flexibility.
- Current owner paid $94k; list at $169k implies a 80% gain — meaningful room to come down on a strong offer.
Risks & watch-outs
- Watch-outs: flood insurance adds $66/mo; built in 1910 — expect roof / HVAC / electrical / plumbing capex.
- Climate carrying-cost: severe flood risk — expect insurance premiums to compound above CPI over the hold.
Questions for the listing agent
- It's been on market 66 days. Have you received any prior offers? Is the seller open to a 6% concession, seller financing, or rate buy-down credit?
- Can we see the unit-by-unit rent roll, current vacancy, and any below-market leases? What's the average tenancy length?
- What capital expenditures (roof, boiler, parking lot, exteriors) have been made in the last 5 years, and what's planned in the next 2?
- Built in 1910 — when were the roof, HVAC, electrical panel, plumbing, and water heater last replaced?
- What's the actual annual flood-insurance premium (NFIP or private), and is the property in a SFHA with mandatory coverage?
- Why hasn't it sold? Are there any deal-killer items the seller is aware of (foundation, flood, title, zoning, code violations)?
- Is there a deadline driving the sale (1031 exchange, divorce, estate, relocation)? That informs how much negotiation room exists.
- What's the average days-on-market for RENTAL listings here right now (not sales)? A rising rental-DOM trend means longer vacancies and softer asking-rent achievability than the comps imply.
- What's the recent tenant-quality profile in this submarket — average credit score on applications, eviction rate, late-payment / NSF rate, and stable-employment percentage? A property-management company in the area should have these aggregated.
- How much new apartment / multifamily construction is in the pipeline within 1–3 miles? Heavy new supply (>2% of stock underway) typically softens rents 12–24 months out; light construction supports rent growth.
Investment metrics
- 1% rule
- 1.19% ✓
- Cap rate
- 9.61%
- Cash-on-cash
- 11.84%
- DSCR
- 1.53
- GRM
- 7.0
CMA / ARV
No comps found within radius.
Projected returns pro-forma
10.0% appreciation · 3.0% rent growth · sell at horizon
- IRR
- 31.7%
- Equity multiple
- 3.49×
- Total profit
- $117,590
- Equity at exit
- $152,249
- IRR
- 27.4%
- Equity multiple
- 7.90×
- Total profit
- $326,316
- Equity at exit
- $328,330
Cash invested: $47,320 (down + closing). Projections, not guarantees.
Landlord ↔ Tenant lean methodology
- Overall (STATE)
- 62 Landlord-Friendly
- State Pennsylvania
- 62 Landlord-Friendly · EVEN
- County
- — inherits STATE
- City
- — inherits STATE
ZIP-level market 18655
- Home prices YoY
- 13.9%
- Active inventory
- 35
- Price-to-rent
- 14.0×
Monthly cashflow live
- Estimated rent
- $2,014 medium interval (Pro) →
- Mortgage (P&I)
- −$886
- Tax from tax record
- −$167 /mo · $2,010/yr
- Insurance
- −$70
- Flood insurance flood zone
- −$66 /mo · $798/yr
- HOA
- −$0
- Vacancy / Maint / Mgmt
- −$423
- Net cashflow
- $400
Break-even live
2-unit breakdown (identical units grouped — click to expand)
| Units | Beds | Baths | Est. rent |
|---|---|---|---|
| 2× units | 2 | 1.5 | $2,014 |
| #1 | 2 | 1.5 | $1,007 |
| #2 | 2 | 1.5 | $1,007 |
| Total (2 units) | $2,014 | ||
UW: 25.0% down · 7.5% · 30yr · 1.5% tax · 5.0% vac · 8.0% maint · 8.0% mgmt
Financing live
Cash to close
- Down payment
- $42,250
- Closing costs
- $5,070
- Reserves months
- —
- Total cash needed
- —
Loan-product check · same deal, 3 products live
Conventional
25% down · 7.5% · 30yr
- Down + closing
- —
- Monthly P&I
- —
- Monthly cashflow
- —
- DSCR
- —
- Eligible?
- —
Personal DTI + credit; lowest rate.
DSCR
20% down · 8.5% · 30yr
- Down + closing
- —
- Monthly P&I
- —
- Monthly cashflow
- —
- DSCR
- —
- Eligible?
- —
No personal income docs; deal must DSCR.
Hard money
10% down · 12.0% · 12mo
- Down + closing
- —
- Monthly P&I
- —
- Monthly cashflow
- —
- DSCR
- —
- Eligible?
- —
Short-term bridge; refi at stabilization.
Listing history 17 events
-
2026-06-18days on market $169,000 Active 66 DOM
-
2026-06-17days on market $169,000 Active 65 DOM
-
2026-06-16days on market $169,000 Active 64 DOM
-
2026-06-15days on market $169,000 Active 63 DOM
-
2026-06-14days on market $169,000 Active 61 DOM
-
2026-06-13days on market $169,000 Active 60 DOM
-
2026-06-10days on market $169,000 Active 58 DOM
-
2026-06-09days on market $169,000 Active 57 DOM
-
2026-06-09status $169,000 Active 56 DOM
-
2026-04-29status Pending
-
2026-03-04$169,000 Active
-
2026-01-06price $159,000
-
2025-11-24price $169,000
-
2025-09-22price $179,000
-
2025-09-04price $184,000
-
2010-04-21soldstatus $94,000
-
2005-05-31soldstatus $90,000
ⓘ Source: listings_history table (triggers on properties + properties_extension) + one-shot
backfill from property_details.listing_events for pre-trigger history.
Tax reassessment forecast PA · Partial reset (capped growth)
- Current annual tax
- $2,010 · $167/mo
- Projected year-2 tax
- $2,340 · $195/mo
- Expected delta
- +$330/yr (+$28/mo · 16.4%)
ⓘ Screening estimate from a state-policy table — verify with the county assessor before closing.
Climate risk First Street
- Flood 9/10 Extreme FEMA zone X (shaded) · 99% chance over 30 yrs
- Wildfire 2/10 Low
- Heat 4/10 Moderate 8 d/yr ≥97°F today · 17 d/yr by 30 yrs out
- Wind 3/10 Moderate 4% chance of damaging wind over 30 yrs
- Air quality 2/10 Low 1 unhealthy d/yr today · 2 by 30 yrs out
Nearby sold comps map
Loading sold comps map…
Walkable amenities ~0.75 mi
Loading nearby amenities…
Taxation est. · year 1
- Rental income
- $24,168
- − Mortgage interest
- −$9,467
- − Property taxes
- −$2,010
- − Insurance
- −$1,642
- − Repairs & maintenance
- −$1,933
- − Management
- −$1,933
- − Depreciation
- −$4,916
- Taxable income
- $2,266
- Est. tax owed @ 24.0%
- −$544
- After-tax cash flow
- $4,261/yr
For passive investors: Depreciation is non-cash, so a rental often shows a tax loss while cash-flowing — sheltering income. Rental losses are passive: they offset passive income freely, and up to $25,000/yr can offset ordinary (W-2) income if you actively participate and your MAGI is under $100k (phasing out to $0 by $150k); unused losses carry forward. On sale, claimed depreciation is recaptured at up to 25%, and gains may owe capital-gains tax (a 1031 exchange can defer both). Figures are a year-1 estimate at your 24.0% rate — not tax advice; consult a CPA.
Schools (NCES district)
- District
- Greater Nanticoke Area SD
- NCES district ID
- 4216290
- Math proficiency
- 14% ▼ -8.00%
- Reading proficiency
- 34% ▼ -14.00%
- Median HH income
- $38,990
- Composite
- 20.1/100
- National rank
- #8647
- State rank
- #479 of 539 in PA
Livability — Conyngham
- Score
- 77/100
- State rank
- #331
- US rank
- #2897
Category grades
Schools grade is shown separately in the Schools card above.
Census & demographics
- Census place
- Mocanaqua, PA
- City population
- 1,072
- Population (ZIP)
- 5,789
Population outlook (Luzerne County) Hauer SSP2
- Today (2025)
- 319,505 people
- By 2030
- 319,943 · +0.1%
- By 2040
- 322,643 · +1.0%
- By 2050
- 330,817 · +3.5%
- By 2075
- 379,145 · +18.7%
- By 2100
- 431,908 · +35.2%
Race, ethnicity, and origin ACS 2023
- Neighborhood character
- Predominantly White (95%)
- Race & ethnicity
- White 95% Two or more races 4% Hispanic / Latino 3%
- Common ancestry
- Romanian 19% Lithuanian 5% Iranian 3%
- Foreign-born
- 1%
- Languages at home
- 98% English-only · Russian/Polish/Slavic 1% Spanish 1%
Political lean MEDSL · Luzerne
- 2024 margin
- R (+19.2) · D 40.0% · R 59.2%
- 2008→2024 swing
- -27.6pp toward R · 2008: 8.4pp · 2024: -19.2pp
- All cycles
- 2024: R+19.2 2020: R+14.4 2016: R+19.6 2012: D+4.8 2008: D+8.4
Not yet ingested
- Civics
- —
Market trends
- HPI YoY
- ▲ 34.48%
- Current HPI
- 282.3106
- Rent YoY
- —
- Metro
- —
- State GDP YoY
- ▲ 1.68%
- F500 in state
- 34
Industry mix (Fortune 500 HQ in PA)
| Industry | F500 HQs | Revenue |
|---|---|---|
| Healthcare | 2 | $309B |
|
||
| Insurance | 2 | $27B |
|
||
| Telecommunications / Media | 1 | $124B |
|
||
| Industrial Distribution | 1 | $22B |
|
||
| Financial Services | 1 | $20B |
|
||
| Chemicals / Materials | 1 | $18B |
|
||
Price history
+87.8% since first listed8 events — show timeline
- 2026-04-29 Pending — LCAR
- 2026-03-04 Listed $169,000 LCAR
- 2026-01-06 Price Changed $159,000 LCAR
- 2025-11-24 Price Changed $169,000 LCAR
- 2025-09-22 Price Changed $179,000 LCAR
- 2025-09-04 Price Changed $184,000 LCAR
- 2010-04-21 Sold (Public Records) $94,000 Public Records
- 2005-05-31 Sold (Public Records) $90,000 Public Records
Property tax history
+1.9%/yrLatest (2026): $2,010 · +0.5% YoY. Source: county tax records.
Cash-flow waterfall
monthlySold comps — $/sqft
last 12 mo · ≤1 miLoading sold comps…