10935 Guadalupe St · Santa Maria, TX
Flood risk 1/10 · Minimal
- FEMA flood zone
- X (unshaded)
- Chance of flooding over 30 yrs
- 0.0%
- Est. flood insurance / yr
- $507 – $1,088
Fire risk 4/10 · Minor
- Est. fire insurance / yr
- $1,222 – $2,270
Heat risk 9/10 · Severe
- Hot days now (above 110°F)
- 7 days/yr
- Hot days in 30 yrs
- 23 days/yr
Wind risk 8/10 · Major
- Chance of severe wind over 30 yrs
- 99.0%
Air-quality risk 1/10 · Minimal
- Unhealthy air days now
- 0 days/yr
- Unhealthy air days in 30 yrs
- 0 days/yr
Risk factors via First Street. Map © Google.
Why this score? — see what drove the B grade
The composite is a weighted blend of 9 inputs, each scored 0–100. Each bar is that input's sub-score; the figure is the points it added to the 100-point composite (weight × sub-score).
- Cash flow +30.0/30.0
- DSCR +10.0/10.0
- 1% rule +9.9/10.0
- ARV discount +7.5/15.0
- Appreciation +5.0/10.0
- Livability +2.7/5.0
- Rent growth +2.5/5.0
- Condition / age +2.2/5.0
- Schools +1.1/10.0
$80,000
🖨 Deal sheet 📄 Offer letter ✓ Due diligence
Listing remarks MLS
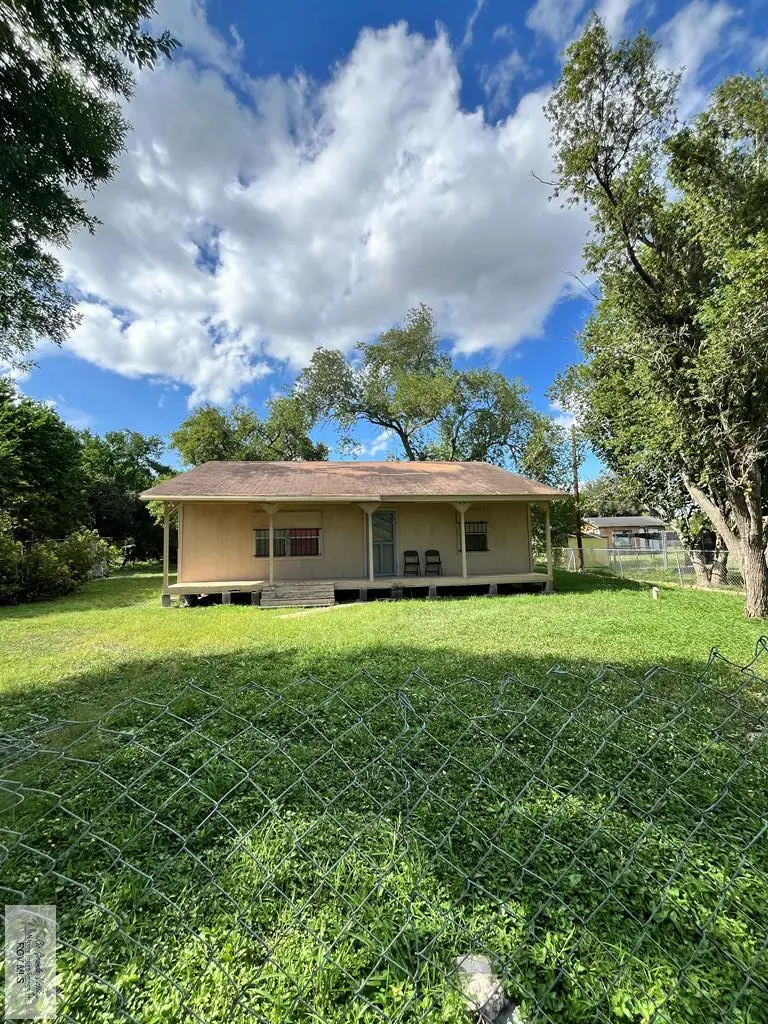
!!INVESTORS!!Check out this cute cozy home that has plenty of potential to flip for a rental property. . this property is conveniently located in a quiet established neighborhood. With the HUGE backyard and matured trees for shade it makes it great for those summer BBQ'S! COME TAKE A LOOK, SCHEDULE A SHOWING TODAY!
Key facts
- Huge backyard
- 0.3 acre lot
- Built 1980
Tags
Neighborhood map
What this means for you Summary
Snapshot
- This is a 3-bed/1.0-bath single-family listed at $80k. Condition is rated fair.
Deal economics
- At list price, monthly cash flow is $386 ($5k/yr) — positive.
- The deal already cash-flows at list — no discount required.
- Meets the 1% rule at list price ($1k rent vs $80k).
- Recommended offer: $70k (12.0% below list) — sets the bar for market timing.
Location & tenants
- Location reads 54/100 on livability (#1,419 in TX) — a working-class tenant base; expect higher turnover. Strengths: cost of living A+, housing B+; Watch: schools F, crime F, amenities F.
- Santa Maria ISD (rural): math 10% / reading 20% proficiency, ranked #819 of 826 in TX (top 99%) — low school quality limits family demand, transient renter base, plan for 1-2y turnover; 65% free/reduced lunch — lower-income household profile, screen leases tightly.
- Market conditions: 3 active listings in the ZIP; 2,326 units permitted in Cameron County in 2024 (503 in 5+ unit buildings).
Forward outlook
- In year one you build about $3k of equity ($553 loan paydown + $2k appreciation (3.0% local appreciation)).
- Cameron County population projected at +3% by 2050 — modest demand growth; plan on rents tracking national, not racing it.
- At projected returns (3.0% appreciation + 3.0% rent growth), your $22k cash investment doubles in ~3 years — after that, you're playing with house money.
Negotiation context
- It's been on market 333 days — a 12% lower offer ($70k) is reasonable based on typical stale-listing flexibility.
Risks & watch-outs
- Climate carrying-cost: severe wind risk, 99% chance of damaging wind over 30y; extreme-heat days projected 7→23/yr by 2055 (HVAC capex compounding) — expect insurance premiums to compound above CPI over the hold.
Questions for the listing agent
- It's been on market 333 days. Have you received any prior offers? Is the seller open to a 12% concession, seller financing, or rate buy-down credit?
- Have any recent inspections been done? Can we get a copy of the seller's disclosures and any deferred-maintenance estimates?
- Why hasn't it sold? Are there any deal-killer items the seller is aware of (foundation, flood, title, zoning, code violations)?
- Is there a deadline driving the sale (1031 exchange, divorce, estate, relocation)? That informs how much negotiation room exists.
- Schools are F-rated, which usually means shorter tenancies and higher turnover. Who's the typical renter profile here, and what's been the actual vacancy rate?
- Crime grade is F in this area — have there been break-ins, vandalism, or insurance claims at this property in the last 3 years? What carrier currently insures it and at what premium?
- What's the average days-on-market for RENTAL listings here right now (not sales)? A rising rental-DOM trend means longer vacancies and softer asking-rent achievability than the comps imply.
- What's the recent tenant-quality profile in this submarket — average credit score on applications, eviction rate, late-payment / NSF rate, and stable-employment percentage? A property-management company in the area should have these aggregated.
- How much new for-sale + rental construction is in the pipeline within 1–3 miles? Heavy new supply typically softens prices + rents 12–24 months out; constrained supply supports both.
Investment metrics
- 1% rule
- 1.49% ✓
- Cap rate
- 12.09%
- Cash-on-cash
- 20.69%
- DSCR
- 1.92
- GRM
- 5.6
CMA / ARV
- ARV (median comp)
- $179,548
- List price
- $80,000
- Delta
- -55.44%
- Verdict
- UNDERPRICED
- Comps
- 6 within 2.0 mi
Projected returns pro-forma
3.0% appreciation · 3.0% rent growth · sell at horizon
- IRR
- 27.0%
- Equity multiple
- 2.53×
- Total profit
- $34,253
- Equity at exit
- $35,971
- IRR
- 27.6%
- Equity multiple
- 4.91×
- Total profit
- $87,502
- Equity at exit
- $55,436
Cash invested: $22,400 (down + closing). Projections, not guarantees.
Landlord ↔ Tenant lean methodology
- Overall (STATE)
- 87 Strongly Landlord-Friendly
- State Texas
- 87 Strongly Landlord-Friendly · R+5
- County
- — inherits STATE
- City
- — inherits STATE
ZIP-level market 78592
- Active inventory
- 3
- Price-to-rent
- 5.6×
Monthly cashflow live
- Estimated rent
- $1,189 medium interval (Pro) →
- Mortgage (P&I)
- −$420
- Tax est. 1.5%
- −$100 /mo · $1,200/yr
- Insurance
- −$33
- HOA
- −$0
- Vacancy / Maint / Mgmt
- −$250
- Net cashflow
- $386
Break-even live
UW: 25.0% down · 7.5% · 30yr · 1.5% tax · 5.0% vac · 8.0% maint · 8.0% mgmt
Financing live
Cash to close
- Down payment
- $20,000
- Closing costs
- $2,400
- Reserves months
- —
- Total cash needed
- —
Loan-product check · same deal, 3 products live
Conventional
25% down · 7.5% · 30yr
- Down + closing
- —
- Monthly P&I
- —
- Monthly cashflow
- —
- DSCR
- —
- Eligible?
- —
Personal DTI + credit; lowest rate.
DSCR
20% down · 8.5% · 30yr
- Down + closing
- —
- Monthly P&I
- —
- Monthly cashflow
- —
- DSCR
- —
- Eligible?
- —
No personal income docs; deal must DSCR.
Hard money
10% down · 12.0% · 12mo
- Down + closing
- —
- Monthly P&I
- —
- Monthly cashflow
- —
- DSCR
- —
- Eligible?
- —
Short-term bridge; refi at stabilization.
Listing history 18 events
-
2026-06-18days on market $80,000 Active 333 DOM
-
2026-06-17days on market $80,000 Active 332 DOM
-
2026-06-16days on market $80,000 Active 331 DOM
-
2026-06-15days on market $80,000 Active 330 DOM
-
2026-06-14days on market $80,000 Active 328 DOM
-
2026-06-10days on market $80,000 Active 325 DOM
-
2026-06-09days on market $80,000 Active 324 DOM
-
2026-06-08days on market $80,000 Active 323 DOM
-
2026-06-07days on market $80,000 Active 322 DOM
-
2026-06-05days on market $80,000 Active 319 DOM
-
2026-06-03days on market $80,000 Active 318 DOM
-
2026-06-02days on market $80,000 Active 317 DOM
-
2026-06-01days on market $80,000 Active 316 DOM
-
2026-05-31days on market $80,000 Active 315 DOM
-
2026-05-30days on market $80,000 Active 314 DOM
-
2026-05-06price $80,000 316-char remark
Show marketing remark (316 chars)
!!INVESTORS!!Check out this cute cozy home that has plenty of potential to flip for a rental property. . this property is conveniently located in a quiet established neighborhood. With the HUGE backyard and matured trees for shade it makes it great for those summer BBQ'S! COME TAKE A LOOK, SCHEDULE A SHOWING TODAY!
-
2025-12-04price $90,000 316-char remark
Show marketing remark (316 chars)
!!INVESTORS!!Check out this cute cozy home that has plenty of potential to flip for a rental property. . this property is conveniently located in a quiet established neighborhood. With the HUGE backyard and matured trees for shade it makes it great for those summer BBQ'S! COME TAKE A LOOK, SCHEDULE A SHOWING TODAY!
-
2025-07-21$95,000 Active 316-char remark
Show marketing remark (316 chars)
!!INVESTORS!!Check out this cute cozy home that has plenty of potential to flip for a rental property. . this property is conveniently located in a quiet established neighborhood. With the HUGE backyard and matured trees for shade it makes it great for those summer BBQ'S! COME TAKE A LOOK, SCHEDULE A SHOWING TODAY!
ⓘ Source: listings_history table (triggers on properties + properties_extension) + one-shot
backfill from property_details.listing_events for pre-trigger history.
Climate risk First Street
- Flood 1/10 Low FEMA zone X (unshaded) · 0% chance over 30 yrs
- Wildfire 4/10 Moderate
- Heat 9/10 Extreme 7 d/yr ≥110°F today · 23 d/yr by 30 yrs out
- Wind 8/10 Severe 99% chance of damaging wind over 30 yrs
- Air quality 1/10 Low 0 unhealthy d/yr today · 0 by 30 yrs out
Nearby sold comps map
Loading sold comps map…
Walkable amenities ~0.75 mi
Loading nearby amenities…
Taxation est. · year 1
- Rental income
- $14,264
- − Mortgage interest
- −$4,481
- − Property taxes
- −$1,200
- − Insurance
- −$400
- − Repairs & maintenance
- −$1,141
- − Management
- −$1,141
- − Depreciation
- −$2,327
- Taxable income
- $3,574
- Est. tax owed @ 24.0%
- −$858
- After-tax cash flow
- $3,777/yr
For passive investors: Depreciation is non-cash, so a rental often shows a tax loss while cash-flowing — sheltering income. Rental losses are passive: they offset passive income freely, and up to $25,000/yr can offset ordinary (W-2) income if you actively participate and your MAGI is under $100k (phasing out to $0 by $150k); unused losses carry forward. On sale, claimed depreciation is recaptured at up to 25%, and gains may owe capital-gains tax (a 1031 exchange can defer both). Figures are a year-1 estimate at your 24.0% rate — not tax advice; consult a CPA.
Condition & rehab AI · 12 photos
This single-family home requires moderate renovations to improve its curb appeal and interior. A fresh paint job, new kitchen cabinets and countertops, and updated bathroom fixtures would significantly increase its value.
Repairs flagged
- Major kitchen cabinets — severe wear
- Major bathroom fixtures — severe wear
- Moderate paint — moderate wear
Value-add opportunities
- Both paint job — enhances curb appeal and interior
- Both new kitchen cabinets and countertops — modernizes and increases value
- Both new bathroom fixtures — modernizes and increases value
Renovation cost estimate screening
| Repair item | Severity | Est. cost |
|---|---|---|
| kitchen cabinets · severe wear | Major | $15,000–50,000 |
| bathroom fixtures · severe wear | Major | $15,000–50,000 |
| paint · moderate wear | Moderate | $3,000–15,000 |
| Total estimated repair cost · 3 items | $33,000–115,000 |
Value-add ROI direction
- Both paint job — enhances curb appeal and interior ↑
- Both new kitchen cabinets and countertops — modernizes and increases value ↑
- Both new bathroom fixtures — modernizes and increases value ↑
ⓘ Cost ranges are severity-bucket heuristics (US national rule-of-thumb). Get contractor quotes + a written scope before underwriting a rehab budget.
Schools (NCES district)
- District
- Santa Maria ISD
- NCES district ID
- 4839330
- Math proficiency
- 10% ▼ -17.00%
- Reading proficiency
- 20% ▼ -6.00%
- Median HH income
- $25,849
- Composite
- 11.42/100
- National rank
- #9707
- State rank
- #819 of 826 in TX
Livability — Santa Maria
- Score
- 54/100
- State rank
- #1419
- US rank
- #24231
Category grades
Schools grade is shown separately in the Schools card above.
Census & demographics
- Census place
- Santa Maria, TX
- Population (ZIP)
- 600
Population outlook (Cameron County) Hauer SSP2
- Today (2025)
- 441,603 people
- By 2030
- 448,113 · +1.5%
- By 2040
- 456,385 · +3.3%
- By 2050
- 456,294 · +3.3%
- By 2075
- 423,851 · -4.0%
- By 2100
- 342,787 · -22.4%
Race, ethnicity, and origin ACS 2023
- Neighborhood character
- Predominantly Hispanic (100%)
- Race & ethnicity
- Hispanic / Latino 100% Two or more races 42%
- Hispanic origin (detail)
- Mexican 100%
- Foreign-born
- 34% · Canada
- Languages at home
- 14% English-only · Spanish 86%
Political lean MEDSL · Cameron
- 2024 margin
- Lean R (+5.8) · D 46.7% · R 52.5%
- 2008→2024 swing
- -34.6pp toward R · 2008: 28.8pp · 2024: -5.8pp
- All cycles
- 2024: R+5.8 2020: D+13.2 2016: D+32.5 2012: D+32.4 2008: D+28.8
Not yet ingested
- Civics
- —
Market trends
- HPI YoY
- —
- Current HPI
- —
- Rent YoY
- —
- Metro
- —
- State GDP YoY
- ▲ 3.95%
- F500 in state
- 110
Industry mix (Fortune 500 HQ in TX)
| Industry | F500 HQs | Revenue |
|---|---|---|
| Energy | 16 | $1,198B |
|
||
| Technology | 5 | $198B |
|
||
| Engineering / Construction | 4 | $72B |
|
||
| Energy Services | 3 | $60B |
|
||
| Utilities | 3 | $41B |
|
||
| Healthcare | 2 | $330B |
|
||
Price history
-15.8% since first listed3 events — show timeline
- 2026-05-06 Price Changed $80,000 RGVMLS
- 2025-12-04 Price Changed $90,000 RGVMLS
- 2025-07-21 Listed $95,000 RGVMLS
Cash-flow waterfall
monthlySold comps — $/sqft
last 12 mo · ≤1 miLoading sold comps…