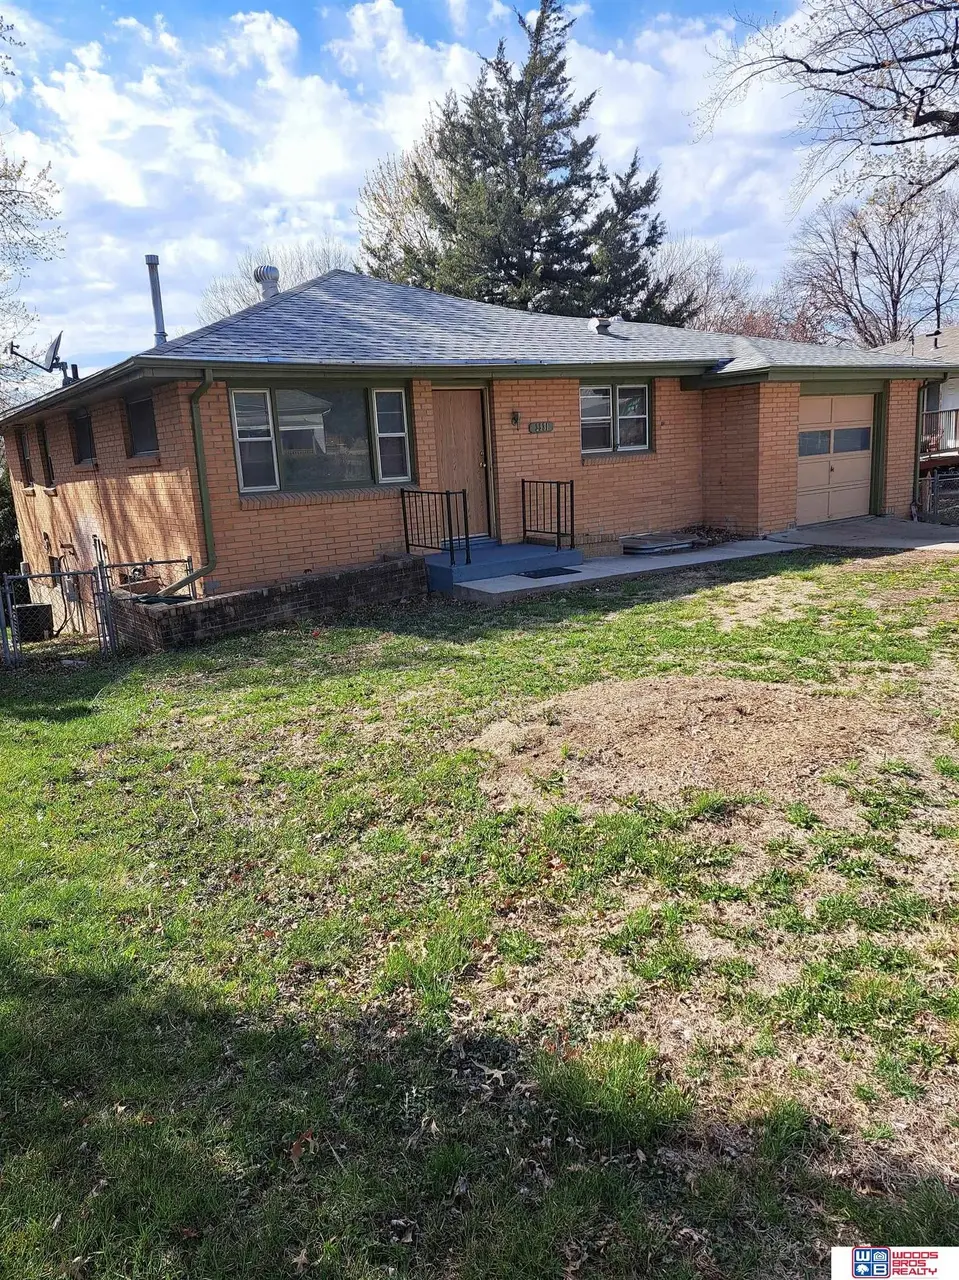
2331 N 70th St · Lincoln, NE
Flood risk 1/10 · Minimal
- FEMA flood zone
- X (unshaded)
- Chance of flooding over 30 yrs
- 0.0%
- Est. flood insurance / yr
- $473 – $860
Fire risk 1/10 · Minimal
- Est. fire insurance / yr
- $1,161 – $2,155
Heat risk 3/10 · Minor
- Hot days now (above 104°F)
- 7 days/yr
- Hot days in 30 yrs
- 16 days/yr
Wind risk 2/10 · Minimal
- Chance of severe wind over 30 yrs
- —
Air-quality risk 1/10 · Minimal
- Unhealthy air days now
- 0 days/yr
- Unhealthy air days in 30 yrs
- 0 days/yr
Risk factors via First Street. Map © Google.
Why this score? — see what drove the C- grade
The composite is a weighted blend of 9 inputs, each scored 0–100. Each bar is that input's sub-score; the figure is the points it added to the 100-point composite (weight × sub-score).
- ARV discount +15.0/15.0
- Cash flow +14.4/30.0
- DSCR +4.4/10.0
- Schools +4.4/10.0
- Livability +4.2/5.0
- 1% rule +3.8/10.0
- Rent growth +3.1/5.0
- Condition / age +2.5/5.0
- Appreciation +0.0/10.0
$219,000
🖨 Deal sheet 📄 Offer letter ✓ Due diligence
Listing remarks MLS
Pre sold for stats only
Key facts
- 6,337 sq ft lot
- Garage
- Built 1959
Property features AI
Exterior
- Parking: Attached 1-car garage; Extra parking slab / open parking (additional space)
- Utilities: Public water; Public sewer
- Home design: Single-family residence; Not new (built in 1959); Total finished area about 1,908 square feet (approximately 1,008 above grade, ~900 below grade)
- Construction: Brick exterior; Block foundation; Built in 1959
- Exterior features: Deck; Partial fencing; Lot about 0.15 acre with dimensions ~105 x 60 x 105 x 60
Interior
- Kitchen: Includes oven, cooktop, refrigerator, dishwasher
- Bedrooms: Main floor primary bedroom (approximately 10 x 13); Main floor bedroom 2 (approximately 10 x 13); Main floor bedroom 3 (approximately 9 x 11); Basement bedroom 4 (approximately 10 x 11); Basement bedroom 5 (approximately 11 x 13)
- Bathrooms: Two bathrooms total: one full and one three-quarter; At least one main-level bathroom and one below-grade bathroom
- Heating & cooling: Natural gas forced-air heating; Central air conditioning
- Interior features: Walk-out basement; No fireplaces; Oven, Refrigerator, Dishwasher, Cooktop
Neighborhood map
What this means for you Summary
Snapshot
- This is a 3-bed/2.0-bath single-family listed at $219k.
Deal economics
- At list price, monthly cash flow is $45 ($543/yr) — positive.
- The deal already cash-flows at list — no discount required.
- To meet the 1% rule (rent ≥ 1% of price), the offer needs to be $192k (12.2% below list).
- Recommended offer: $192k (12.2% below list) — sets the bar for 1% rule.
- Cap rate 6.5% vs local median 3.0% in Lincoln — top-decile yield for the area; either an underpriced asset or a hidden risk that comps aren't pricing in. Stress-test before assuming the spread holds.
Location & tenants
- Location reads 85/100 on livability (#5 in NE, #545 nationally) — a professional / high-income tenant draw. Strengths: amenities A+, cost of living A+, housing A+; Watch: crime D+.
- Lincoln Public Schools (urban): math 50% / reading 53% proficiency, ranked #59 of 111 in NE (top 53%) — acceptable for families but not a draw, mixed tenant base, ~2y average lease.
- Zoned schools: Brownell Elementary School (math 37% / reading 52%, grade F, #289 of 502 statewide, top 63%, 337 students, 68% FRL); Mickle Middle School (math 53% / reading 55%, grade B-, #38 of 128 statewide, top 31%, 694 students, 46% FRL); Lincoln Northeast High School (math 34% / reading 36%, grade F, #207 of 261 statewide, top 79%, 1,812 students, 62% FRL) — zoned schools average 59% FRL vs 37% district-wide (22 pts higher); higher-poverty schools than district average — tighter screening recommended.
- Market conditions: Rents rising (+2.4%/yr); 100 active listings in the ZIP; 8 comparable units currently listed for rent nearby; rentals leasing fast (median 14d on market — plan ~1-2 weeks tenant-placement turnaround); 1,940 units permitted in Lancaster County in 2024 (895 in 5+ unit buildings).
- This rent runs 33% of the median local income ($69k/yr) — at the standard rent-burdened threshold; future hikes will face affordability resistance.
Forward outlook
- Local home prices are declining (-3.0%/yr); year-one equity from $2k of loan paydown is wiped out by about $7k of value loss. Plan a longer hold.
- Lancaster County population projected at +37% by 2050 — long-run rental-demand tailwind backs the buy-and-hold thesis.
Negotiation context
- Only 3 days on market — expect competitive offers; lowballing is unlikely to land.
- 2 sale attempts since 10y ago with the ask held roughly flat each time — persistent listings suggest the price (not the market) is what's stuck; bring a comps-based counter.
Risks & watch-outs
- Watch-outs: built in 1959 — expect roof / HVAC / electrical / plumbing capex.
Questions for the listing agent
- Built in 1959 — when were the roof, HVAC, electrical panel, plumbing, and water heater last replaced?
- Is there a deadline driving the sale (1031 exchange, divorce, estate, relocation)? That informs how much negotiation room exists.
- Schools are A-rated — typically a magnet for longer-tenancy family renters. What's the average tenant stay here, and is there a school-zone premium baked into asking?
- Crime grade is D in this area — have there been break-ins, vandalism, or insurance claims at this property in the last 3 years? What carrier currently insures it and at what premium?
- What's the average days-on-market for RENTAL listings here right now (not sales)? A rising rental-DOM trend means longer vacancies and softer asking-rent achievability than the comps imply.
- What's the recent tenant-quality profile in this submarket — average credit score on applications, eviction rate, late-payment / NSF rate, and stable-employment percentage? A property-management company in the area should have these aggregated.
- How much new for-sale + rental construction is in the pipeline within 1–3 miles? Heavy new supply typically softens prices + rents 12–24 months out; constrained supply supports both.
Investment metrics
- 1% rule
- 0.88% ✗
- Cap rate
- 6.54%
- Cash-on-cash
- 0.89%
- DSCR
- 1.04
- GRM
- 9.5
CMA / ARV
- ARV (median comp)
- $272,993
- List price
- $219,000
- Delta
- -19.78%
- Verdict
- UNDERPRICED
- Comps
- 20 within 1.0 mi
Show comp detail 12 sales within ~0.75 mi
| Address | Dist | Beds/Ba | Sqft | Sold | Price | $/sf | Match |
|---|---|---|---|---|---|---|---|
| 2324 N 74th St | 0.28mi | 3/2.0 | 1,584 (+5%) | 3mo | $275,000 | $174 | 76 |
| 1617 Hays Dr | 0.52mi | 3/2.0 | 1,545 (+2%) | 1mo | $252,500 | $163 | 71 |
| 7500 Colby St | 0.37mi | 3/1.5 | 1,580 (+5%) | 3mo | $300,000 | $190 | 70 |
| 7341 Knox Ct | 0.60mi | 3/2.0 | 1,526 (+1%) | 0mo | $299,500 | $196 | 70 |
| 7311 Garland St | 0.25mi | 3/2.0 | 1,669 (+11%) | 3mo | $250,000 | $150 | 68 |
| 1820 N 62nd St | 0.68mi | 3/2.0 | 1,500 (-0%) | 2mo | $226,000 | $151 | 66 |
| 7320 Starr St | 0.65mi | 2/2.0 (-1) | 1,516 (+0%) | 2mo | $251,001 | $166 | 62 |
| 6018 Baldwin Ave | 0.71mi | 3/1.0 | 1,502 (-0%) | 2mo | $176,000 | $117 | 61 |
| 7640 Holdrege St | 0.71mi | 3/2.0 | 1,386 (-8%) | 3mo | $245,000 | $177 | 51 |
| 1930 N 62nd St | 0.65mi | 3/2.0 | 1,346 (-11%) | 1mo | $277,000 | $206 | 51 |
| 3015 Strauss Ct | 0.66mi | 4/2.0 (+1) | 1,628 (+8%) | 2mo | $279,000 | $171 | 49 |
| 1922 Donald St | 0.60mi | 3/1.0 | 1,309 (-13%) | 2mo | $225,000 | $172 | 45 |
Match score weights: distance 35% · size 25% · config 20% · recency 20%. Top-matched comps best support the ARV.
Projected returns pro-forma
-3.0% appreciation · 2.37% rent growth · sell at horizon
- IRR
- -15.6%
- Equity multiple
- 0.45×
- Total profit
- $-33,809
- Equity at exit
- $32,654
- IRR
- -8.2%
- Equity multiple
- 0.50×
- Total profit
- $-30,615
- Equity at exit
- $18,935
Cash invested: $61,320 (down + closing). Projections, not guarantees.
Landlord ↔ Tenant lean methodology
- Overall (STATE)
- 83 Strongly Landlord-Friendly
- State Nebraska
- 83 Strongly Landlord-Friendly · R+13
- County
- — inherits STATE
- City
- — inherits STATE
ZIP-level market 68507
- Rents YoY
- 2.4%
- Active inventory
- 100
- Price-to-rent
- 9.5×
Monthly cashflow live
- Estimated rent
- $1,922 high interval (Pro) →
- Mortgage (P&I)
- −$1,148
- Tax from tax record
- −$233 /mo · $2,800/yr
- Insurance
- −$91
- HOA
- −$0
- Vacancy / Maint / Mgmt
- −$404
- Net cashflow
- $45
Break-even live
UW: 25.0% down · 7.5% · 30yr · 1.5% tax · 5.0% vac · 8.0% maint · 8.0% mgmt
Financing live
Cash to close
- Down payment
- $54,750
- Closing costs
- $6,570
- Reserves months
- —
- Total cash needed
- —
Loan-product check · same deal, 3 products live
Conventional
25% down · 7.5% · 30yr
- Down + closing
- —
- Monthly P&I
- —
- Monthly cashflow
- —
- DSCR
- —
- Eligible?
- —
Personal DTI + credit; lowest rate.
DSCR
20% down · 8.5% · 30yr
- Down + closing
- —
- Monthly P&I
- —
- Monthly cashflow
- —
- DSCR
- —
- Eligible?
- —
No personal income docs; deal must DSCR.
Hard money
10% down · 12.0% · 12mo
- Down + closing
- —
- Monthly P&I
- —
- Monthly cashflow
- —
- DSCR
- —
- Eligible?
- —
Short-term bridge; refi at stabilization.
Rent comps 8 comps
| Address | Beds | Baths | Sqft | Rent | $/sqft | DOM | Units | Dist |
|---|---|---|---|---|---|---|---|---|
| 2840 N Cotner Blvd Unit 1 Lincoln, NE | 3.0 | 1.0 | 1450 | $1,425 | $0.98 | 43d | 1 | 0.44mi |
| 2210 Mirwyn Ct Lincoln, NE | 3.0 | 3.0 | 1748 | $2,000 | $1.14 | 13d | 1 | 0.55mi |
| 2228 Mirwyn Ct Lincoln, NE | 3.0 | 3.0 | 1748 | $2,200 | $1.26 | 43d | 1 | 0.55mi |
| 1648 Sawyer St Lincoln, NE | 3.0 | 2.5 | 1547 | $1,899 | $1.23 | 43d | 1 | 0.93mi |
| 1025 N 63rd St Lincoln, NE | 1.0–3.0 | 1.0–2.0 | 1157 | $1,590 | $1.37 | 13d | 7 | 1.08mi |
| 8229 Northwoods Dr Lincoln, NE | 1.0–2.0 | 1.0–2.0 | 935 | $1,649 | $1.76 | 3d | 5 | 1.12mi |
| 8600 Leighton Ave Lincoln, NE | 1.0–3.0 | 1.0–2.0 | 1144 | $1,300 | $1.14 | 1d | 1 | 1.13mi |
| 8430 Fremont St Lincoln, NE | 1.0–3.0 | 1.0–2.0 | 1050 | $2,380 | $2.27 | 1d | 22 | 1.47mi |
Listing history 6 events
-
2026-05-04status Pending 197-char remark
-
2026-05-01$219,000 New 197-char remark
-
2016-03-30soldstatus $90,000 23-char remark
Show marketing remark (23 chars)
Pre sold for stats only
-
2016-02-24$90,000 23-char remark
Show marketing remark (23 chars)
Pre sold for stats only
-
2016-02-24historical 23-char remark
Show marketing remark (23 chars)
Pre sold for stats only
-
2008-07-14soldstatus $115,000
ⓘ Source: listings_history table (triggers on properties + properties_extension) + one-shot
backfill from property_details.listing_events for pre-trigger history.
Tax reassessment forecast NE · Resets to sale price
- Current annual tax
- $2,800 · $233/mo
- Projected year-2 tax
- $3,789 · $316/mo
- Expected delta
- +$989/yr (+$82/mo · 35.3%)
ⓘ Screening estimate from a state-policy table — verify with the county assessor before closing.
Climate risk First Street
- Flood 1/10 Low FEMA zone X (unshaded) · 0% chance over 30 yrs
- Wildfire 1/10 Low
- Heat 3/10 Moderate 7 d/yr ≥104°F today · 16 d/yr by 30 yrs out
- Wind 2/10 Low
- Air quality 1/10 Low 0 unhealthy d/yr today · 0 by 30 yrs out
Nearby sold comps map
Loading sold comps map…
Walkable amenities ~0.75 mi
Loading nearby amenities…
Taxation est. · year 1
- Rental income
- $23,063
- − Mortgage interest
- −$12,267
- − Property taxes
- −$2,800
- − Insurance
- −$1,095
- − Repairs & maintenance
- −$1,845
- − Management
- −$1,845
- − Depreciation
- −$6,371
- Taxable loss
- −$3,160
- Est. tax savings @ 24.0%
- +$758
- After-tax cash flow
- $1,302/yr
For passive investors: Depreciation is non-cash, so a rental often shows a tax loss while cash-flowing — sheltering income. Rental losses are passive: they offset passive income freely, and up to $25,000/yr can offset ordinary (W-2) income if you actively participate and your MAGI is under $100k (phasing out to $0 by $150k); unused losses carry forward. On sale, claimed depreciation is recaptured at up to 25%, and gains may owe capital-gains tax (a 1031 exchange can defer both). Figures are a year-1 estimate at your 24.0% rate — not tax advice; consult a CPA.
Schools (NCES district)
- District
- Lincoln Public Schools
- NCES district ID
- 3172840
- Math proficiency
- 50% ▼ -6.00%
- Reading proficiency
- 53% ▼ -3.00%
- Median HH income
- $50,273
- Composite
- 44.05/100
- National rank
- #2880
- State rank
- #59 of 111 in NE
Livability — Lincoln
- Score
- 85/100
- State rank
- #5
- US rank
- #545
Category grades
Schools grade is shown separately in the Schools card above.
Census & demographics
- Census place
- Lincoln, NE
- County
- Lancaster County · 291,509 people
- City population
- 291,509
- Metro
- Lincoln, NE
- Population (ZIP)
- 16,029
- Household income
- $69,488
- Rent vs Own
- Severe rent burden
- 557.0
Population outlook (Lancaster County) Hauer SSP2
- Today (2025)
- 352,806 people
- By 2030
- 377,899 · +7.1%
- By 2040
- 428,582 · +21.5%
- By 2050
- 483,103 · +36.9%
- By 2075
- 632,390 · +79.2%
- By 2100
- 759,513 · +115.3%
Race, ethnicity, and origin ACS 2023
- Neighborhood character
- Predominantly White (82%)
- Race & ethnicity
- White 82% Two or more races 10% Hispanic / Latino 9% Black 2% Asian 1%
- Hispanic origin (detail)
- Mexican 7%
- Common ancestry
- Italian 2% Romanian 2% Lithuanian 2%
- Foreign-born
- 4% · Canada, China, Vietnam
- Languages at home
- 94% English-only · Spanish 4% Vietnamese 1% Arabic 1%
Political lean MEDSL · Lancaster
- 2024 margin
- Toss-up / Even · D 51.4% · R 47.1% · Other 1.5%
- 2008→2024 swing
- -0.7pp no change · 2008: 5.0pp · 2024: 4.3pp
- All cycles
- 2024: D+4.3 2020: D+7.8 2016: D+0.1 2012: R+1.0 2008: D+5.0
Not yet ingested
- Civics
- —
Market trends
- HPI YoY
- ▼ -273.66%
- Current HPI
- 234.3628
- Rent YoY
- ▲ 2.37%
- Metro
- Lincoln, NE
- State GDP YoY
- ▲ 0.68%
- F500 in state
- 2
Industry mix (Fortune 500 HQ in NE)
| Industry | F500 HQs | Revenue |
|---|---|---|
| Conglomerate | 1 | $371B |
|
||
Price history
+94.8% since first listed7 events — show timeline
- 2026-06-04 Sold (MLS) $224,000 GPRMLS
- 2026-05-04 Pending — GPRMLS
- 2026-05-01 Listed $219,000 GPRMLS
- 2016-03-30 Sold (MLS) $90,000 GPRMLS
- 2016-02-24 Listing Removed — GPRMLS
- 2016-02-24 Listed $90,000 GPRMLS
- 2008-07-14 Sold (Public Records) $115,000 Public Records
Property tax history
+3.1%/yrLatest (2025): $2,800 · -1.1% YoY. Source: county tax records.
Cash-flow waterfall
monthlySold comps — $/sqft
last 12 mo · ≤1 miLoading sold comps…