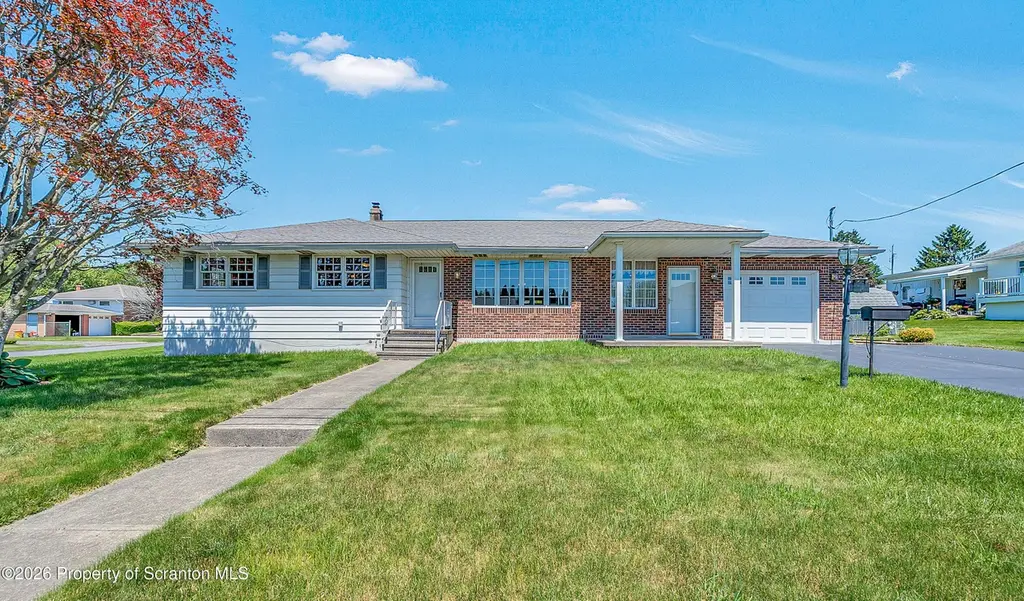
102 Bichler Ln · Taylor, PA
Flood risk 1/10 · Minimal
- FEMA flood zone
- X (unshaded)
- Chance of flooding over 30 yrs
- 0.0%
- Est. flood insurance / yr
- $473 – $860
Fire risk 3/10 · Minor
- Est. fire insurance / yr
- $511 – $949
Heat risk 3/10 · Minor
- Hot days now (above 96°F)
- 7 days/yr
- Hot days in 30 yrs
- 15 days/yr
Wind risk 3/10 · Minor
- Chance of severe wind over 30 yrs
- 4.0%
Air-quality risk 2/10 · Minimal
- Unhealthy air days now
- 0 days/yr
- Unhealthy air days in 30 yrs
- 1 days/yr
Risk factors via First Street. Map © Google.
Why this score? — see what drove the C- grade
The composite is a weighted blend of 9 inputs, each scored 0–100. Each bar is that input's sub-score; the figure is the points it added to the 100-point composite (weight × sub-score).
- Cash flow +22.2/30.0
- DSCR +7.1/10.0
- 1% rule +5.8/10.0
- Condition / age +3.8/5.0
- Livability +3.7/5.0
- Schools +3.5/10.0
- Rent growth +2.5/5.0
- ARV discount +2.0/15.0
- Appreciation +0.0/10.0
$338,000
🖨 Deal sheet (PDF) 📄 Offer letter ✓ Due diligence
Listing remarks
Meticulously maintained and move-in ready, this charming brick-front ranch is nestled in a quiet, desirable Taylor neighborhood and offers 1,515 sq. ft. of comfortable living space plus a beautifully finished lower level. The main level features 3 bedrooms, an updated full bath, gleaming hardwood floors, and a beautifully renovated kitchen complete with granite countertops, stylish backsplash, center island, and quality cabinetry. Meticulously maintained and move-in ready, this charming brick-front ranch is nestled in a quiet, desirable Taylor neighborhood and offers 1,515 sq. ft. of comfortable living space plus a beautifully finished lower level. The main level features 3 bedrooms, an upd
Key facts
- Brick front ranch
- Renovated kitchen
- Custom cedar closets
Tags
Property features AI
Exterior
- Parking: Garage (1 car)
- Utilities: Public water; Public sewer; Electricity connected (200+ amp service); Natural gas connected
- Home design: Single family residence; Residential property; Corner lot
- Construction: Built in 1970; Asphalt and brick construction; Concrete perimeter foundation
- Exterior features: Private yard; Back yard fencing; Chain link fence; Shingle roof
Interior
- Kitchen: Electric cooktop; Granite counters
- Bedrooms: 3 bedrooms
- Flooring: Hardwood; Vinyl; Tile
- Bathrooms: 2 full bathrooms
- Heating & cooling: Baseboard heating; Central air conditioning
- Interior features: Bar; Storage; Granite counters; Cedar closets; Fireplace(s); Crawl opening attic access; Partially finished basement
- Laundry & utility: Washer; Dryer; Utility room
Neighborhood map
What this means for you Summary
Snapshot
- This is a 3-bed/2.0-bath single-family listed at $338k. Condition is rated good.
Deal economics
- At list price, monthly cash flow is $548 ($7k/yr) — positive.
- The deal already cash-flows at list — no discount required.
- Meets the 1% rule at list price ($4k rent vs $338k).
- Recommended offer: $333k (1.5% below list) — sets the bar for market timing.
- Cap rate 8.2% vs local median 4.2% in Taylor — top-decile yield for the area; either an underpriced asset or a hidden risk that comps aren't pricing in. Stress-test before assuming the spread holds.
Location & tenants
- Location reads 74/100 on livability (#503 in PA, #4,605 nationally) — a middle-class / working-renter tenant base. Strengths: cost of living A+, housing A+, health & safety A+; Watch: amenities F, commute F.
- Riverside SD (suburban): math 30% / reading 53% proficiency, ranked #340 of 539 in PA (top 63%) — families likely to look elsewhere, expect single-tenant / working-renter base with shorter leases.
- Zoned schools: Riverside El Sch West (370 students, 100% FRL); Riverside Jshs (math 34% / reading 52%, grade F, #222 of 437 statewide, top 51%, 725 students, 92% FRL) — zoned schools average 96% FRL vs 42% district-wide (55 pts higher); higher-poverty schools than district average — tighter screening recommended.
- Market conditions: 24 active listings in the ZIP; 1 comparable units currently listed for rent nearby; 251 units permitted in Lackawanna County in 2024 (0 in 5+ unit buildings).
Forward outlook
- Local home prices are declining (-3.0%/yr); year-one equity from $2k of loan paydown is wiped out by about $10k of value loss. Plan a longer hold.
- Lackawanna County population projected to shrink 4% by 2050 — rents likely to lag national; underwrite the cash flow, not the appreciation.
Negotiation context
- It's been on market 15 days — a 2% lower offer ($333k) is reasonable based on typical stale-listing flexibility.
Questions for the listing agent
- Built in 1970 — when were the roof, HVAC, electrical panel, plumbing, and water heater last replaced?
- Is there a deadline driving the sale (1031 exchange, divorce, estate, relocation)? That informs how much negotiation room exists.
- What's the average days-on-market for RENTAL listings here right now (not sales)? A rising rental-DOM trend means longer vacancies and softer asking-rent achievability than the comps imply.
- What's the recent tenant-quality profile in this submarket — average credit score on applications, eviction rate, late-payment / NSF rate, and stable-employment percentage? A property-management company in the area should have these aggregated.
- How much new for-sale + rental construction is in the pipeline within 1–3 miles? Heavy new supply typically softens prices + rents 12–24 months out; constrained supply supports both.
Investment metrics
- 1% rule
- 1.08% ✓
- Cap rate
- 8.24%
- Cash-on-cash
- 6.94%
- DSCR
- 1.31
- GRM
- 7.7
CMA / ARV
- ARV (on-the-fly)
- $301,428
- Comps found
- 2
Show comp detail 2 sales within ~0.75 mi
| Address | Dist | Beds/Ba | Sqft | Sold | Price | $/sf | Match |
|---|---|---|---|---|---|---|---|
| 737 Oak St | 0.42mi | 4/2.0 (+1) | 2,596 (-7%) | 9mo | $280,000 | $108 | 56 |
| 103 Donny Dr | 0.14mi | 2/2.0 (-1) | 2,408 (-14%) | 24mo | $257,000 | $107 | 46 |
Match score weights: distance 35% · size 25% · config 20% · recency 20%. Top-matched comps best support the ARV.
Projected returns pro-forma
-3.0% appreciation · 3.0% rent growth · sell at horizon
- IRR
- -5.6%
- Equity multiple
- 0.79×
- Total profit
- $-19,835
- Equity at exit
- $50,397
- IRR
- 4.0%
- Equity multiple
- 1.29×
- Total profit
- $27,866
- Equity at exit
- $29,224
Cash invested: $94,640 (down + closing). Projections, not guarantees.
Landlord ↔ Tenant lean methodology
- Overall (STATE)
- 62 Landlord-Friendly
- State Pennsylvania
- 62 Landlord-Friendly · EVEN
- County
- — inherits STATE
- City
- — inherits STATE
ZIP-level market 18517
- Home prices YoY
- -16.2%
- Active inventory
- 24
- Price-to-rent
- 7.7×
Monthly cashflow live
- Estimated rent
- $3,650 medium interval (Pro) →
- Mortgage (P&I)
- −$1,773
- Tax est. 1.5%
- −$422 /mo · $5,070/yr
- Insurance
- −$141
- HOA
- −$0
- Vacancy / Maint / Mgmt
- −$766
- Net cashflow
- $548
Break-even live
Sensitivity live
| Price | -10% $781 | -5% $664 | +0% $548 | +5% $431 | +10% $314 |
|---|---|---|---|---|---|
| Rent | -10% $259 | -5% $403 | +0% $548 | +5% $692 | +10% $836 |
| Rate | -1.0pp $718 | -0.5pp $634 | base $548 | +0.5pp $460 | +1.0pp $371 |
UW: 25.0% down · 7.5% · 30yr · 1.5% tax · 5.0% vac · 8.0% maint · 8.0% mgmt
Financing live
Cash to close
- Down payment
- $84,500
- Closing costs
- $10,140
- Reserves months
- —
- Total cash needed
- —
Loan-product check · same deal, 3 products live
Conventional
25% down · 7.5% · 30yr
- Down + closing
- —
- Monthly P&I
- —
- Monthly cashflow
- —
- DSCR
- —
- Eligible?
- —
Personal DTI + credit; lowest rate.
DSCR
20% down · 8.5% · 30yr
- Down + closing
- —
- Monthly P&I
- —
- Monthly cashflow
- —
- DSCR
- —
- Eligible?
- —
No personal income docs; deal must DSCR.
Hard money
10% down · 12.0% · 12mo
- Down + closing
- —
- Monthly P&I
- —
- Monthly cashflow
- —
- DSCR
- —
- Eligible?
- —
Short-term bridge; refi at stabilization.
Rent comps 1 comps
| Address | Beds | Baths | Sqft | Rent | $/sqft | DOM | Units | Dist |
|---|---|---|---|---|---|---|---|---|
| 406 Roanoke Ln Scranton, PA | 4.0 | 2.5 | 2068 | $3,650 | $1.76 | 15d | 1 | 1.47mi |
Listing history 12 events
-
2026-06-21days on market $338,000 Active 15 DOM
-
2026-06-18days on market $338,000 Active 12 DOM
-
2026-06-17days on market $338,000 Active 11 DOM
-
2026-06-16days on market $338,000 Active 10 DOM
-
2026-06-15days on market $338,000 Active 9 DOM
-
2026-06-14days on market $338,000 Active 7 DOM
-
2026-06-13days on market $338,000 Active 6 DOM
-
2026-06-10days on market $338,000 Active 4 DOM
-
2026-06-09days on market $338,000 Active 3 DOM
-
2026-06-08days on market $338,000 Active 2 DOM
-
2026-06-07remarks 699-char remark
-
2026-06-07$338,000 Active 1 DOM
ⓘ Source: listings_history table (triggers on properties + properties_extension) + one-shot
backfill from property_details.listing_events for pre-trigger history.
Climate risk First Street
- Flood 1/10 Low FEMA zone X (unshaded) · 0% chance over 30 yrs
- Wildfire 3/10 Moderate
- Heat 3/10 Moderate 7 d/yr ≥96°F today · 15 d/yr by 30 yrs out
- Wind 3/10 Moderate 4% chance of damaging wind over 30 yrs
- Air quality 2/10 Low 0 unhealthy d/yr today · 1 by 30 yrs out
Nearby sold comps map
Loading sold comps map…
Walkable amenities ~0.75 mi
Loading nearby amenities…
Taxation est. · year 1
- Rental income
- $43,800
- − Mortgage interest
- −$18,933
- − Property taxes
- −$5,070
- − Insurance
- −$1,690
- − Repairs & maintenance
- −$3,504
- − Management
- −$3,504
- − Depreciation
- −$9,833
- Taxable income
- $1,266
- Est. tax owed @ 24.0%
- −$304
- After-tax cash flow
- $6,268/yr
For passive investors: Depreciation is non-cash, so a rental often shows a tax loss while cash-flowing — sheltering income. Rental losses are passive: they offset passive income freely, and up to $25,000/yr can offset ordinary (W-2) income if you actively participate and your MAGI is under $100k (phasing out to $0 by $150k); unused losses carry forward. On sale, claimed depreciation is recaptured at up to 25%, and gains may owe capital-gains tax (a 1031 exchange can defer both). Figures are a year-1 estimate at your 24.0% rate — not tax advice; consult a CPA.
Condition & rehab AI · 13 photos
This charming brick-front ranch is move-in ready with updated kitchen and bath, good condition roof and exterior, and good interior walls and flooring. Fresh paint and trimming the landscaping can further enhance its curb appeal and value.
Value-add opportunities
- Resale paint exterior — Fresh paint can enhance curb appeal and home value
- Resale trim landscaping — Well-maintained landscaping can improve curb appeal and home value
Renovation cost estimate screening
Value-add ROI direction
- Resale paint exterior — Fresh paint can enhance curb appeal and home value ↑
- Resale trim landscaping — Well-maintained landscaping can improve curb appeal and home value ↑
ⓘ Cost ranges are severity-bucket heuristics (US national rule-of-thumb). Get contractor quotes + a written scope before underwriting a rehab budget.
Schools (NCES district)
- District
- Riverside SD
- NCES district ID
- 4223250
- Math proficiency
- 30% ▼ -7.00%
- Reading proficiency
- 53% ▼ -7.00%
- Median HH income
- $44,118
- Composite
- 35.09/100
- National rank
- #5022
- State rank
- #340 of 539 in PA
Livability — Taylor
- Score
- 74/100
- State rank
- #503
- US rank
- #4605
Category grades
Schools grade is shown separately in the Schools card above.
Census & demographics
- Census place
- Taylor, PA
- City population
- 5,192
- Population (ZIP)
- 5,192
Population outlook (Lackawanna County) Hauer SSP2
- Today (2025)
- 210,652 people
- By 2030
- 208,623 · -1.0%
- By 2040
- 203,980 · -3.2%
- By 2050
- 201,069 · -4.5%
- By 2075
- 205,026 · -2.7%
- By 2100
- 210,851 · +0.1%
Race, ethnicity, and origin ACS 2023
- Neighborhood character
- Predominantly White (78%)
- Race & ethnicity
- White 78% Hispanic / Latino 14% Two or more races 8% Black 3% Asian 2%
- Hispanic origin (detail)
- Puerto Rican 7% Dominican 5%
- Common ancestry
- Romanian 20% Subsaharan African 3% Italian 2%
- Foreign-born
- 3% · Canada
- Languages at home
- 91% English-only · Spanish 6% Other Asian/Pacific 2% Other Indo-European 1%
Political lean MEDSL · Lackawanna
- 2024 margin
- Toss-up / Even · D 51.0% · R 48.3%
- 2008→2024 swing
- -23.2pp toward R · 2008: 26.0pp · 2024: 2.8pp
- All cycles
- 2024: D+2.8 2020: D+8.4 2016: D+3.4 2012: D+27.4 2008: D+26.0
Not yet ingested
- Civics
- —
Market trends
- HPI YoY
- ▼ -36.05%
- Current HPI
- 186.5628
- Rent YoY
- —
- Metro
- —
- State GDP YoY
- ▲ 1.68%
- F500 in state
- 34
Industry mix (Fortune 500 HQ in PA)
| Industry | F500 HQs | Revenue |
|---|---|---|
| Healthcare | 2 | $309B |
|
||
| Insurance | 2 | $27B |
|
||
| Telecommunications / Media | 1 | $124B |
|
||
| Industrial Distribution | 1 | $22B |
|
||
| Financial Services | 1 | $20B |
|
||
| Chemicals / Materials | 1 | $18B |
|
||
Price history
1 event — show timeline
- 2026-06-06 Listed $338,000 GSBR as distributed by MLS GRID
Cash-flow waterfall
monthlySold comps — $/sqft
last 12 mo · ≤1 miLoading sold comps…