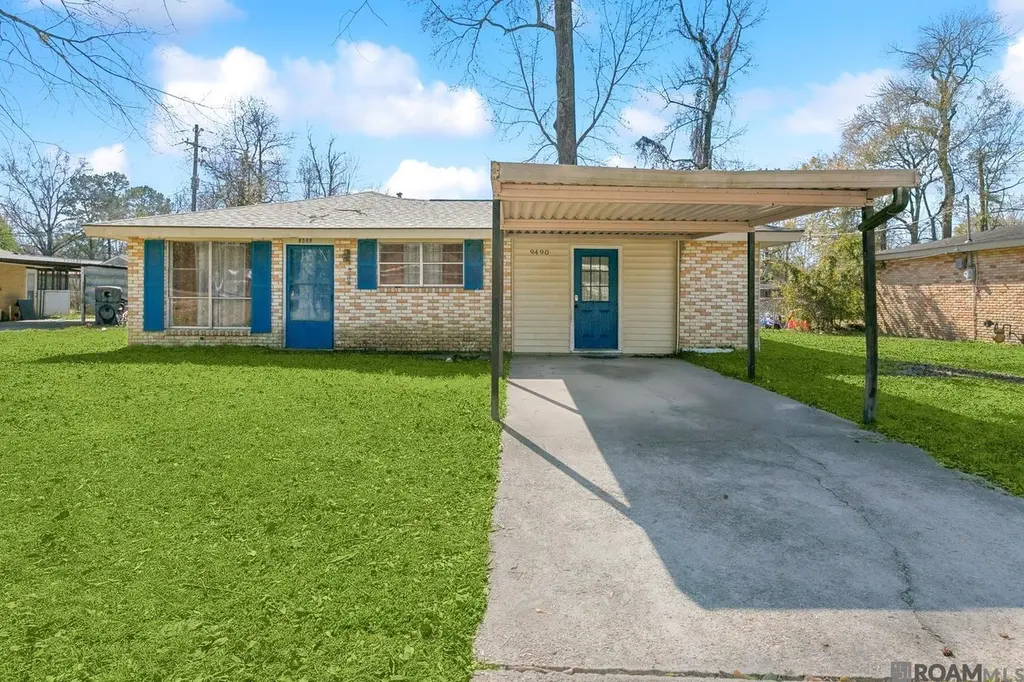
9490 Dabney Dr · Denham Springs, LA
Flood risk 3/10 · Minor
- FEMA flood zone
- A
- Chance of flooding over 30 yrs
- 0.2%
- Est. flood insurance / yr
- $1,009 – $1,996
Fire risk 1/10 · Minimal
- Est. fire insurance / yr
- $1,269 – $2,357
Heat risk 8/10 · Major
- Hot days now (above 108°F)
- 7 days/yr
- Hot days in 30 yrs
- 21 days/yr
Wind risk 9/10 · Severe
- Chance of severe wind over 30 yrs
- 99.0%
Air-quality risk 3/10 · Minor
- Unhealthy air days now
- 3 days/yr
- Unhealthy air days in 30 yrs
- 3 days/yr
Risk factors via First Street. Map © Google.
Why this score? — see what drove the C grade
The composite is a weighted blend of 9 inputs, each scored 0–100. Each bar is that input's sub-score; the figure is the points it added to the 100-point composite (weight × sub-score).
- Cash flow +21.8/30.0
- ARV discount +12.6/15.0
- DSCR +7.0/10.0
- 1% rule +4.9/10.0
- Schools +4.0/10.0
- Livability +3.7/5.0
- Rent growth +3.5/5.0
- Condition / age +2.5/5.0
- Appreciation +0.0/10.0
$152,000
🖨 Deal sheet 📄 Offer letter ✓ Due diligence
Listing remarks MLS
This charming three bedroom, 1.5 bath home offers 1,242 sqft of comfortable living space with no carpet throughout. The home features a versatile bonus room, ideal for a den, playroom, home office, or additional living area. The primary bedroom includes a convenient half bath for added comfort. Enjoy a large backyard with patio space, perfect for BBQs, entertaining or relaxing outdoors. This home offers a functional layout and a great opportunity to personalize and make it your own. Additional peace of mind comes with a roof that is approximately 7 years old. A wonderful option for first-time homebuyers or investors seeking space, flexibility, and value. Schedule your showing today!
Key facts
- Large backyard
- Bonus room
- Patio space
Tags
Neighborhood map
What this means for you Summary
Snapshot
- This is a 3-bed/1.5-bath single-family listed at $152k.
Deal economics
- At list price, monthly cash flow is $110 ($1k/yr) — positive.
- The deal already cash-flows at list — no discount required.
- To meet the 1% rule (rent ≥ 1% of price), the offer needs to be $151k (0.7% below list).
- Recommended offer: $143k (6.0% below list) — sets the bar for market timing.
- Cap rate 8.2% vs local median 3.9% in Denham Springs — top-decile yield for the area; either an underpriced asset or a hidden risk that comps aren't pricing in. Stress-test before assuming the spread holds.
Location & tenants
- Location reads 74/100 on livability (#29 in LA, #4,939 nationally) — a middle-class / working-renter tenant base. Strengths: cost of living A+, housing A+, health & safety A+; Watch: crime C-, amenities F, commute F.
- Livingston Parish (suburban): math 40% / reading 52% proficiency, ranked #13 of 98 in LA (top 13%) — families likely to look elsewhere, expect single-tenant / working-renter base with shorter leases.
- Market conditions: Rents rising (+3.8%/yr); 976 active listings in the ZIP; 3 comparable units currently listed for rent nearby; rentals lingering (median 44d on market — plan ~5-8 weeks vacancy on turnover, expect pricing pressure); 67% of comp listings sitting > 30 days — soft ceiling on asking rent; solid renter incomes; 794 units permitted in Livingston Parish in 2024 (99 in 5+ unit buildings).
Forward outlook
- Local home prices are declining (-3.0%/yr); year-one equity from $1k of loan paydown is wiped out by about $5k of value loss. Plan a longer hold.
- Livingston County population projected at +27% by 2050 — long-run rental-demand tailwind backs the buy-and-hold thesis.
Negotiation context
- It's been on market 89 days — a 6% lower offer ($143k) is reasonable based on typical stale-listing flexibility.
- 12 sale attempts since 19y ago with the ask held roughly flat each time — persistent listings suggest the price (not the market) is what's stuck; bring a comps-based counter.
- Current owner paid $120k; 27% above their basis — modest negotiation headroom, anchor on the comps not their cost.
Risks & watch-outs
- Watch-outs: flood insurance adds $125/mo.
- Climate carrying-cost: in FEMA flood zone A (mandatory federal flood insurance); severe wind risk, 99% chance of damaging wind over 30y; extreme-heat days projected 7→21/yr by 2055 (HVAC capex compounding) — expect insurance premiums to compound above CPI over the hold.
Questions for the listing agent
- It's been on market 89 days. Have you received any prior offers? Is the seller open to a 6% concession, seller financing, or rate buy-down credit?
- What's the actual annual flood-insurance premium (NFIP or private), and is the property in a SFHA with mandatory coverage?
- Why hasn't it sold? Are there any deal-killer items the seller is aware of (foundation, flood, title, zoning, code violations)?
- Is there a deadline driving the sale (1031 exchange, divorce, estate, relocation)? That informs how much negotiation room exists.
- Schools are B-rated — typically a magnet for longer-tenancy family renters. What's the average tenant stay here, and is there a school-zone premium baked into asking?
- What's the average days-on-market for RENTAL listings here right now (not sales)? A rising rental-DOM trend means longer vacancies and softer asking-rent achievability than the comps imply.
- What's the recent tenant-quality profile in this submarket — average credit score on applications, eviction rate, late-payment / NSF rate, and stable-employment percentage? A property-management company in the area should have these aggregated.
- How much new for-sale + rental construction is in the pipeline within 1–3 miles? Heavy new supply typically softens prices + rents 12–24 months out; constrained supply supports both.
Investment metrics
- 1% rule
- 0.99% ✗
- Cap rate
- 8.15%
- Cash-on-cash
- 6.65%
- DSCR
- 1.30
- GRM
- 8.4
CMA / ARV
- ARV (median comp)
- $171,625
- List price
- $152,000
- Delta
- -11.43%
- Verdict
- UNDERPRICED
- Comps
- 20 within 1.0 mi
Show comp detail 12 sales within ~0.75 mi
| Address | Dist | Beds/Ba | Sqft | Sold | Price | $/sf | Match |
|---|---|---|---|---|---|---|---|
| 30970 Carriage Way | 0.11mi | 3/2.0 | 1,346 (+8%) | 6mo | $225,000 | $167 | 74 |
| 9312 Watson Dr | 0.21mi | 3/1.5 | 1,100 (-11%) | 3mo | $80,000 | $73 | 69 |
| 9169 Jordan Dr | 0.26mi | 3/2.0 | 1,417 (+14%) | 3mo | $237,000 | $167 | 60 |
| 9210 Dabney Dr | 0.27mi | 3/1.0 | 1,092 (-12%) | 7mo | $116,000 | $106 | 59 |
| 30730 Dunn Rd | 0.74mi | 3/2.0 | 1,221 (-2%) | 4mo | $244,900 | $201 | 58 |
| 1503 Weeping Willow Dr | 0.39mi | 3/2.0 | 1,418 (+14%) | 1mo | $239,900 | $169 | 56 |
| 9156 Drew Dr | 0.31mi | 3/2.0 | 1,417 (+14%) | 5mo | $224,900 | $159 | 56 |
| 30675 Eden Way Dr | 0.37mi | 3/2.0 | 1,424 (+15%) | 3mo | $241,375 | $170 | 54 |
| 30800 Eden Way Dr | 0.37mi | 3/2.0 | 1,424 (+15%) | 6mo | $243,245 | $171 | 51 |
| 9130 Mason Dr | 0.42mi | 3/2.0 | 1,400 (+13%) | 7mo | $184,900 | $132 | 51 |
| 30377 Fairway View Dr | 0.50mi | 3/2.0 | 1,426 (+15%) | 2mo | $230,000 | $161 | 49 |
| 30678 Anderson Dr | 0.72mi | 3/2.0 | 1,089 (-12%) | 1mo | $172,500 | $158 | 43 |
Match score weights: distance 35% · size 25% · config 20% · recency 20%. Top-matched comps best support the ARV.
Projected returns pro-forma
-3.0% appreciation · 3.83% rent growth · sell at horizon
- IRR
- -10.4%
- Equity multiple
- 0.62×
- Total profit
- $-16,281
- Equity at exit
- $22,664
- IRR
- 0.1%
- Equity multiple
- 1.01×
- Total profit
- $359
- Equity at exit
- $13,142
Cash invested: $42,560 (down + closing). Projections, not guarantees.
Landlord ↔ Tenant lean methodology
- Overall (STATE)
- 90 Strongly Landlord-Friendly
- State Louisiana
- 90 Strongly Landlord-Friendly · R+12
- County
- — inherits STATE
- City
- — inherits STATE
ZIP-level market 70726
- Rents YoY
- 3.8%
- Active inventory
- 976
- Price-to-rent
- 8.4×
Monthly cashflow live
- Estimated rent
- $1,510 medium interval (Pro) →
- Mortgage (P&I)
- −$797
- Tax from tax record
- −$96 /mo · $1,157/yr
- Insurance
- −$63
- Flood insurance flood zone
- −$125 /mo · $1,502/yr
- HOA
- −$0
- Vacancy / Maint / Mgmt
- −$317
- Net cashflow
- $110
Break-even live
UW: 25.0% down · 7.5% · 30yr · 1.5% tax · 5.0% vac · 8.0% maint · 8.0% mgmt
Financing live
Cash to close
- Down payment
- $38,000
- Closing costs
- $4,560
- Reserves months
- —
- Total cash needed
- —
Loan-product check · same deal, 3 products live
Conventional
25% down · 7.5% · 30yr
- Down + closing
- —
- Monthly P&I
- —
- Monthly cashflow
- —
- DSCR
- —
- Eligible?
- —
Personal DTI + credit; lowest rate.
DSCR
20% down · 8.5% · 30yr
- Down + closing
- —
- Monthly P&I
- —
- Monthly cashflow
- —
- DSCR
- —
- Eligible?
- —
No personal income docs; deal must DSCR.
Hard money
10% down · 12.0% · 12mo
- Down + closing
- —
- Monthly P&I
- —
- Monthly cashflow
- —
- DSCR
- —
- Eligible?
- —
Short-term bridge; refi at stabilization.
Rent comps 3 comps
| Address | Beds | Baths | Sqft | Rent | $/sqft | DOM | Units | Dist |
|---|---|---|---|---|---|---|---|---|
| 9418 Randall Ave Denham Springs, LA | 3.0 | 1.5 | 1234 | $1,250 | $1.01 | 44d | 1 | 0.10mi |
| 9062 Lockhart Rd Unit 11D Denham Springs, LA | 3.0 | 2.0 | 1240 | $1,900 | $1.53 | 23d | 1 | 0.37mi |
| 8037 Florida Blvd Denham Springs, LA | 2.0 | 1.0 | 1310 | $1,400 | $1.07 | 44d | 1 | 1.31mi |
Listing history 22 events
-
2026-05-05status Pending 691-char remark
Show marketing remark (691 chars)
This charming three bedroom, 1.5 bath home offers 1,242 sqft of comfortable living space with no carpet throughout. The home features a versatile bonus room, ideal for a den, playroom, home office, or additional living area. The primary bedroom includes a convenient half bath for added comfort. Enjoy a large backyard with patio space, perfect for BBQs, entertaining or relaxing outdoors. This home offers a functional layout and a great opportunity to personalize and make it your own. Additional peace of mind comes with a roof that is approximately 7 years old. A wonderful option for first-time homebuyers or investors seeking space, flexibility, and value. Schedule your showing today!
-
2026-02-05$152,000 Active 691-char remark
Show marketing remark (691 chars)
This charming three bedroom, 1.5 bath home offers 1,242 sqft of comfortable living space with no carpet throughout. The home features a versatile bonus room, ideal for a den, playroom, home office, or additional living area. The primary bedroom includes a convenient half bath for added comfort. Enjoy a large backyard with patio space, perfect for BBQs, entertaining or relaxing outdoors. This home offers a functional layout and a great opportunity to personalize and make it your own. Additional peace of mind comes with a roof that is approximately 7 years old. A wonderful option for first-time homebuyers or investors seeking space, flexibility, and value. Schedule your showing today!
-
2020-07-09soldstatus $119,900
-
2020-07-08soldstatus Sold
-
2020-04-28status Pending
-
2020-04-17$119,900 Active
-
2020-04-17$119,900
-
2012-05-03soldstatus $90,000
-
2012-04-30soldstatus
-
2011-10-29$92,500
-
2011-10-29$92,500
-
2011-09-21soldstatus
-
2010-11-03$47,385
-
2010-11-03$47,385
-
2010-07-16$63,000
-
2010-07-16$63,000
-
2008-04-17soldstatus
-
2008-04-15soldstatus
-
2007-11-26$109,900
-
2007-11-26$109,900
ⓘ Source: listings_history table (triggers on properties + properties_extension) + one-shot
backfill from property_details.listing_events for pre-trigger history.
Tax reassessment forecast LA · Resets to sale price
- Current annual tax
- $1,157 · $96/mo
- Projected year-2 tax
- $1,157 · $96/mo
- Expected delta
- $0/yr ($0/mo · 0.0%)
ⓘ Screening estimate from a state-policy table — verify with the county assessor before closing.
Climate risk First Street
- Flood 3/10 Moderate FEMA zone A · 20% chance over 30 yrs
- Wildfire 1/10 Low
- Heat 8/10 Severe 7 d/yr ≥108°F today · 21 d/yr by 30 yrs out
- Wind 9/10 Extreme 99% chance of damaging wind over 30 yrs
- Air quality 3/10 Moderate 3 unhealthy d/yr today · 3 by 30 yrs out
Nearby sold comps map
Loading sold comps map…
Walkable amenities ~0.75 mi
Loading nearby amenities…
Taxation est. · year 1
- Rental income
- $18,114
- − Mortgage interest
- −$8,514
- − Property taxes
- −$1,157
- − Insurance
- −$2,262
- − Repairs & maintenance
- −$1,449
- − Management
- −$1,449
- − Depreciation
- −$4,422
- Taxable loss
- −$1,139
- Est. tax savings @ 24.0%
- +$273
- After-tax cash flow
- $1,599/yr
For passive investors: Depreciation is non-cash, so a rental often shows a tax loss while cash-flowing — sheltering income. Rental losses are passive: they offset passive income freely, and up to $25,000/yr can offset ordinary (W-2) income if you actively participate and your MAGI is under $100k (phasing out to $0 by $150k); unused losses carry forward. On sale, claimed depreciation is recaptured at up to 25%, and gains may owe capital-gains tax (a 1031 exchange can defer both). Figures are a year-1 estimate at your 24.0% rate — not tax advice; consult a CPA.
Schools (NCES district)
- District
- Livingston Parish
- NCES district ID
- 2201020
- Math proficiency
- 40% ▼ -38.00%
- Reading proficiency
- 52% ▼ -32.00%
- Median HH income
- $56,755
- Composite
- 40.07/100
- National rank
- #3811
- State rank
- #13 of 98 in LA
Livability — Denham Springs
- Score
- 74/100
- State rank
- #29
- US rank
- #4939
Category grades
Schools grade is shown separately in the Schools card above.
Census & demographics
- County
- Livingston Parish · 87,496 people
- City population
- 63,575
- Metro
- Baton Rouge, LA
- Population (ZIP)
- 63,575
- Household income
- $78,621
- Rent vs Own
- Severe rent burden
- 1211.0
Population outlook (Livingston County) Hauer SSP2
- Today (2025)
- 158,511 people
- By 2030
- 168,241 · +6.1%
- By 2040
- 186,252 · +17.5%
- By 2050
- 201,516 · +27.1%
- By 2075
- 231,217 · +45.9%
- By 2100
- 241,697 · +52.5%
Race, ethnicity, and origin ACS 2023
- Neighborhood character
- Predominantly White (74%)
- Race & ethnicity
- White 74% Black 13% Hispanic / Latino 9% Two or more races 6%
- Hispanic origin (detail)
- Mexican 3%
- Common ancestry
- Lithuanian 9% Serbian 1% Italian 1%
- Foreign-born
- 6% · Canada
- Languages at home
- 91% English-only · Spanish 6% Other Indo-European 1%
Political lean MEDSL · Livingston
- 2024 margin
- Solid R (+68.5) · D 15.1% · R 83.6% · Other 1.3%
- 2008→2024 swing
- +3.4pp toward D · 2008: -71.9pp · 2024: -68.5pp
- All cycles
- 2024: R+68.5 2020: R+70.0 2016: R+72.5 2012: R+70.4 2008: R+71.9
Not yet ingested
- Civics
- —
Market trends
- HPI YoY
- ▼ -104.37%
- Current HPI
- 170.2207
- Rent YoY
- ▲ 3.83%
- Metro
- Baton Rouge, LA
- State GDP YoY
- ▲ 3.29%
- F500 in state
- 10
Industry mix (Fortune 500 HQ in LA)
| Industry | F500 HQs | Revenue |
|---|---|---|
| Telecommunications | 2 | $23B |
|
||
| Utilities | 1 | $12B |
|
||
| Wholesale / Distribution | 1 | $5B |
|
||
| Advertising | 1 | $2B |
|
||
Price history
+38.3% since first listed22 events — show timeline
- 2026-05-05 Pending — AcadianaMLS
- 2026-05-05 Pending — GBRMLS
- 2026-02-05 Listed $152,000 GBRMLS
- 2026-02-05 Listed $152,000 AcadianaMLS
- 2020-07-09 Sold (Public Records) $119,900 Public Records
- 2020-07-08 Sold (MLS) — GBRMLS
- 2020-04-28 Pending — GBRMLS
- 2020-04-17 Listed $119,900 AcadianaMLS
- 2020-04-17 Listed $119,900 GBRMLS
- 2012-05-03 Sold (Public Records) $90,000 Public Records
- 2012-04-30 Sold (MLS) — GBRMLS
- 2011-10-29 Listed $92,500 AcadianaMLS
- 2011-10-29 Listed $92,500 GBRMLS
- 2011-09-21 Sold (MLS) — GBRMLS
- 2010-11-03 Listed $47,385 AcadianaMLS
- 2010-11-03 Listed $47,385 GBRMLS
- 2010-07-16 Listed $63,000 AcadianaMLS
- 2010-07-16 Listed $63,000 GBRMLS
- 2008-04-17 Sold (Public Records) — Public Records
- 2008-04-15 Sold (MLS) — GBRMLS
- 2007-11-26 Listed $109,900 AcadianaMLS
- 2007-11-26 Listed $109,900 GBRMLS
Property tax history
-0.4%/yrLatest (2024): $1,157 · +16.2% YoY. Source: county tax records.
Cash-flow waterfall
monthlySold comps — $/sqft
last 12 mo · ≤1 miLoading sold comps…