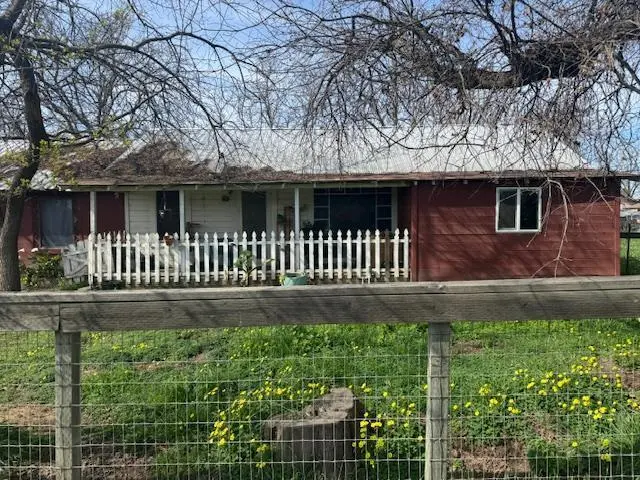
560 S Recreation Ave · Fresno, CA
Flood risk 1/10 · Minimal
- FEMA flood zone
- X (shaded)
- Chance of flooding over 30 yrs
- 0.0%
- Est. flood insurance / yr
- $507 – $1,088
Fire risk 1/10 · Minimal
- Est. fire insurance / yr
- $659 – $1,223
Heat risk 8/10 · Major
- Hot days now (above 105°F)
- 7 days/yr
- Hot days in 30 yrs
- 17 days/yr
Wind risk 1/10 · Minimal
- Chance of severe wind over 30 yrs
- —
Air-quality risk 10/10 · Severe
- Unhealthy air days now
- 42 days/yr
- Unhealthy air days in 30 yrs
- 48 days/yr
Risk factors via First Street. Map © Google.
Why this score? — see what drove the C grade
The composite is a weighted blend of 9 inputs, each scored 0–100. Each bar is that input's sub-score; the figure is the points it added to the 100-point composite (weight × sub-score).
- Cash flow +21.9/30.0
- ARV discount +15.0/15.0
- DSCR +7.0/10.0
- 1% rule +4.4/10.0
- Livability +3.1/5.0
- Schools +2.7/10.0
- Condition / age +2.5/5.0
- Rent growth +2.3/5.0
- Appreciation +0.0/10.0
$180,000
🖨 Deal sheet (PDF) 📄 Offer letter ✓ Due diligence
Listing remarks
Great investment property, seller has 2 adjacent properties that he would like to sell together with this one: 548 S. Recreation (vacant lot) and 568 S. Recreation (multifamily). Please drive by only. .do not disturb tenants. Buyer to verify all amenities on the property.
Key facts
- 0.23 acre lot
- Built 1945
Neighborhood map
What this means for you Summary
Snapshot
- This is a 3-bed/1.0-bath single-family listed at $180k.
Deal economics
- At list price, monthly cash flow is $283 ($3k/yr) — positive.
- The deal already cash-flows at list — no discount required.
- To meet the 1% rule (rent ≥ 1% of price), the offer needs to be $169k (5.9% below list).
- Recommended offer: $169k (5.9% below list) — sets the bar for 1% rule.
- Cap rate 8.2% vs local median 3.7% in Fresno — top-decile yield for the area; either an underpriced asset or a hidden risk that comps aren't pricing in. Stress-test before assuming the spread holds.
Location & tenants
- Location reads 62/100 on livability (#469 in CA) — a middle-class / working-renter tenant base. Strengths: commute A+, housing A+; Watch: amenities D+, employment D+, crime F.
- Fresno Unified (urban): math 18% / reading 47% proficiency, ranked #327 of 517 in CA (top 63%) — families likely to look elsewhere, expect single-tenant / working-renter base with shorter leases; 77% free/reduced lunch — lower-income household profile, screen leases tightly.
- Zoned schools: Mario G. Olmos Elementary (592 students, 99% FRL); Kings Canyon Middle (932 students, 96% FRL); Sunnyside High (math 13% / reading 47%, grade F, #715 of 1,170 statewide, top 62%, 2,879 students, 90% FRL) — zoned schools average 95% FRL vs 77% district-wide (18 pts higher); higher-poverty schools than district average — tighter screening recommended.
- Market conditions: Rents soft (-0.9%/yr); 66 active listings in the ZIP; 15 comparable units currently listed for rent nearby; rentals at typical pace (median 24d on market — plan ~3-4 weeks tenant-placement turnaround); 2,426 units permitted in Fresno County in 2024 (296 in 5+ unit buildings).
- This rent runs 43% of the median local income ($47k/yr) — at the standard rent-burdened threshold; future hikes will face affordability resistance.
Forward outlook
- Local home prices are declining (-3.0%/yr); year-one equity from $1k of loan paydown is wiped out by about $5k of value loss. Plan a longer hold.
- Fresno County population projected at +11% by 2050 — modest demand growth; plan on rents tracking national, not racing it.
Negotiation context
- Only 0 days on market — expect competitive offers; lowballing is unlikely to land.
Risks & watch-outs
- Watch-outs: built in 1945 — expect roof / HVAC / electrical / plumbing capex.
- Climate carrying-cost: extreme-heat days projected 7→17/yr by 2055 (HVAC capex compounding) — expect insurance premiums to compound above CPI over the hold.
Questions for the listing agent
- Built in 1945 — when were the roof, HVAC, electrical panel, plumbing, and water heater last replaced?
- Is there a deadline driving the sale (1031 exchange, divorce, estate, relocation)? That informs how much negotiation room exists.
- Schools are D-rated, which usually means shorter tenancies and higher turnover. Who's the typical renter profile here, and what's been the actual vacancy rate?
- Crime grade is F in this area — have there been break-ins, vandalism, or insurance claims at this property in the last 3 years? What carrier currently insures it and at what premium?
- What's the average days-on-market for RENTAL listings here right now (not sales)? A rising rental-DOM trend means longer vacancies and softer asking-rent achievability than the comps imply.
- What's the recent tenant-quality profile in this submarket — average credit score on applications, eviction rate, late-payment / NSF rate, and stable-employment percentage? A property-management company in the area should have these aggregated.
- How much new for-sale + rental construction is in the pipeline within 1–3 miles? Heavy new supply typically softens prices + rents 12–24 months out; constrained supply supports both.
Investment metrics
- 1% rule
- 0.94% ✗
- Cap rate
- 8.18%
- Cash-on-cash
- 6.73%
- DSCR
- 1.30
- GRM
- 8.9
CMA / ARV
- ARV (on-the-fly)
- $293,748
- Comps found
- 12
Show comp detail 12 sales within ~0.75 mi
| Address | Dist | Beds/Ba | Sqft | Sold | Price | $/sf | Match |
|---|---|---|---|---|---|---|---|
| 4752 E Kerckhoff Ave | 0.22mi | 3/1.8 | 1,116 (+2%) | 7mo | $325,000 | $291 | 77 |
| 4584 E Inyo | 0.37mi | 3/1.0 | 1,068 (-2%) | 4mo | $181,000 | $169 | 76 |
| 4731 E Laurel Ave | 0.19mi | 3/1.0 | 1,147 (+5%) | 11mo | $339,500 | $296 | 74 |
| 555 S Sierra Vista Ave | 0.10mi | 4/3.0 (+1) | 1,168 (+7%) | 10mo | $309,000 | $265 | 63 |
| 4603 E Nevada Ave | 0.67mi | 3/2.0 | 1,045 (-4%) | 2mo | $212,500 | $203 | 56 |
| 4935 E Kerckhoff Ave | 0.57mi | 3/1.8 | 1,000 (-8%) | 2mo | $338,000 | $338 | 54 |
| 4740 E Washington Ave | 0.69mi | 2/1.0 (-1) | 1,078 (-1%) | 11mo | $265,000 | $246 | 52 |
| 4946 E Fillmore Ave | 0.60mi | 4/1.0 (+1) | 1,161 (+6%) | 10mo | $340,000 | $293 | 48 |
| 4596 E Huntington Ave | 0.36mi | 2/1.2 (-1) | 952 (-13%) | 10mo | $255,000 | $268 | 48 |
| 4946 E Fillmore Ave | 0.60mi | 4/1.8 (+1) | 1,161 (+6%) | 10mo | $340,000 | $293 | 45 |
| 4864 E Nevada Ave | 0.66mi | 2/1.0 (-1) | 1,226 (+12%) | 0mo | $330,000 | $269 | 44 |
| 4655 E Illinois Ave | 0.57mi | 2/1.0 (-1) | 1,250 (+14%) | 10mo | $335,000 | $268 | 36 |
Match score weights: distance 35% · size 25% · config 20% · recency 20%. Top-matched comps best support the ARV.
Projected returns pro-forma
-3.0% appreciation · 0.0% rent growth · sell at horizon
- IRR
- -9.0%
- Equity multiple
- 0.68×
- Total profit
- $-16,224
- Equity at exit
- $26,839
- IRR
- -3.6%
- Equity multiple
- 0.79×
- Total profit
- $-10,503
- Equity at exit
- $15,563
Cash invested: $50,400 (down + closing). Projections, not guarantees.
Landlord ↔ Tenant lean methodology
- Overall (STATE)
- 18 Strongly Tenant-Friendly
- State California
- 18 Strongly Tenant-Friendly · D+13
- County
- — inherits STATE
- City
- — inherits STATE
ZIP-level market 93702
- Rents YoY
- -0.9%
- Active inventory
- 66
- Price-to-rent
- 8.9×
Monthly cashflow live
- Estimated rent
- $1,694 high interval (Pro) →
- Mortgage (P&I)
- −$944
- Tax from tax record
- −$37 /mo · $440/yr
- Insurance
- −$75
- HOA
- −$0
- Vacancy / Maint / Mgmt
- −$356
- Net cashflow
- $283
Break-even live
Sensitivity live
| Price | -10% $384 | -5% $334 | +0% $283 | +5% $232 | +10% $181 |
|---|---|---|---|---|---|
| Rent | -10% $149 | -5% $216 | +0% $283 | +5% $350 | +10% $416 |
| Rate | -1.0pp $373 | -0.5pp $328 | base $283 | +0.5pp $236 | +1.0pp $188 |
UW: 25.0% down · 7.5% · 30yr · 1.5% tax · 5.0% vac · 8.0% maint · 8.0% mgmt
Financing live
Cash to close
- Down payment
- $45,000
- Closing costs
- $5,400
- Reserves months
- —
- Total cash needed
- —
Loan-product check · same deal, 3 products live
Conventional
25% down · 7.5% · 30yr
- Down + closing
- —
- Monthly P&I
- —
- Monthly cashflow
- —
- DSCR
- —
- Eligible?
- —
Personal DTI + credit; lowest rate.
DSCR
20% down · 8.5% · 30yr
- Down + closing
- —
- Monthly P&I
- —
- Monthly cashflow
- —
- DSCR
- —
- Eligible?
- —
No personal income docs; deal must DSCR.
Hard money
10% down · 12.0% · 12mo
- Down + closing
- —
- Monthly P&I
- —
- Monthly cashflow
- —
- DSCR
- —
- Eligible?
- —
Short-term bridge; refi at stabilization.
Rent comps 15 comps
| Address | Beds | Baths | Sqft | Rent | $/sqft | DOM | Units | Dist |
|---|---|---|---|---|---|---|---|---|
| 508 S Dearing Ave Apt 101 Fresno, CA | 4.0 | 2.0 | 1375 | $2,250 | $1.64 | 46d | 1 | 0.13mi |
| 429 S Backer Ave Unit 204 Fresno, CA | 3.0 | 1.5 | 952 | $1,750 | $1.84 | 18d | 1 | 0.22mi |
| 4860 E Lane Ave Fresno, CA | 1.0–2.0 | 1.0 | 740 | $1,495 | $2.02 | 25d | 2 | 0.41mi |
| 4860 E Lane Ave Fresno, CA | 2.0 | 1.0 | 914 | $1,495 | $1.64 | 4d | 1 | 0.41mi |
| 4833 E Lane Ave #203 Fresno, CA | 2.0 | 1.0 | 934 | $850 | $0.91 | 46d | 1 | 0.41mi |
| 4845 E Lane Ave Unit 202 Fresno, CA | 2.0 | 1.0 | 812 | $1,664 | $2.05 | 46d | 1 | 0.44mi |
| 4760 E Butler Ave Fresno, CA | 2.0 | 1.0 | 980 | $1,320 | $1.35 | 0d | 8 | 0.67mi |
| 5120 E Kings Canyon Rd Fresno, CA | 1.0–2.0 | 1.0–2.0 | 813 | $1,600 | $1.97 | 0d | 1 | 1.00mi |
| 2075 S Hayston Ave Fresno, CA | 3.0 | 1.0 | 845 | $1,550 | $1.83 | 0d | 1 | 1.15mi |
| 4710 E Harvey Ave Fresno, CA | 3.0 | 1.0 | 1372 | $1,675 | $1.22 | 23d | 1 | 1.16mi |
| 4530 E Thomas Ave Apt 202 Fresno, CA | 2.0 | 1.0 | 950 | $1,250 | $1.32 | 46d | 1 | 1.19mi |
| 3655 E Lowe Ave Apt 103 Fresno, CA | 3.0 | 2.0 | 850 | $1,500 | $1.76 | 23d | 1 | 1.29mi |
| 5218 E Lowe Ave Apt 101 Fresno, CA | 2.0 | 2.0 | 900 | $1,575 | $1.75 | 3d | 1 | 1.31mi |
| 841 N Fine Ave Fresno, CA | 3.0 | 2.0 | 1478 | $2,500 | $1.69 | 46d | 1 | 1.34mi |
| 3568 E Lowe Ave Fresno, CA | 2.0 | 1.0 | 946 | $1,600 | $1.69 | 16d | 1 | 1.40mi |
Listing history 3 events
-
2026-06-03days on market $180,000 Pending
-
2026-03-31status Pending
-
2026-03-20$180,000 Active
ⓘ Source: listings_history table (triggers on properties + properties_extension) + one-shot
backfill from property_details.listing_events for pre-trigger history.
Tax reassessment forecast CA · Resets to sale price
- Current annual tax
- $440 · $37/mo
- Projected year-2 tax
- $1,368 · $114/mo
- Expected delta
- +$928/yr (+$77/mo · 210.6%)
ⓘ Screening estimate from a state-policy table — verify with the county assessor before closing.
Climate risk First Street
- Flood 1/10 Low FEMA zone X (shaded) · 0% chance over 30 yrs
- Wildfire 1/10 Low
- Heat 8/10 Severe 7 d/yr ≥105°F today · 17 d/yr by 30 yrs out
- Wind 1/10 Low
- Air quality 10/10 Extreme 42 unhealthy d/yr today · 48 by 30 yrs out
Nearby sold comps map
Loading sold comps map…
Walkable amenities ~0.75 mi
Loading nearby amenities…
Taxation est. · year 1
- Rental income
- $20,328
- − Mortgage interest
- −$10,083
- − Property taxes
- −$440
- − Insurance
- −$900
- − Repairs & maintenance
- −$1,626
- − Management
- −$1,626
- − Depreciation
- −$5,236
- Taxable income
- $416
- Est. tax owed @ 24.0%
- −$100
- After-tax cash flow
- $3,291/yr
For passive investors: Depreciation is non-cash, so a rental often shows a tax loss while cash-flowing — sheltering income. Rental losses are passive: they offset passive income freely, and up to $25,000/yr can offset ordinary (W-2) income if you actively participate and your MAGI is under $100k (phasing out to $0 by $150k); unused losses carry forward. On sale, claimed depreciation is recaptured at up to 25%, and gains may owe capital-gains tax (a 1031 exchange can defer both). Figures are a year-1 estimate at your 24.0% rate — not tax advice; consult a CPA.
Schools (NCES district)
- District
- Fresno Unified
- NCES district ID
- 0614550
- Math proficiency
- 18% ▼ -12.00%
- Reading proficiency
- 47% ▲ 9.00%
- Median HH income
- $36,095
- Composite
- 26.83/100
- National rank
- #7111
- State rank
- #327 of 517 in CA
Livability — Fresno
- Score
- 62/100
- State rank
- #469
- US rank
- #15907
Category grades
Schools grade is shown separately in the Schools card above.
Census & demographics
- Census place
- Fresno, CA
- County
- Fresno County · 834,801 people
- City population
- 593,114
- Metro
- Fresno, CA
- Population (ZIP)
- 43,875
- Household income
- $47,229
- Rent vs Own
- Severe rent burden
- 2958.0
Population outlook (Fresno County) Hauer SSP2
- Today (2025)
- 1,042,971 people
- By 2030
- 1,072,198 · +2.8%
- By 2040
- 1,122,408 · +7.6%
- By 2050
- 1,157,251 · +11.0%
- By 2075
- 1,182,575 · +13.4%
- By 2100
- 1,105,899 · +6.0%
Race, ethnicity, and origin ACS 2023
- Neighborhood character
- Predominantly Hispanic (75%)
- Race & ethnicity
- Hispanic / Latino 75% Two or more races 26% Asian 10% White 7% Black 4% Native American 2%
- Hispanic origin (detail)
- Mexican 71%
- Foreign-born
- 27% · Canada
- Languages at home
- 35% English-only · Spanish 54% Other Asian/Pacific 9%
Political lean MEDSL · Fresno
- 2024 margin
- Toss-up / Even · D 46.5% · R 50.9% · Other 2.6%
- 2008→2024 swing
- -6.5pp toward R · 2008: 2.1pp · 2024: -4.4pp
- All cycles
- 2024: R+4.4 2020: D+7.8 2016: D+3.9 2012: R+2.9 2008: D+2.1
Not yet ingested
- Civics
- —
Market trends
- HPI YoY
- ▼ -255.81%
- Current HPI
- 467.2799
- Rent YoY
- ▼ -0.94%
- Metro
- Fresno, CA
- State GDP YoY
- ▲ 3.21%
- F500 in state
- 116
Industry mix (Fortune 500 HQ in CA)
| Industry | F500 HQs | Revenue |
|---|---|---|
| Technology | 27 | $1,492B |
|
||
| Financial Services | 3 | $174B |
|
||
| Retail | 3 | $44B |
|
||
| Insurance | 3 | $26B |
|
||
| Media / Entertainment | 2 | $115B |
|
||
| Pharmaceuticals / Biotech | 2 | $62B |
|
||
Price history
2 events — show timeline
- 2026-03-31 Pending — FRESNOMLS
- 2026-03-20 Listed $180,000 FRESNOMLS
Property tax history
+2.2%/yrLatest (2025): $440 · +3.5% YoY. Source: county tax records.
Cash-flow waterfall
monthlySold comps — $/sqft
last 12 mo · ≤1 miLoading sold comps…