 Duplex
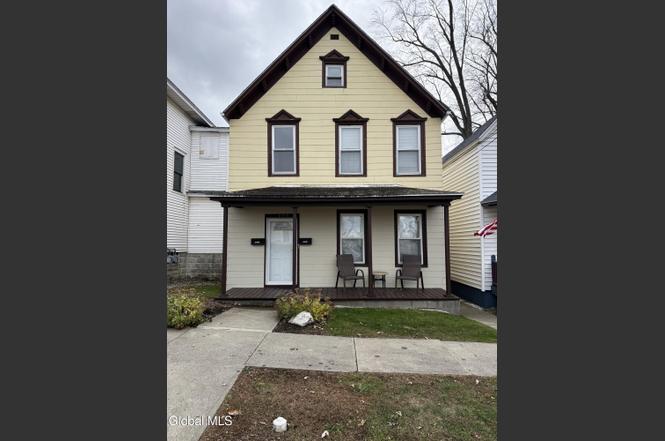
122 Hudson Ave · Cohoes, NY
Flood risk 1/10 · Minimal
- FEMA flood zone
- X (unshaded)
- Chance of flooding over 30 yrs
- 0.0%
- Est. flood insurance / yr
- $473 – $860
Fire risk 2/10 · Minimal
- Est. fire insurance / yr
- $691 – $1,283
Heat risk 4/10 · Minor
- Hot days now (above 98°F)
- 7 days/yr
- Hot days in 30 yrs
- 17 days/yr
Wind risk 3/10 · Minor
- Chance of severe wind over 30 yrs
- 6.0%
Air-quality risk 2/10 · Minimal
- Unhealthy air days now
- 0 days/yr
- Unhealthy air days in 30 yrs
- 1 days/yr
Risk factors via First Street. Map © Google.
Why this score? — see what drove the B grade
The composite is a weighted blend of 9 inputs, each scored 0–100. Each bar is that input's sub-score; the figure is the points it added to the 100-point composite (weight × sub-score).
- Cash flow +30.0/30.0
- DSCR +10.0/10.0
- ARV discount +9.5/15.0
- 1% rule +9.3/10.0
- Rent growth +4.4/5.0
- Livability +4.2/5.0
- Schools +3.6/10.0
- Condition / age +2.5/5.0
- Appreciation +0.0/10.0
$214,900
🖨 Deal sheet 📄 Offer letter ✓ Due diligence
Multi-family units
County records classify this as Multi-Family (2-4 Unit). Listing-text estimate: 2 units. confirmed
Listing remarks
* * Multiple Offers received and due by 11/24 at 8pm. * * Welcome to this exceptionally well-maintained two-family home, perfectly situated just a short walk from Van Schaick Island Country Club, Van Schaick Elementary School and neighborhood park. With quick access to I-787 and only minutes from the scenic Peebles Island State Park, this property sits in one of the Capital Region's most convenient locations. This property presents a fantastic opportunity—whether you're looking for an investment with strong rental potential or a place to call home while generating additional income. The first-floor unit is vacant and truly move-in ready. The owners have shown meticulous care throug
Key facts
- Move-in ready
- Gas lines updated
- Two-family home
Tags
Neighborhood map
What this means for you Summary
Snapshot
- This is a 2 × 2-bed/2.0-bath units multifamily listed at $215k.
Deal economics
- At list price, monthly cash flow is $975 ($12k/yr) — positive. Per door: $487/mo.
- The deal already cash-flows at list — no discount required.
- Meets the 1% rule at list price ($3k rent vs $215k).
- Cap rate 11.7% vs local median 4.7% in Cohoes — top-decile yield for the area; either an underpriced asset or a hidden risk that comps aren't pricing in. Stress-test before assuming the spread holds.
Location & tenants
- Location reads 83/100 on livability (#61 in NY, #895 nationally) — a professional / high-income tenant draw. Strengths: amenities A+, commute A+, housing A+; Watch: employment C-.
- Cohoes City School District (suburban): math 38% / reading 48% proficiency, ranked #487 of 590 in NY (top 82%) — families likely to look elsewhere, expect single-tenant / working-renter base with shorter leases.
- Market conditions: Rents rising fast (+7.6%/yr); 114 active listings in the ZIP; 9 comparable units currently listed for rent nearby; rentals at typical pace (median 15d on market — plan ~3-4 weeks tenant-placement turnaround); 675 units permitted in Albany County in 2024 (451 in 5+ unit buildings).
- At $3,070/mo this rent would consume 56% of the median local household income ($66k/yr) (locally 1395% of renters already pay >50% of income on rent) — very limited rent-growth headroom before tenants either downsize or default.
Forward outlook
- Local home prices are declining (-3.0%/yr); year-one equity from $1k of loan paydown is wiped out by about $6k of value loss. Plan a longer hold.
- Albany County population projected at +9% by 2050 — modest demand growth; plan on rents tracking national, not racing it.
- At projected returns (-3.0% appreciation + 7.6% rent growth), your $60k cash investment doubles in ~6 years — after that, you're playing with house money.
Negotiation context
- Only 6 days on market — expect competitive offers; lowballing is unlikely to land.
- Current owner paid $60k; list at $215k implies a 258% gain — meaningful room to come down on a strong offer.
Risks & watch-outs
- Watch-outs: built in 1910 — expect roof / HVAC / electrical / plumbing capex.
Questions for the listing agent
- Can we see the unit-by-unit rent roll, current vacancy, and any below-market leases? What's the average tenancy length?
- What capital expenditures (roof, boiler, parking lot, exteriors) have been made in the last 5 years, and what's planned in the next 2?
- Built in 1910 — when were the roof, HVAC, electrical panel, plumbing, and water heater last replaced?
- Is there a deadline driving the sale (1031 exchange, divorce, estate, relocation)? That informs how much negotiation room exists.
- What's the average days-on-market for RENTAL listings here right now (not sales)? A rising rental-DOM trend means longer vacancies and softer asking-rent achievability than the comps imply.
- What's the recent tenant-quality profile in this submarket — average credit score on applications, eviction rate, late-payment / NSF rate, and stable-employment percentage? A property-management company in the area should have these aggregated.
- How much new apartment / multifamily construction is in the pipeline within 1–3 miles? Heavy new supply (>2% of stock underway) typically softens rents 12–24 months out; light construction supports rent growth.
Investment metrics
- 1% rule
- 1.43% ✓
- Cap rate
- 11.74%
- Cash-on-cash
- 19.44%
- DSCR
- 1.87
- GRM
- 5.8
CMA / ARV
- ARV (on-the-fly)
- $225,148
- Comps found
- 12
Show comp detail 12 sales within ~0.75 mi
| Address | Dist | Beds/Ba | Sqft | Sold | Price | $/sf | Match |
|---|---|---|---|---|---|---|---|
| 105 Hudson Ave | 0.05mi | 4/2.0 | 1,980 (+5%) | 14mo | $282,500 | $143 | 78 |
| 98 Hudson Ave | 0.07mi | 4/2.0 | 1,672 (-12%) | 7mo | $230,000 | $138 | 72 |
| 76 3rd St | 0.19mi | 4/2.0 | 2,144 (+13%) | 11mo | $236,000 | $110 | 60 |
| 4 Congress St | 0.69mi | 4/2.5 | 1,848 (-2%) | 3mo | $160,000 | $87 | 60 |
| 157 Congress St | 0.49mi | 5/2.0 (+1) | 1,936 (+2%) | 10mo | $205,000 | $106 | 60 |
| 90 Central Ave | 0.63mi | 4/2.0 | 1,930 (+2%) | 10mo | $175,000 | $91 | 59 |
| 46 Continental Ave | 0.57mi | 4/2.0 | 1,832 (-3%) | 12mo | $242,000 | $132 | 58 |
| 46 White St | 0.66mi | 5/2.0 (+1) | 1,900 (+0%) | 10mo | $250,000 | $132 | 55 |
| 100 Lancaster St | 0.55mi | 5/2.0 (+1) | 1,976 (+4%) | 11mo | $235,000 | $119 | 52 |
| 61 Main St | 0.58mi | 4/2.0 | 2,040 (+8%) | 10mo | $317,000 | $155 | 52 |
| 172 Congress St | 0.46mi | 5/2.0 (+1) | 2,094 (+11%) | 8mo | $120,000 | $57 | 49 |
| 443-445 3rd Ave | 0.74mi | 5/2.0 (+1) | 1,792 (-5%) | 10mo | $172,000 | $96 | 44 |
Match score weights: distance 35% · size 25% · config 20% · recency 20%. Top-matched comps best support the ARV.
Projected returns pro-forma
-3.0% appreciation · 7.6% rent growth · sell at horizon
- IRR
- 16.5%
- Equity multiple
- 1.70×
- Total profit
- $42,162
- Equity at exit
- $32,042
- IRR
- 28.2%
- Equity multiple
- 4.06×
- Total profit
- $183,870
- Equity at exit
- $18,581
Cash invested: $60,172 (down + closing). Projections, not guarantees.
Landlord ↔ Tenant lean methodology
- Overall (STATE)
- 15 Strongly Tenant-Friendly
- State New York
- 15 Strongly Tenant-Friendly · D+10
- County
- — inherits STATE
- City
- — inherits STATE
ZIP-level market 12047
- Home prices YoY
- -10.7%
- Rents YoY
- 7.6%
- Active inventory
- 114
- Price-to-rent
- 11.7×
Monthly cashflow live
- Estimated rent
- $3,070 high interval (Pro) →
- Mortgage (P&I)
- −$1,127
- Tax from tax record
- −$234 /mo · $2,807/yr
- Insurance
- −$90
- HOA
- −$0
- Vacancy / Maint / Mgmt
- −$645
- Net cashflow
- $975
Break-even live
2-unit breakdown (identical units grouped — click to expand)
| Units | Beds | Baths | Est. rent |
|---|---|---|---|
| 2× units | 2 | 2 | $3,070 |
| #1 | 2 | 2 | $1,535 |
| #2 | 2 | 2 | $1,535 |
| Total (2 units) | $3,070 | ||
UW: 25.0% down · 7.5% · 30yr · 1.5% tax · 5.0% vac · 8.0% maint · 8.0% mgmt
Financing live
Cash to close
- Down payment
- $53,725
- Closing costs
- $6,447
- Reserves months
- —
- Total cash needed
- —
Loan-product check · same deal, 3 products live
Conventional
25% down · 7.5% · 30yr
- Down + closing
- —
- Monthly P&I
- —
- Monthly cashflow
- —
- DSCR
- —
- Eligible?
- —
Personal DTI + credit; lowest rate.
DSCR
20% down · 8.5% · 30yr
- Down + closing
- —
- Monthly P&I
- —
- Monthly cashflow
- —
- DSCR
- —
- Eligible?
- —
No personal income docs; deal must DSCR.
Hard money
10% down · 12.0% · 12mo
- Down + closing
- —
- Monthly P&I
- —
- Monthly cashflow
- —
- DSCR
- —
- Eligible?
- —
Short-term bridge; refi at stabilization.
Rent comps 9 comps
| Address | Beds | Baths | Sqft | Rent | $/sqft | DOM | Units | Dist |
|---|---|---|---|---|---|---|---|---|
| 192 Saratoga St Cohoes, NY | 1.0–3.0 | 1.0–3.0 | 1157 | $2,600 | $2.25 | 14d | 4 | 0.46mi |
| 12 White St Cohoes, NY | 3.0 | 2.0 | 1790 | $2,895 | $1.62 | 19d | 1 | 0.57mi |
| 290 2nd Ave Troy, NY | 3.0 | 1.0 | 1400 | $1,600 | $1.14 | 21d | 1 | 0.58mi |
| 53 Park Ave Cohoes, NY | 3.0 | 1.0 | 1875 | $1,600 | $0.85 | 14d | 1 | 0.59mi |
| 157 6th Ave Unit 2 Troy, NY | 3.0 | 1.0 | 1300 | $1,350 | $1.04 | 19d | 1 | 0.89mi |
| 131 6th Ave Troy, NY | 4.0 | 1.0 | 1400 | $2,325 | $1.66 | 14d | 1 | 0.92mi |
| 6 Hamilton Pl Unit 2 Cohoes, NY | 3.0 | 1.0 | 2300 | $1,999 | $0.87 | 19d | 1 | 1.23mi |
| 100 N Mohawk St Cohoes, NY | 1.0–3.0 | 1.0–3.0 | 1769 | $3,840 | $2.17 | 14d | 18 | 1.27mi |
| 750 2nd Ave Troy, NY | 1.0–3.0 | 1.0–1.5 | 1185 | $1,711 | $1.44 | 14d | 1 | 1.34mi |
Listing history 3 events
-
2025-11-25status Pending
-
2025-11-19$214,900 Active
-
2012-04-17soldstatus $60,000
ⓘ Source: listings_history table (triggers on properties + properties_extension) + one-shot
backfill from property_details.listing_events for pre-trigger history.
Tax reassessment forecast NY · Partial reset (capped growth)
- Current annual tax
- $2,807 · $234/mo
- Projected year-2 tax
- $3,219 · $268/mo
- Expected delta
- +$413/yr (+$34/mo · 14.7%)
ⓘ Screening estimate from a state-policy table — verify with the county assessor before closing.
Climate risk First Street
- Flood 1/10 Low FEMA zone X (unshaded) · 0% chance over 30 yrs
- Wildfire 2/10 Low
- Heat 4/10 Moderate 7 d/yr ≥98°F today · 17 d/yr by 30 yrs out
- Wind 3/10 Moderate 6% chance of damaging wind over 30 yrs
- Air quality 2/10 Low 0 unhealthy d/yr today · 1 by 30 yrs out
Nearby sold comps map
Loading sold comps map…
Walkable amenities ~0.75 mi
Loading nearby amenities…
Taxation est. · year 1
- Rental income
- $36,840
- − Mortgage interest
- −$12,038
- − Property taxes
- −$2,807
- − Insurance
- −$1,074
- − Repairs & maintenance
- −$2,947
- − Management
- −$2,947
- − Depreciation
- −$6,252
- Taxable income
- $8,775
- Est. tax owed @ 24.0%
- −$2,106
- After-tax cash flow
- $9,593/yr
For passive investors: Depreciation is non-cash, so a rental often shows a tax loss while cash-flowing — sheltering income. Rental losses are passive: they offset passive income freely, and up to $25,000/yr can offset ordinary (W-2) income if you actively participate and your MAGI is under $100k (phasing out to $0 by $150k); unused losses carry forward. On sale, claimed depreciation is recaptured at up to 25%, and gains may owe capital-gains tax (a 1031 exchange can defer both). Figures are a year-1 estimate at your 24.0% rate — not tax advice; consult a CPA.
Schools (NCES district)
- District
- Cohoes City School District
- NCES district ID
- 3607980
- Math proficiency
- 38% ▼ -4.00%
- Reading proficiency
- 48% ▲ 3.00%
- Median HH income
- $45,104
- Composite
- 36.48/100
- National rank
- #4655
- State rank
- #487 of 590 in NY
Livability — Cohoes
- Score
- 83/100
- State rank
- #61
- US rank
- #895
Category grades
Schools grade is shown separately in the Schools card above.
Census & demographics
- Census place
- Cohoes, NY
- County
- Albany County · 196,626 people
- City population
- 23,532
- Metro
- Albany-Schenectady-Troy, NY
- Population (ZIP)
- 23,532
- Household income
- $66,071
- Rent vs Own
- Severe rent burden
- 1395.0
Population outlook (Albany County) Hauer SSP2
- Today (2025)
- 320,794 people
- By 2030
- 327,401 · +2.1%
- By 2040
- 338,218 · +5.4%
- By 2050
- 348,467 · +8.6%
- By 2075
- 381,693 · +19.0%
- By 2100
- 393,809 · +22.8%
Race, ethnicity, and origin ACS 2023
- Neighborhood character
- Predominantly White (70%)
- Race & ethnicity
- White 70% Two or more races 11% Black 9% Hispanic / Latino 7% Asian 5%
- Hispanic origin (detail)
- Puerto Rican 3% Dominican 2%
- Common ancestry
- Lithuanian 8% Romanian 6% Iranian 2%
- Foreign-born
- 9% · Canada, China
- Languages at home
- 87% English-only · Spanish 3% Other Indo-European 3% Chinese 2%
Political lean MEDSL · Albany
- 2024 margin
- Strong D (+25.8) · D 62.9% · R 37.1%
- 2008→2024 swing
- -3.6pp toward R · 2008: 29.4pp · 2024: 25.8pp
- All cycles
- 2024: D+25.8 2020: D+31.4 2016: D+24.3 2012: D+31.0 2008: D+29.4
Not yet ingested
- Civics
- —
Market trends
- HPI YoY
- ▼ -38.15%
- Current HPI
- 317.4057
- Rent YoY
- ▲ 7.60%
- Metro
- Albany-Schenectady-Troy, NY
- State GDP YoY
- ▲ 2.60%
- F500 in state
- 92
Industry mix (Fortune 500 HQ in NY)
| Industry | F500 HQs | Revenue |
|---|---|---|
| Financial Services | 10 | $950B |
|
||
| Consumer Goods | 9 | $162B |
|
||
| Insurance | 4 | $225B |
|
||
| Telecommunications | 2 | $144B |
|
||
| Pharmaceuticals | 2 | $112B |
|
||
| Media / Entertainment | 2 | $69B |
|
||
Price history
+258.2% since first listed3 events — show timeline
- 2025-11-25 Pending — Global MLS
- 2025-11-19 Listed $214,900 Global MLS
- 2012-04-17 Sold (Public Records) $60,000 Public Records
Property tax history
+6.0%/yrLatest (2025): $2,807 · -20.9% YoY. Source: county tax records.
Cash-flow waterfall
monthlySold comps — $/sqft
last 12 mo · ≤1 miLoading sold comps…