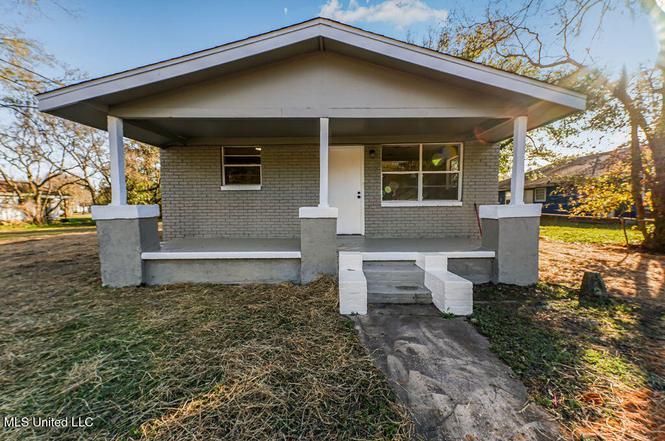
4718 Jackson Ave · Moss Point, MS
Flood risk 1/10 · Minimal
- FEMA flood zone
- X (unshaded)
- Chance of flooding over 30 yrs
- 0.0%
- Est. flood insurance / yr
- $507 – $1,088
Fire risk 1/10 · Minimal
- Est. fire insurance / yr
- $1,241 – $2,305
Heat risk 10/10 · Severe
- Hot days now (above 106°F)
- 7 days/yr
- Hot days in 30 yrs
- 22 days/yr
Wind risk 9/10 · Severe
- Chance of severe wind over 30 yrs
- 99.0%
Air-quality risk 3/10 · Minor
- Unhealthy air days now
- 2 days/yr
- Unhealthy air days in 30 yrs
- 3 days/yr
Risk factors via First Street. Map © Google.
Why this score? — see what drove the B grade
The composite is a weighted blend of 9 inputs, each scored 0–100. Each bar is that input's sub-score; the figure is the points it added to the 100-point composite (weight × sub-score).
- Cash flow +30.0/30.0
- 1% rule +10.0/10.0
- DSCR +10.0/10.0
- ARV discount +7.5/15.0
- Appreciation +7.3/10.0
- Livability +3.4/5.0
- Rent growth +2.5/5.0
- Condition / age +2.5/5.0
- Schools +1.6/10.0
$74,900
🖨 Deal sheet 📄 Offer letter ✓ Due diligence
Listing remarks MLS
Handyman special fixer upper. This home is great for investors. Needs TLC. Home sold ''as is where is''. Owner finance available at $8k down, 8% 5 year balloon. Buyer pays all closing costs
Key facts
- Solid brick house
- Spacious lot
- 7,405 sq ft lot
Tags
Property features AI
Finance
- Other:
- Financial info:
- HOA & community:
Exterior
- Parking: Carport (2 parking spaces); No garage
- Security:
- Utilities: Public water; Public sewer; Electricity connected; Sewer connected
- Home design: Single-family house; One story; Entry level information not provided
- Construction: Brick construction; Shingle roof; Pilings/steel/wood foundation; Built year available from public records
- Exterior features: Front porch; Chain link and partial fencing; See remarks for additional exterior details
Interior
- Kitchen:
- Bedrooms:
- Flooring: Ceramic tile
- Bathrooms: 1 full bathroom
- Heating & cooling: Electric heating; Central air conditioning
- Interior features: Ceramic tile floors
- Laundry & utility:
Neighborhood map
What this means for you Summary
Snapshot
- This is a 3-bed/1.0-bath single-family listed at $75k.
Deal economics
- At list price, monthly cash flow is $594 ($7k/yr) — positive.
- The deal already cash-flows at list — no discount required.
- Meets the 1% rule at list price ($1k rent vs $75k).
- Recommended offer: $68k (9.0% below list) — sets the bar for market timing.
- Cap rate 15.8% vs local median 6.8% in Moss Point — top-decile yield for the area; either an underpriced asset or a hidden risk that comps aren't pricing in. Stress-test before assuming the spread holds.
Location & tenants
- Location reads 67/100 on livability (#77 in MS) — a middle-class / working-renter tenant base. Strengths: cost of living A+, housing A+, crime A-; Watch: health & safety D+, schools D, amenities F.
- Moss Point Separate School District (suburban): math 17% / reading 22% proficiency, ranked #94 of 130 in MS (top 72%) — low school quality limits family demand, transient renter base, plan for 1-2y turnover; 83% free/reduced lunch — lower-income household profile, screen leases tightly.
- Market conditions: 86 active listings in the ZIP; 516 units permitted in Jackson County in 2024 (6 in 5+ unit buildings).
Forward outlook
- In year one you build about $4k of equity ($518 loan paydown + $3k appreciation (4.6% local appreciation)).
- At projected returns (4.6% appreciation + 3.0% rent growth), your $21k cash investment doubles in ~2 years — after that, you're playing with house money.
- By year 9, paydown + projected appreciation supports a ~$34k cash-out refi (75% LTV) — recoverable capital for the next deal without selling this one.
Negotiation context
- It's been on market 120 days — a 9% lower offer ($68k) is reasonable based on typical stale-listing flexibility.
- 4 sale attempts since 19y ago; this cycle's ask has dropped $15k (17%) from the opening price — seller is motivated, your offer sets the floor, not the list.
Risks & watch-outs
- Watch-outs: built in 1952 — expect roof / HVAC / electrical / plumbing capex.
- Climate carrying-cost: severe wind risk, 99% chance of damaging wind over 30y; extreme-heat days projected 7→22/yr by 2055 (HVAC capex compounding) — expect insurance premiums to compound above CPI over the hold.
Questions for the listing agent
- It's been on market 120 days. Have you received any prior offers? Is the seller open to a 9% concession, seller financing, or rate buy-down credit?
- Built in 1952 — when were the roof, HVAC, electrical panel, plumbing, and water heater last replaced?
- Why hasn't it sold? Are there any deal-killer items the seller is aware of (foundation, flood, title, zoning, code violations)?
- Is there a deadline driving the sale (1031 exchange, divorce, estate, relocation)? That informs how much negotiation room exists.
- Schools are D-rated, which usually means shorter tenancies and higher turnover. Who's the typical renter profile here, and what's been the actual vacancy rate?
- What's the average days-on-market for RENTAL listings here right now (not sales)? A rising rental-DOM trend means longer vacancies and softer asking-rent achievability than the comps imply.
- What's the recent tenant-quality profile in this submarket — average credit score on applications, eviction rate, late-payment / NSF rate, and stable-employment percentage? A property-management company in the area should have these aggregated.
- How much new for-sale + rental construction is in the pipeline within 1–3 miles? Heavy new supply typically softens prices + rents 12–24 months out; constrained supply supports both.
Investment metrics
- 1% rule
- 1.83% ✓
- Cap rate
- 15.82%
- Cash-on-cash
- 34.01%
- DSCR
- 2.51
- GRM
- 4.6
CMA / ARV
- ARV (on-the-fly)
- $74,880
- Comps found
- 6
Show comp detail 6 sales within ~0.75 mi
| Address | Dist | Beds/Ba | Sqft | Sold | Price | $/sf | Match |
|---|---|---|---|---|---|---|---|
| 4718 Jackson Ave | 0.00mi | 3/1.0 | 938 (+0%) | 0mo | $74,900 | $80 | 99 |
| 4837 Diamond Ave | 0.15mi | 3/1.0 | 954 (+2%) | 3mo | $129,900 | $136 | 87 |
| 4006 Macphelah Rd | 0.14mi | 2/1.0 (-1) | 1,008 (+8%) | 2mo | $80,000 | $79 | 74 |
| 4406 Walley St | 0.30mi | 2/1.0 (-1) | 1,023 (+9%) | 10mo | $89,900 | $88 | 57 |
| 4937 Frederick St | 0.26mi | 3/1.0 | 1,040 (+11%) | 19mo | $20,000 | $19 | 54 |
| 5148 Meridian St | 0.60mi | 3/1.0 | 840 (-10%) | 24mo | $32,000 | $38 | 35 |
Match score weights: distance 35% · size 25% · config 20% · recency 20%. Top-matched comps best support the ARV.
Projected returns pro-forma
4.6% appreciation · 3.0% rent growth · sell at horizon
- IRR
- 42.2%
- Equity multiple
- 3.55×
- Total profit
- $53,428
- Equity at exit
- $40,646
- IRR
- 40.6%
- Equity multiple
- 7.18×
- Total profit
- $129,639
- Equity at exit
- $68,706
Cash invested: $20,972 (down + closing). Projections, not guarantees.
Landlord ↔ Tenant lean methodology
- Overall (STATE)
- 90 Strongly Landlord-Friendly
- State Mississippi
- 90 Strongly Landlord-Friendly · R+11
- County
- — inherits STATE
- City
- — inherits STATE
ZIP-level market 39563
- Home prices YoY
- 3.0%
- Active inventory
- 86
- Price-to-rent
- 4.6×
Monthly cashflow live
- Estimated rent
- $1,368 medium interval (Pro) →
- Mortgage (P&I)
- −$393
- Tax from tax record
- −$62 /mo · $747/yr
- Insurance
- −$31
- HOA
- −$0
- Vacancy / Maint / Mgmt
- −$287
- Net cashflow
- $594
Break-even live
UW: 25.0% down · 7.5% · 30yr · 1.5% tax · 5.0% vac · 8.0% maint · 8.0% mgmt
Financing live
Cash to close
- Down payment
- $18,725
- Closing costs
- $2,247
- Reserves months
- —
- Total cash needed
- —
Loan-product check · same deal, 3 products live
Conventional
25% down · 7.5% · 30yr
- Down + closing
- —
- Monthly P&I
- —
- Monthly cashflow
- —
- DSCR
- —
- Eligible?
- —
Personal DTI + credit; lowest rate.
DSCR
20% down · 8.5% · 30yr
- Down + closing
- —
- Monthly P&I
- —
- Monthly cashflow
- —
- DSCR
- —
- Eligible?
- —
No personal income docs; deal must DSCR.
Hard money
10% down · 12.0% · 12mo
- Down + closing
- —
- Monthly P&I
- —
- Monthly cashflow
- —
- DSCR
- —
- Eligible?
- —
Short-term bridge; refi at stabilization.
Listing history 11 events
-
2026-05-25status Pending
-
2026-04-30price $74,900
-
2026-03-16price $79,999
-
2026-03-03status Active
-
2026-03-01status Pending
-
2026-02-09price $85,000
-
2026-01-22$89,900 Active
-
2016-03-24soldstatus 189-char remark
Show marketing remark (189 chars)
Handyman special fixer upper. This home is great for investors. Needs TLC. Home sold ''as is where is''. Owner finance available at $8k down, 8% 5 year balloon. Buyer pays all closing costs
-
2015-12-21$19,900 189-char remark
Show marketing remark (189 chars)
Handyman special fixer upper. This home is great for investors. Needs TLC. Home sold ''as is where is''. Owner finance available at $8k down, 8% 5 year balloon. Buyer pays all closing costs
-
2008-01-18soldstatus
-
2007-08-07$69,999
ⓘ Source: listings_history table (triggers on properties + properties_extension) + one-shot
backfill from property_details.listing_events for pre-trigger history.
Tax reassessment forecast MS · Resets to sale price
- Current annual tax
- $747 · $62/mo
- Projected year-2 tax
- $747 · $62/mo
- Expected delta
- $0/yr ($0/mo · 0.0%)
ⓘ Screening estimate from a state-policy table — verify with the county assessor before closing.
Climate risk First Street
- Flood 1/10 Low FEMA zone X (unshaded) · 0% chance over 30 yrs
- Wildfire 1/10 Low
- Heat 10/10 Extreme 7 d/yr ≥106°F today · 22 d/yr by 30 yrs out
- Wind 9/10 Extreme 99% chance of damaging wind over 30 yrs
- Air quality 3/10 Moderate 2 unhealthy d/yr today · 3 by 30 yrs out
Nearby sold comps map
Loading sold comps map…
Walkable amenities ~0.75 mi
Loading nearby amenities…
Taxation est. · year 1
- Rental income
- $16,413
- − Mortgage interest
- −$4,196
- − Property taxes
- −$747
- − Insurance
- −$374
- − Repairs & maintenance
- −$1,313
- − Management
- −$1,313
- − Depreciation
- −$2,179
- Taxable income
- $6,292
- Est. tax owed @ 24.0%
- −$1,510
- After-tax cash flow
- $5,622/yr
For passive investors: Depreciation is non-cash, so a rental often shows a tax loss while cash-flowing — sheltering income. Rental losses are passive: they offset passive income freely, and up to $25,000/yr can offset ordinary (W-2) income if you actively participate and your MAGI is under $100k (phasing out to $0 by $150k); unused losses carry forward. On sale, claimed depreciation is recaptured at up to 25%, and gains may owe capital-gains tax (a 1031 exchange can defer both). Figures are a year-1 estimate at your 24.0% rate — not tax advice; consult a CPA.
Schools (NCES district)
- District
- Moss Point Separate School District
- NCES district ID
- 2803000
- Math proficiency
- 17% ▼ -3.00%
- Reading proficiency
- 22% ▬ 0.00%
- Median HH income
- $38,041
- Composite
- 16.34/100
- National rank
- #9205
- State rank
- #94 of 130 in MS
Livability — Moss Point
- Score
- 67/100
- State rank
- #77
- US rank
- #10398
Category grades
Schools grade is shown separately in the Schools card above.
Census & demographics
- Census place
- Moss Point, MS
- City population
- 12,023
- Population (ZIP)
- 12,023
Population outlook (Jackson County) Hauer SSP2
- Today (2025)
- 146,926 people
- By 2030
- 148,442 · +1.0%
- By 2040
- 149,631 · +1.8%
- By 2050
- 148,723 · +1.2%
- By 2075
- 147,845 · +0.6%
- By 2100
- 144,510 · -1.6%
Race, ethnicity, and origin ACS 2023
- Neighborhood character
- Predominantly Black (74%)
- Race & ethnicity
- Black 74% White 18% Hispanic / Latino 4% Two or more races 2%
- Common ancestry
- Lithuanian 0%
- Foreign-born
- 1% · Canada
- Languages at home
- 97% English-only · Spanish 3%
Political lean MEDSL · Jackson
- 2024 margin
- Solid R (+39.9) · D 29.5% · R 69.4% · Other 1.1%
- 2008→2024 swing
- -6.4pp toward R · 2008: -33.5pp · 2024: -39.9pp
- All cycles
- 2024: R+39.9 2020: R+34.6 2016: R+39.9 2012: R+36.1 2008: R+33.5
Not yet ingested
- Civics
- —
Market trends
- HPI YoY
- ▲ 4.60%
- Current HPI
- 155.3138
- Rent YoY
- —
- Metro
- —
- State GDP YoY
- —
- F500 in state
- 0
Price history
+7.0% since first listed11 events — show timeline
- 2026-05-25 Pending — MLSU
- 2026-04-30 Price Changed $74,900 MLSU
- 2026-03-16 Price Changed $79,999 MLSU
- 2026-03-03 Relisted — MLSU
- 2026-03-01 Pending — MLSU
- 2026-02-09 Price Changed $85,000 MLSU
- 2026-01-22 Listed $89,900 MLSU
- 2016-03-24 Sold (MLS) — MLSU
- 2015-12-21 Listed $19,900 MLSU
- 2008-01-18 Sold (MLS) — MLSU
- 2007-08-07 Listed $69,999 MLSU
Property tax history
+12.6%/yrLatest (2025): $747 · +5.8% YoY. Source: county tax records.
Cash-flow waterfall
monthlySold comps — $/sqft
last 12 mo · ≤1 miLoading sold comps…