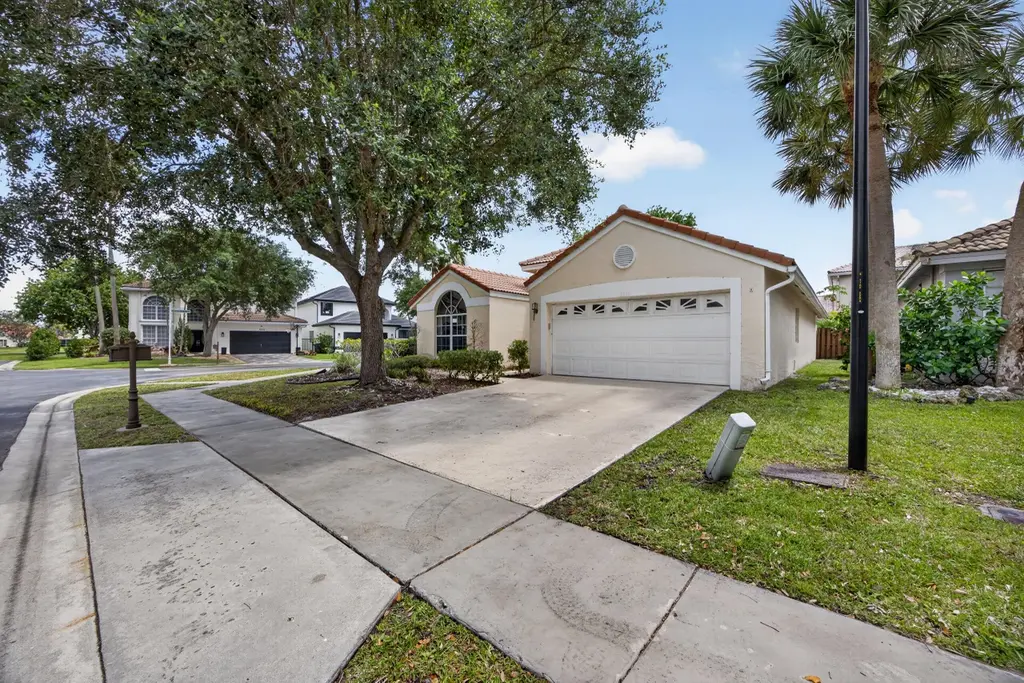
10870 Old Bridgeport Ln · Boca Raton, FL
Flood risk 1/10 · Minimal
- FEMA flood zone
- X (unshaded)
- Chance of flooding over 30 yrs
- 0.0%
- Est. flood insurance / yr
- $507 – $1,088
Fire risk 4/10 · Minor
- Est. fire insurance / yr
- $947 – $1,759
Heat risk 9/10 · Severe
- Hot days now (above 107°F)
- 7 days/yr
- Hot days in 30 yrs
- 26 days/yr
Wind risk 10/10 · Severe
- Chance of severe wind over 30 yrs
- 99.0%
Air-quality risk 2/10 · Minimal
- Unhealthy air days now
- 2 days/yr
- Unhealthy air days in 30 yrs
- 2 days/yr
Risk factors via First Street. Map © Google.
Why this score? — see what drove the D- grade
The composite is a weighted blend of 9 inputs, each scored 0–100. Each bar is that input's sub-score; the figure is the points it added to the 100-point composite (weight × sub-score).
- Cash flow +8.0/30.0
- ARV discount +7.5/15.0
- Appreciation +7.3/10.0
- Schools +4.3/10.0
- Livability +3.9/5.0
- Rent growth +2.5/5.0
- Condition / age +2.5/5.0
- DSCR +2.1/10.0
- 1% rule +1.9/10.0
$650,000
🖨 Deal sheet 📄 Offer letter ✓ Due diligence
Listing remarks
Investors Dream!! As-AS Home needs TLC seller is motivated to sell, seller will give $20,000 for Closing. home located in the highly desirable community of Boca Raton. This residence offers a bright, living areas, high ceilings, and abundant natural light throughout. The kitchen is every spacious flow seamlessly, creating an inviting environment for both everyday living and entertaining.
Key facts
- 6,175 sq ft lot
- 2 garage spots
- Pool
Tags
Property features AI
Finance
- Other: Building recorded area: 2,300 (source: appraiser); Living area reported as 1,628
- HOA & community: Homeowners association (Lake Of Boca Raton HOA); Quarterly HOA fee; Association amenities: clubhouse, fitness center, pool, tennis courts; HOA fee includes pool service
Exterior
- Parking: Attached 2-car garage; 2 covered parking spaces
- Utilities: Public water; Public sewer; Electricity available
- Home design: Single-family residence; One story; Resale property
- Construction: Block and concrete construction; Concrete, tile, and wood roof
- Exterior features: Private pool; Not waterfront; Faces east
Interior
- Kitchen: Dishwasher; Microwave; Refrigerator; Freezer
- Bedrooms: 3 bedrooms on the main level
- Flooring: Ceramic tile; Tile flooring throughout
- Bathrooms: 2 full bathrooms (both on the main level)
- Heating & cooling: Central electric heating; Central electric air conditioning
- Interior features: Walk-in closets
- Laundry & utility: Laundry in common area
Neighborhood map
What this means for you Summary
Snapshot
- This is a 3-bed/2.0-bath single-family listed at $650k.
Deal economics
- At list price, monthly cash flow is $-660 ($-8k/yr) — negative.
- To cash-flow at today's rent, offer at most $533k (17.9% below list).
- To meet the 1% rule (rent ≥ 1% of price), the offer needs to be $448k (31.0% below list).
- Recommended offer: $448k (31.0% below list) — sets the bar for 1% rule.
- Cap rate 5.1% vs local median 2.8% in Boca Raton — top-decile yield for the area; either an underpriced asset or a hidden risk that comps aren't pricing in. Stress-test before assuming the spread holds.
Location & tenants
- Location reads 77/100 on livability (#192 in FL, #3,070 nationally) — a middle-class / working-renter tenant base. Strengths: employment A+, health & safety A+, crime B+; Watch: amenities D, cost of living F.
- Palm Beach (suburban): math 46% / reading 53% proficiency, ranked #34 of 73 in FL (top 47%) — families likely to look elsewhere, expect single-tenant / working-renter base with shorter leases.
- Zoned schools: Sunrise Park Elementary School (math 80% / reading 81%, grade A+, #104 of 2,144 statewide, top 5%, 1,074 students, 23% FRL); Eagles Landing Middle School (math 66% / reading 67%, grade A-, #84 of 571 statewide, top 16%, 1,508 students, 27% FRL); Olympic Heights Community High (math 52% / reading 64%, grade C, #120 of 667 statewide, top 18%, 2,602 students, 30% FRL) — zoned schools average 27% FRL vs 52% district-wide (25 pts lower); this property's tenant base skews higher-income than the district average.
- Zoned-school proficiency averages 68% at this address vs 50% district-wide (+19 pts) — the actual schools serving this property are materially stronger than the Palm Beach average implies; a family-tenant draw the district grade alone would hide.
- Market conditions: 92 active listings in the ZIP; 36 comparable units currently listed for rent nearby; rentals at typical pace (median 22d on market — plan ~3-4 weeks tenant-placement turnaround); high-income renter base; 3,974 units permitted in Palm Beach County in 2024 (1,012 in 5+ unit buildings).
- This rent runs 37% of the median local income ($147k/yr) — at the standard rent-burdened threshold; future hikes will face affordability resistance.
Forward outlook
- In year one you build about $35k of equity ($4k loan paydown + $30k appreciation (4.7% local appreciation)).
- Palm Beach County population projected at +30% by 2050 — long-run rental-demand tailwind backs the buy-and-hold thesis.
- By year 2, paydown + projected appreciation supports a ~$56k cash-out refi (75% LTV) — recoverable capital for the next deal without selling this one.
Negotiation context
- It's been on market 55 days — a 3% lower offer ($630k) is reasonable based on typical stale-listing flexibility.
- Current owner paid $148k; list at $650k implies a 340% gain — meaningful room to come down on a strong offer.
Risks & watch-outs
- Climate carrying-cost: severe wind risk, 99% chance of damaging wind over 30y; extreme-heat days projected 7→26/yr by 2055 (HVAC capex compounding) — expect insurance premiums to compound above CPI over the hold.
Questions for the listing agent
- What do current leases actually rent for vs. the listed asking? Can we see a recent rent roll and the last 12 months of T-12 income?
- It's been on market 55 days. Have you received any prior offers? Is the seller open to a 31% concession, seller financing, or rate buy-down credit?
- What does the HOA fee cover, when was the last increase, and are there any pending special assessments or reserve-fund shortfalls?
- Is there a deadline driving the sale (1031 exchange, divorce, estate, relocation)? That informs how much negotiation room exists.
- Schools are A-rated — typically a magnet for longer-tenancy family renters. What's the average tenant stay here, and is there a school-zone premium baked into asking?
- The area grade is low — what's the realistic commute time and amenity access for the typical tenant pool here? Any planned neighborhood developments (good or bad) we should know about?
- What's the average days-on-market for RENTAL listings here right now (not sales)? A rising rental-DOM trend means longer vacancies and softer asking-rent achievability than the comps imply.
- What's the recent tenant-quality profile in this submarket — average credit score on applications, eviction rate, late-payment / NSF rate, and stable-employment percentage? A property-management company in the area should have these aggregated.
- How much new for-sale + rental construction is in the pipeline within 1–3 miles? Heavy new supply typically softens prices + rents 12–24 months out; constrained supply supports both.
Investment metrics
- 1% rule
- 0.69% ✗
- Cap rate
- 5.07%
- Cash-on-cash
- -4.35%
- DSCR
- 0.81
- GRM
- 12.1
CMA / ARV
- ARV (on-the-fly)
- $393,976
- Comps found
- 1
Show comp detail 1 sale within ~0.75 mi
| Address | Dist | Beds/Ba | Sqft | Sold | Price | $/sf | Match |
|---|---|---|---|---|---|---|---|
| 10608 180th Pl S | 0.50mi | 3/2.0 | 1,857 (+14%) | 9mo | $450,000 | $242 | 45 |
Match score weights: distance 35% · size 25% · config 20% · recency 20%. Top-matched comps best support the ARV.
Projected returns pro-forma
4.68% appreciation · 3.0% rent growth · sell at horizon
- IRR
- 8.3%
- Equity multiple
- 1.53×
- Total profit
- $95,794
- Equity at exit
- $355,727
- IRR
- 10.2%
- Equity multiple
- 2.82×
- Total profit
- $331,674
- Equity at exit
- $603,749
Cash invested: $182,000 (down + closing). Projections, not guarantees.
Landlord ↔ Tenant lean methodology
- Overall (STATE)
- 87 Strongly Landlord-Friendly
- State Florida
- 87 Strongly Landlord-Friendly · R+3
- County
- — inherits STATE
- City
- — inherits STATE
ZIP-level market 33498
- Home prices YoY
- 1.5%
- Active inventory
- 92
- Price-to-rent
- 12.1×
Monthly cashflow live
- Estimated rent
- $4,485 high interval (Pro) →
- Mortgage (P&I)
- −$3,409
- Tax from tax record
- −$249 /mo · $2,994/yr
- Insurance
- −$271
- HOA
- −$274
- Vacancy / Maint / Mgmt
- −$942
- Net cashflow
- $-660
Break-even live
UW: 25.0% down · 7.5% · 30yr · 1.5% tax · 5.0% vac · 8.0% maint · 8.0% mgmt
Financing live
Cash to close
- Down payment
- $162,500
- Closing costs
- $19,500
- Reserves months
- —
- Total cash needed
- —
Loan-product check · same deal, 3 products live
Conventional
25% down · 7.5% · 30yr
- Down + closing
- —
- Monthly P&I
- —
- Monthly cashflow
- —
- DSCR
- —
- Eligible?
- —
Personal DTI + credit; lowest rate.
DSCR
20% down · 8.5% · 30yr
- Down + closing
- —
- Monthly P&I
- —
- Monthly cashflow
- —
- DSCR
- —
- Eligible?
- —
No personal income docs; deal must DSCR.
Hard money
10% down · 12.0% · 12mo
- Down + closing
- —
- Monthly P&I
- —
- Monthly cashflow
- —
- DSCR
- —
- Eligible?
- —
Short-term bridge; refi at stabilization.
Rent comps 36 comps
| Address | Beds | Baths | Sqft | Rent | $/sqft | DOM | Units | Dist |
|---|---|---|---|---|---|---|---|---|
| 10758 Lake Jasmine Dr Boca Raton, FL | 4.0 | 2.5 | 1927 | $4,350 | $2.26 | 24d | 1 | 0.32mi |
| 10780 Cypress Lake Ter Boca Raton, FL | 3.0 | 2.0 | 1450 | $3,500 | $2.41 | 7d | 1 | 0.32mi |
| 10781 Cypress Lake Ter Boca Raton, FL | 3.0 | 2.0 | 1450 | $3,800 | $2.62 | 18d | 1 | 0.33mi |
| 10781 Cypress Lake Ter Boca Raton, FL | 3.0 | 2.0 | 1450 | $3,600 | $2.48 | 17d | 1 | 0.33mi |
| 10766 Crescendo Cir Unit X Boca Raton, FL | 3.0 | 2.5 | 2223 | $4,500 | $2.02 | 24d | 1 | 0.37mi |
| 18965 Adagio Dr Boca Raton, FL | 3.0 | 2.0 | 1795 | $5,250 | $2.92 | 24d | 1 | 0.45mi |
| 10875 Lake Front Pl Unit 10875 Boca Raton, FL | 2.0 | 2.0 | 1204 | $2,300 | $1.91 | 24d | 1 | 0.53mi |
| 18298 102nd Way S Boca Raton, FL | 4.0 | 2.0 | 1853 | $6,500 | $3.51 | 24d | 1 | 0.61mi |
| 21461 Sawmill Ct Boca Raton, FL | 4.0 | 2.5 | 2107 | $4,100 | $1.95 | 24d | 1 | 0.64mi |
| 9928 Moss Pond Dr Boca Raton, FL | 3.0 | 2.5 | 1843 | $4,500 | $2.44 | 12d | 1 | 0.90mi |
| 9928 Moss Pond Dr Boca Raton, FL | 3.0 | 2.5 | 1843 | $4,500 | $2.44 | 24d | 1 | 0.90mi |
| 9928 Moss Pond Dr Unit 9928 Boca Raton, FL | 3.0 | 2.5 | 1843 | $4,500 | $2.44 | 15d | 1 | 0.90mi |
| 9975 Boca Gardens Trl Unit A Boca Raton, FL | 3.0 | 2.0 | 1276 | $3,300 | $2.59 | 7d | 1 | 0.93mi |
| 18813 Cloud Lake Cir Boca Raton, FL | 3.0 | 2.0 | 1132 | $3,400 | $3.00 | 4d | 1 | 0.96mi |
| 18813 Cloud Lake Cir Boca Raton, FL | 3.0 | 2.0 | 1132 | $3,500 | $3.09 | 4d | 1 | 0.96mi |
| 9850 Ridgecreek Rd Boca Raton, FL | 3.0 | 2.0 | 1364 | $3,600 | $2.64 | 24d | 1 | 1.00mi |
| 9841 Ridgecreek Rd Boca Raton, FL | 3.0 | 2.0 | 1435 | $4,500 | $3.14 | 24d | 1 | 1.02mi |
| 18917 Cloud Lake Cir Boca Raton, FL | 3.0 | 2.0 | 1132 | $3,350 | $2.96 | 24d | 1 | 1.02mi |
| 9785 Ridgecreek Rd Boca Raton, FL | 3.0 | 2.0 | 1172 | $3,600 | $3.07 | 19d | 1 | 1.03mi |
| 9785 Ridgecreek Rd Boca Raton, FL | 2.0 | 2.0 | 1172 | $3,450 | $2.94 | 5d | 1 | 1.03mi |
| 19356 Cherry Hills Ter Boca Raton, FL | 3.0 | 2.0 | 2150 | $4,000 | $1.86 | 24d | 1 | 1.06mi |
| 9732 Saddlebrook Dr Boca Raton, FL | 4.0 | 2.0 | 1388 | $3,235 | $2.33 | 11d | 1 | 1.11mi |
| 9940 Liberty Rd Boca Raton, FL | 4.0 | 2.0 | 1674 | $5,500 | $3.29 | 24d | 1 | 1.15mi |
| 9713 Boca Gardens Pkwy Unit D Boca Raton, FL | 3.0 | 3.5 | 1325 | $3,995 | $3.02 | 15d | 1 | 1.17mi |
| 9636 Tavernier Dr Boca Raton, FL | 3.0 | 2.0 | 1820 | $4,200 | $2.31 | 24d | 1 | 1.22mi |
| 9585 Affirmed Ln Boca Raton, FL | 4.0 | 2.0 | 1756 | $3,950 | $2.25 | 5d | 1 | 1.22mi |
| 19287 Liberty Rd Boca Raton, FL | 3.0 | 2.0 | 1327 | $3,450 | $2.60 | 24d | 1 | 1.23mi |
| 19287 Liberty Rd Boca Raton, FL | 3.0 | 3.0 | 1327 | $3,450 | $2.60 | 5d | 1 | 1.23mi |
| 19287 Liberty Rd Boca Raton, FL | 3.0 | 3.0 | 1327 | $3,450 | $2.60 | 11d | 1 | 1.23mi |
| 9590 Islamorada Ter Boca Raton, FL | 4.0 | 2.5 | 2064 | $5,000 | $2.42 | 22d | 1 | 1.26mi |
| 9448 Saddlebrook Dr Boca Raton, FL | 3.0 | 2.0 | 1243 | $3,500 | $2.82 | 20d | 1 | 1.38mi |
| 9448 Saddlebrook Dr Unit 9448 Boca Raton, FL | 3.0 | 2.0 | 1243 | $3,500 | $2.82 | 24d | 1 | 1.38mi |
| 9505 Aegean Dr Boca Raton, FL | 4.0 | 2.5 | 2133 | $4,200 | $1.97 | 7d | 1 | 1.39mi |
| 9718 Lancaster Pl Boca Raton, FL | 3.0 | 2.0 | 1773 | $4,400 | $2.48 | 24d | 1 | 1.41mi |
| 9392 Affirmed Ln Boca Raton, FL | 3.0 | 2.0 | 1635 | $3,200 | $1.96 | 15d | 1 | 1.42mi |
| 9680 Lancaster Pl Boca Raton, FL | 3.0 | 2.0 | 1504 | $4,850 | $3.22 | 24d | 1 | 1.44mi |
HOA detail
- Monthly dues
- $274 · $3,288/yr
Listing history 17 events
-
2026-06-18days on market $650,000 Active 55 DOM
-
2026-06-17days on market $650,000 Active 54 DOM
-
2026-06-16days on market $650,000 Active 53 DOM
-
2026-06-15days on market $650,000 Active 52 DOM
-
2026-06-13remarks 391-char remark
-
2026-06-13days on market $650,000 Active 50 DOM
-
2026-06-09days on market $650,000 Active 46 DOM
-
2026-06-08days on market $650,000 Active 45 DOM
-
2026-06-07days on market $650,000 Active 44 DOM
-
2026-06-04days on market $650,000 Active 41 DOM
-
2026-06-03days on market $650,000 Active 40 DOM
-
2026-06-02days on market $650,000 Active 39 DOM
-
2026-06-01days on market $650,000 Active 38 DOM
-
2026-05-31days on market $650,000 Active 37 DOM
-
2026-05-12price $650,000
-
2026-04-24$750,000 Active
-
1994-06-29soldstatus $147,800
ⓘ Source: listings_history table (triggers on properties + properties_extension) + one-shot
backfill from property_details.listing_events for pre-trigger history.
Tax reassessment forecast FL · Resets to sale price
- Current annual tax
- $2,994 · $249/mo
- Projected year-2 tax
- $5,395 · $450/mo
- Expected delta
- +$2,401/yr (+$200/mo · 80.2%)
ⓘ Screening estimate from a state-policy table — verify with the county assessor before closing.
Climate risk First Street
- Flood 1/10 Low FEMA zone X (unshaded) · 0% chance over 30 yrs
- Wildfire 4/10 Moderate
- Heat 9/10 Extreme 7 d/yr ≥107°F today · 26 d/yr by 30 yrs out
- Wind 10/10 Extreme 99% chance of damaging wind over 30 yrs
- Air quality 2/10 Low 2 unhealthy d/yr today · 2 by 30 yrs out
Nearby sold comps map
Loading sold comps map…
Walkable amenities ~0.75 mi
Loading nearby amenities…
Taxation est. · year 1
- Rental income
- $53,814
- − Mortgage interest
- −$36,410
- − Property taxes
- −$2,994
- − Insurance
- −$3,250
- − Repairs & maintenance
- −$4,305
- − Management
- −$4,305
- − HOA
- −$3,288
- − Depreciation
- −$18,909
- Taxable loss
- −$19,647
- Est. tax savings @ 24.0%
- +$4,715
- After-tax cash flow
- $-3,207/yr
For passive investors: Depreciation is non-cash, so a rental often shows a tax loss while cash-flowing — sheltering income. Rental losses are passive: they offset passive income freely, and up to $25,000/yr can offset ordinary (W-2) income if you actively participate and your MAGI is under $100k (phasing out to $0 by $150k); unused losses carry forward. On sale, claimed depreciation is recaptured at up to 25%, and gains may owe capital-gains tax (a 1031 exchange can defer both). Figures are a year-1 estimate at your 24.0% rate — not tax advice; consult a CPA.
Schools (NCES district)
- District
- Palm Beach
- NCES district ID
- 1201500
- Math proficiency
- 46% ▼ -16.00%
- Reading proficiency
- 53% ▼ -4.00%
- Median HH income
- $53,943
- Composite
- 42.72/100
- National rank
- #3160
- State rank
- #34 of 73 in FL
Livability — Boca Raton
- Score
- 77/100
- State rank
- #192
- US rank
- #3070
Category grades
Schools grade is shown separately in the Schools card above.
Census & demographics
- County
- Palm Beach County · 1,438,312 people
- City population
- 250,102
- Metro
- Miami-Fort Lauderdale-Pompano Beach, FL
- Population (ZIP)
- 16,853
- Household income
- $146,765
- Rent vs Own
- Severe rent burden
- 65.0
Population outlook (Palm Beach County) Hauer SSP2
- Today (2025)
- 1,637,487 people
- By 2030
- 1,743,255 · +6.5%
- By 2040
- 1,948,712 · +19.0%
- By 2050
- 2,132,979 · +30.3%
- By 2075
- 2,530,027 · +54.5%
- By 2100
- 2,706,979 · +65.3%
Race, ethnicity, and origin ACS 2023
- Neighborhood character
- Predominantly White (68%)
- Race & ethnicity
- White 68% Hispanic / Latino 20% Two or more races 16% Asian 3% Black 2%
- Hispanic origin (detail)
- Mexican 2% Cuban 6%
- Common ancestry
- Romanian 17% Scotch-Irish 6% Italian 3%
- Foreign-born
- 28% · Canada, Dominican Republic, China
- Languages at home
- 72% English-only · Spanish 12% Other Indo-European 6% Russian/Polish/Slavic 5%
Political lean MEDSL · Palm Beach
- 2024 margin
- Toss-up / Even · D 50.0% · R 49.2%
- 2008→2024 swing
- -22.1pp toward R · 2008: 22.9pp · 2024: 0.8pp
- All cycles
- 2024: D+0.8 2020: D+12.8 2016: D+15.3 2012: D+17.0 2008: D+22.9
Not yet ingested
- Civics
- —
Market trends
- HPI YoY
- ▲ 4.68%
- Current HPI
- 325.4026
- Rent YoY
- —
- Metro
- Miami-Fort Lauderdale-Pompano Beach, FL
- State GDP YoY
- ▲ 3.28%
- F500 in state
- 36
Industry mix (Fortune 500 HQ in FL)
| Industry | F500 HQs | Revenue |
|---|---|---|
| Industrial Technology | 2 | $29B |
|
||
| Insurance | 2 | $17B |
|
||
| Retail | 1 | $60B |
|
||
| Technology Distribution | 1 | $58B |
|
||
| Homebuilding | 1 | $35B |
|
||
| Technology Manufacturing | 1 | $35B |
|
||
Price history
+339.8% since first listed3 events — show timeline
- 2026-05-12 Price Changed $650,000 Beaches MLS
- 2026-04-24 Listed $750,000 Beaches MLS
- 1994-06-29 Sold (Public Records) $147,800 Public Records
Property tax history
+1.1%/yrLatest (2025): $2,994 · +3.3% YoY. Source: county tax records.
Cash-flow waterfall
monthlySold comps — $/sqft
last 12 mo · ≤1 miLoading sold comps…