438 S Allen St · Centralia, MO
Flood risk 1/10 · Minimal
- FEMA flood zone
- X (unshaded)
- Chance of flooding over 30 yrs
- 0.0%
- Est. flood insurance / yr
- $473 – $860
Fire risk 1/10 · Minimal
- Est. fire insurance / yr
- $1,054 – $1,958
Heat risk 3/10 · Minor
- Hot days now (above 106°F)
- 7 days/yr
- Hot days in 30 yrs
- 18 days/yr
Wind risk 2/10 · Minimal
- Chance of severe wind over 30 yrs
- —
Air-quality risk 2/10 · Minimal
- Unhealthy air days now
- 1 days/yr
- Unhealthy air days in 30 yrs
- 1 days/yr
Risk factors via First Street. Map © Google.
Why this score? — see what drove the B- grade
The composite is a weighted blend of 9 inputs, each scored 0–100. Each bar is that input's sub-score; the figure is the points it added to the 100-point composite (weight × sub-score).
- Cash flow +30.0/30.0
- 1% rule +10.0/10.0
- DSCR +10.0/10.0
- ARV discount +7.5/15.0
- Schools +3.9/10.0
- Livability +3.5/5.0
- Rent growth +2.5/5.0
- Condition / age +2.5/5.0
- Appreciation +0.0/10.0
$35,000
🖨 Deal sheet (PDF) 📄 Offer letter ✓ Due diligence
Listing remarks
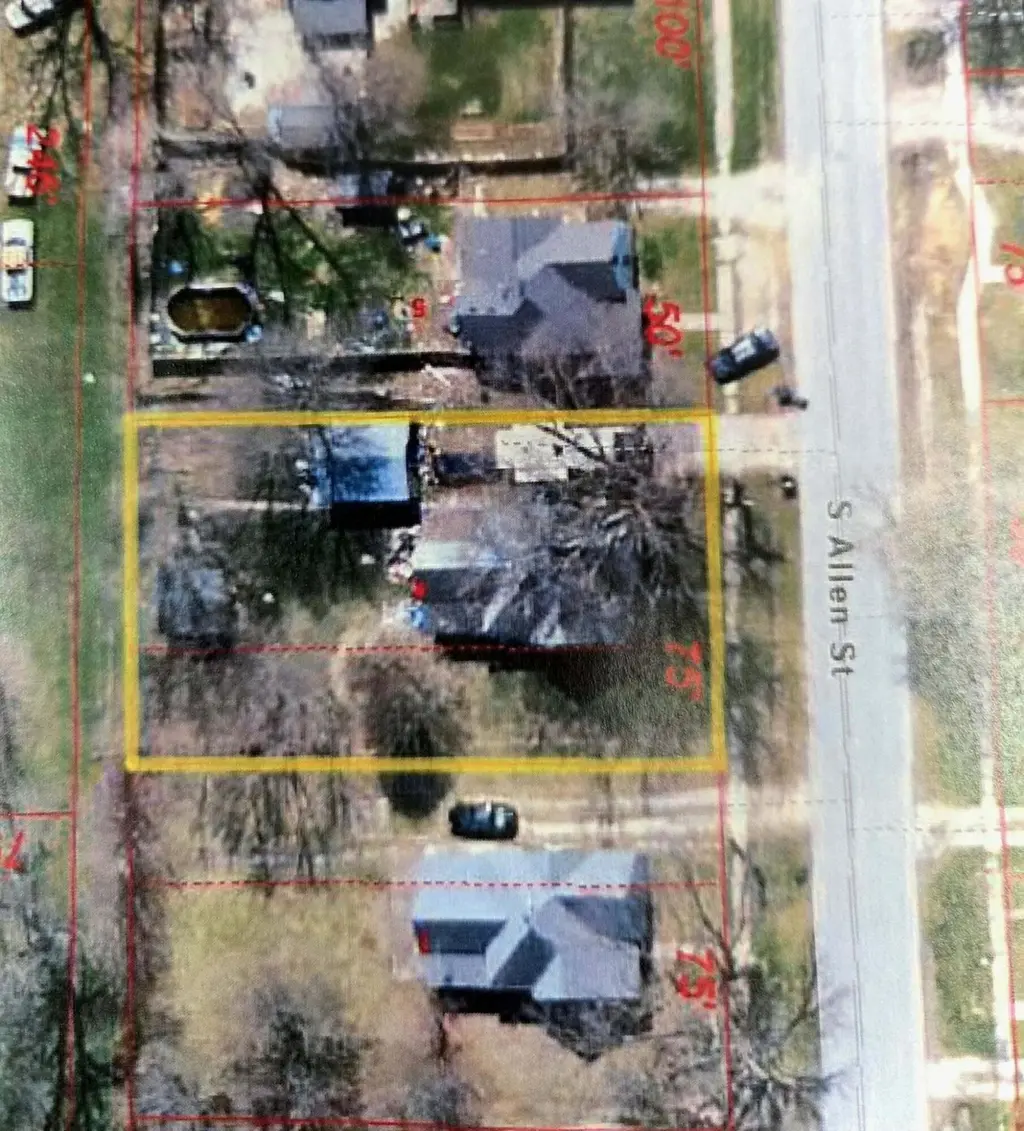
Looking to build? This 75 x 127 lot could be just the spot! Existing dwelling will need to be removed. Great location near downtown, schools and recreational center.
Key facts
- 75 x 127 lot
- 9,525 sq ft lot
- Garage
Tags
Property features AI
Finance
- Financial info: Annual tax amount listed
Exterior
- Parking: Detached garage
- Home design: Single-family residence; Residential property
- Exterior features: West-facing lot; Lot measures approximately 75 x 127 feet (0.22 acres); Zoned R-1 One-Family Dwelling; Located in CENTRALIA ORIGINAL TOWN subdivision
Interior
- Bathrooms: 1 full bathroom
- Interior features: Crawl space basement
Neighborhood map
What this means for you Summary
Snapshot
- This is a 2-bed/1.0-bath single-family listed at $35k.
Deal economics
- At list price, monthly cash flow is $485 ($6k/yr) — positive.
- The deal already cash-flows at list — no discount required.
- Meets the 1% rule at list price ($951 rent vs $35k).
- Cap rate 22.9% vs local median 2.8% in Centralia — top-decile yield for the area; either an underpriced asset or a hidden risk that comps aren't pricing in. Stress-test before assuming the spread holds.
Location & tenants
- Location reads 70/100 on livability (#127 in MO) — a middle-class / working-renter tenant base. Strengths: crime A+, cost of living A+, housing A+; Watch: amenities F, commute F, health & safety F.
- Centralia R-VI (town): math 43% / reading 48% proficiency, ranked #82 of 324 in MO (top 25%) — families likely to look elsewhere, expect single-tenant / working-renter base with shorter leases.
- Zoned schools: Centralia Intermediate (math 40% / reading 50%, grade D-, #410 of 1,115 statewide, top 37%, 305 students, 32% FRL); Centralia High (math 52% / reading 62%, grade C, #51 of 521 statewide, top 11%, 406 students, 26% FRL) — zoned schools at 29% FRL track the district average.
- Market conditions: 71 active listings in the ZIP; 1,303 units permitted in Boone County in 2024 (549 in 5+ unit buildings).
Forward outlook
- Local home prices are declining (-3.0%/yr); year-one equity from $242 of loan paydown is wiped out by about $1k of value loss. Plan a longer hold.
- Boone County population projected at +36% by 2050 — long-run rental-demand tailwind backs the buy-and-hold thesis.
- At projected returns (-3.0% appreciation + 3.0% rent growth), your $10k cash investment doubles in ~2 years — after that, you're playing with house money.
Negotiation context
- Only 6 days on market — expect competitive offers; lowballing is unlikely to land.
Risks & watch-outs
- Watch-outs: built in 1900 — expect roof / HVAC / electrical / plumbing capex.
Questions for the listing agent
- Built in 1900 — when were the roof, HVAC, electrical panel, plumbing, and water heater last replaced?
- Is there a deadline driving the sale (1031 exchange, divorce, estate, relocation)? That informs how much negotiation room exists.
- Schools are B-rated — typically a magnet for longer-tenancy family renters. What's the average tenant stay here, and is there a school-zone premium baked into asking?
- What's the average days-on-market for RENTAL listings here right now (not sales)? A rising rental-DOM trend means longer vacancies and softer asking-rent achievability than the comps imply.
- What's the recent tenant-quality profile in this submarket — average credit score on applications, eviction rate, late-payment / NSF rate, and stable-employment percentage? A property-management company in the area should have these aggregated.
- How much new for-sale + rental construction is in the pipeline within 1–3 miles? Heavy new supply typically softens prices + rents 12–24 months out; constrained supply supports both.
Investment metrics
- 1% rule
- 2.72% ✓
- Cap rate
- 22.93%
- Cash-on-cash
- 59.41%
- DSCR
- 3.64
- GRM
- 3.1
CMA / ARV
- ARV (on-the-fly)
- $191,418
- Comps found
- 12
Show comp detail 12 sales within ~0.75 mi
| Address | Dist | Beds/Ba | Sqft | Sold | Price | $/sf | Match |
|---|---|---|---|---|---|---|---|
| 627 S Central St | 0.31mi | 2/1.0 | 1,008 (-4%) | 0mo | $150,000 | $149 | 80 |
| 224 W Bruton St | 0.12mi | 3/1.0 (+1) | 1,000 (-4%) | 4mo | $130,000 | $130 | 78 |
| 506 W Singleton St | 0.38mi | 2/2.0 | 1,056 (+1%) | 1mo | $199,500 | $189 | 76 |
| 112 S Columbia St | 0.36mi | 2/1.0 | 1,004 (-4%) | 4mo | $45,000 | $45 | 73 |
| 445 S Rollins St | 0.07mi | 2/1.0 | 896 (-14%) | 1mo | $167,500 | $187 | 72 |
| 200 Reed St | 0.31mi | 3/1.0 (+1) | 1,097 (+5%) | 3mo | $194,799 | $178 | 70 |
| 238 S Denton St | 0.31mi | 2/1.0 | 936 (-10%) | 2mo | $205,000 | $219 | 67 |
| 119 S Denton St | 0.42mi | 3/2.0 (+1) | 1,090 (+4%) | 0mo | $199,900 | $183 | 64 |
| 614 S Rollins St | 0.24mi | 2/1.0 | 896 (-14%) | 2mo | $35,000 | $39 | 63 |
| 212 Alco St | 0.43mi | 2/2.0 | 1,153 (+10%) | 0mo | $235,500 | $204 | 59 |
| 760 Tidball Ave | 0.35mi | 3/2.0 (+1) | 1,192 (+14%) | 2mo | $205,000 | $172 | 50 |
| 511 E Southgate St | 0.73mi | 2/2.0 | 952 (-9%) | 1mo | $205,000 | $215 | 46 |
Match score weights: distance 35% · size 25% · config 20% · recency 20%. Top-matched comps best support the ARV.
Projected returns pro-forma
-3.0% appreciation · 3.0% rent growth · sell at horizon
- IRR
- 58.1%
- Equity multiple
- 3.58×
- Total profit
- $25,259
- Equity at exit
- $5,219
- IRR
- 63.0%
- Equity multiple
- 7.32×
- Total profit
- $61,905
- Equity at exit
- $3,026
Cash invested: $9,800 (down + closing). Projections, not guarantees.
Landlord ↔ Tenant lean methodology
- Overall (STATE)
- 81 Strongly Landlord-Friendly
- State Missouri
- 81 Strongly Landlord-Friendly · R+10
- County
- — inherits STATE
- City
- — inherits STATE
ZIP-level market 65240
- Home prices YoY
- -20.6%
- Active inventory
- 71
- Price-to-rent
- 3.1×
Monthly cashflow live
- Estimated rent
- $951 medium interval (Pro) →
- Mortgage (P&I)
- −$184
- Tax from tax record
- −$68 /mo · $817/yr
- Insurance
- −$15
- HOA
- −$0
- Vacancy / Maint / Mgmt
- −$200
- Net cashflow
- $485
Break-even live
Sensitivity live
| Price | -10% $505 | -5% $495 | +0% $485 | +5% $475 | +10% $465 |
|---|---|---|---|---|---|
| Rent | -10% $410 | -5% $448 | +0% $485 | +5% $523 | +10% $560 |
| Rate | -1.0pp $503 | -0.5pp $494 | base $485 | +0.5pp $476 | +1.0pp $467 |
UW: 25.0% down · 7.5% · 30yr · 1.5% tax · 5.0% vac · 8.0% maint · 8.0% mgmt
Financing live
Cash to close
- Down payment
- $8,750
- Closing costs
- $1,050
- Reserves months
- —
- Total cash needed
- —
Loan-product check · same deal, 3 products live
Conventional
25% down · 7.5% · 30yr
- Down + closing
- —
- Monthly P&I
- —
- Monthly cashflow
- —
- DSCR
- —
- Eligible?
- —
Personal DTI + credit; lowest rate.
DSCR
20% down · 8.5% · 30yr
- Down + closing
- —
- Monthly P&I
- —
- Monthly cashflow
- —
- DSCR
- —
- Eligible?
- —
No personal income docs; deal must DSCR.
Hard money
10% down · 12.0% · 12mo
- Down + closing
- —
- Monthly P&I
- —
- Monthly cashflow
- —
- DSCR
- —
- Eligible?
- —
Short-term bridge; refi at stabilization.
Listing history 2 events
-
2026-05-21$35,000 Active
-
2006-01-10soldstatus
ⓘ Source: listings_history table (triggers on properties + properties_extension) + one-shot
backfill from property_details.listing_events for pre-trigger history.
Tax reassessment forecast MO · Resets to sale price
- Current annual tax
- $817 · $68/mo
- Projected year-2 tax
- $817 · $68/mo
- Expected delta
- $0/yr ($0/mo · 0.0%)
ⓘ Screening estimate from a state-policy table — verify with the county assessor before closing.
Climate risk First Street
- Flood 1/10 Low FEMA zone X (unshaded) · 0% chance over 30 yrs
- Wildfire 1/10 Low
- Heat 3/10 Moderate 7 d/yr ≥106°F today · 18 d/yr by 30 yrs out
- Wind 2/10 Low
- Air quality 2/10 Low 1 unhealthy d/yr today · 1 by 30 yrs out
Nearby sold comps map
Loading sold comps map…
Walkable amenities ~0.75 mi
Loading nearby amenities…
Taxation est. · year 1
- Rental income
- $11,414
- − Mortgage interest
- −$1,961
- − Property taxes
- −$817
- − Insurance
- −$175
- − Repairs & maintenance
- −$913
- − Management
- −$913
- − Depreciation
- −$1,018
- Taxable income
- $5,617
- Est. tax owed @ 24.0%
- −$1,348
- After-tax cash flow
- $4,474/yr
For passive investors: Depreciation is non-cash, so a rental often shows a tax loss while cash-flowing — sheltering income. Rental losses are passive: they offset passive income freely, and up to $25,000/yr can offset ordinary (W-2) income if you actively participate and your MAGI is under $100k (phasing out to $0 by $150k); unused losses carry forward. On sale, claimed depreciation is recaptured at up to 25%, and gains may owe capital-gains tax (a 1031 exchange can defer both). Figures are a year-1 estimate at your 24.0% rate — not tax advice; consult a CPA.
Schools (NCES district)
- District
- Centralia R-VI
- NCES district ID
- 2908400
- Math proficiency
- 43% ▼ -7.00%
- Reading proficiency
- 48% ▼ -8.00%
- Median HH income
- $50,465
- Composite
- 39.08/100
- National rank
- #4048
- State rank
- #82 of 324 in MO
Livability — Centralia
- Score
- 70/100
- State rank
- #127
- US rank
- #7477
Category grades
Schools grade is shown separately in the Schools card above.
Census & demographics
- Census place
- Centralia, MO
- City population
- 8,740
- Population (ZIP)
- 8,740
Population outlook (Boone County) Hauer SSP2
- Today (2025)
- 202,891 people
- By 2030
- 217,799 · +7.3%
- By 2040
- 246,789 · +21.6%
- By 2050
- 276,116 · +36.1%
- By 2075
- 348,426 · +71.7%
- By 2100
- 400,856 · +97.6%
Race, ethnicity, and origin ACS 2023
- Neighborhood character
- Predominantly White (92%)
- Race & ethnicity
- White 92% Two or more races 7% Hispanic / Latino 2%
- Common ancestry
- Italian 4% Slovak 2% Lithuanian 2%
- Foreign-born
- 1%
Political lean MEDSL · Boone
- 2024 margin
- Lean D (+9.8) · D 53.9% · R 44.1% · Other 2.1%
- 2008→2024 swing
- -2.2pp toward R · 2008: 12.0pp · 2024: 9.8pp
- All cycles
- 2024: D+9.8 2020: D+12.5 2016: D+5.9 2012: D+3.1 2008: D+12.0
Not yet ingested
- Civics
- —
Market trends
- HPI YoY
- ▼ -65.18%
- Current HPI
- 251.817
- Rent YoY
- —
- Metro
- —
- State GDP YoY
- ▲ 1.84%
- F500 in state
- 20
Industry mix (Fortune 500 HQ in MO)
| Industry | F500 HQs | Revenue |
|---|---|---|
| Healthcare | 1 | $163B |
|
||
| Insurance | 1 | $21B |
|
||
| Industrial Technology | 1 | $17B |
|
||
| Retail | 1 | $16B |
|
||
| Industrial Distribution | 1 | $10B |
|
||
| Utilities | 1 | $9B |
|
||
Price history
2 events — show timeline
- 2026-05-21 Listed $35,000 CBORMLS
- 2006-01-10 Sold (Public Records) — Public Records
Property tax history
+3.2%/yrLatest (2025): $817 · +14.2% YoY. Source: county tax records.
Cash-flow waterfall
monthlySold comps — $/sqft
last 12 mo · ≤1 miLoading sold comps…