 🏷️ Likely Rental
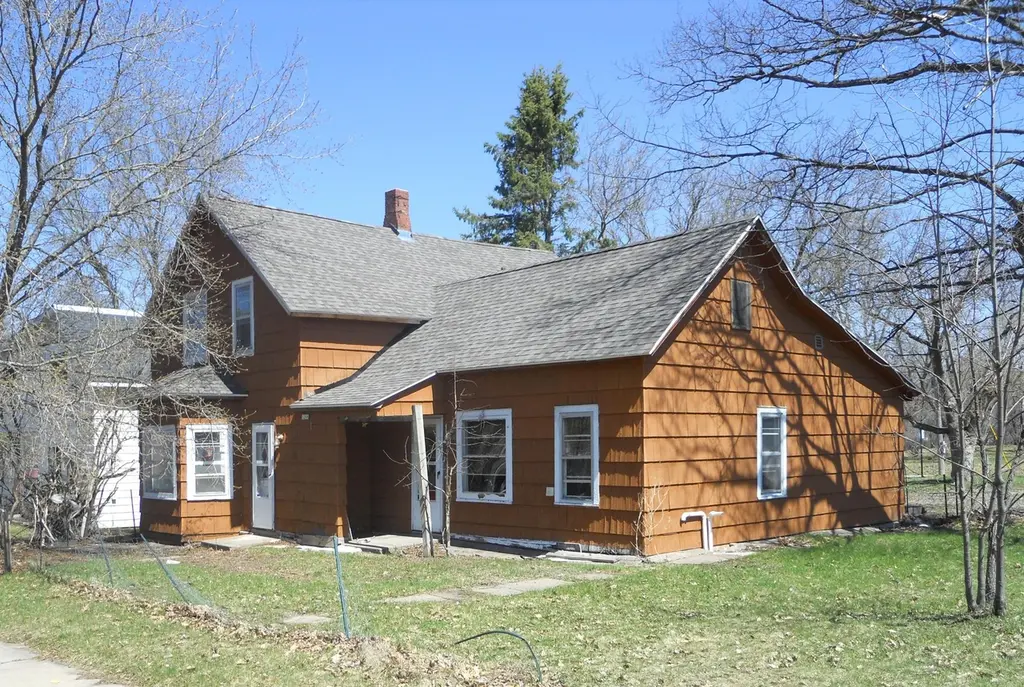
1208 Mason St · Rhinelander, WI
Flood risk 1/10 · Minimal
- FEMA flood zone
- X (unshaded)
- Chance of flooding over 30 yrs
- 0.0%
- Est. flood insurance / yr
- $473 – $860
Fire risk 3/10 · Minor
- Est. fire insurance / yr
- $636 – $1,182
Heat risk 1/10 · Minimal
- Hot days now (above 92°F)
- 7 days/yr
- Hot days in 30 yrs
- 13 days/yr
Wind risk 1/10 · Minimal
- Chance of severe wind over 30 yrs
- —
Air-quality risk 1/10 · Minimal
- Unhealthy air days now
- 0 days/yr
- Unhealthy air days in 30 yrs
- 0 days/yr
Risk factors via First Street. Map © Google.
Why this score? — see what drove the B- grade
The composite is a weighted blend of 9 inputs, each scored 0–100. Each bar is that input's sub-score; the figure is the points it added to the 100-point composite (weight × sub-score).
- Cash flow +25.7/30.0
- ARV discount +15.0/15.0
- DSCR +8.6/10.0
- 1% rule +7.0/10.0
- Livability +3.9/5.0
- Schools +2.7/10.0
- Rent growth +2.5/5.0
- Condition / age +2.5/5.0
- Appreciation +0.0/10.0
$99,000
🖨 Deal sheet 📄 Offer letter ✓ Due diligence
Listing remarks MLS
City Triplex close to Hodag Park. Features 2 - One Bedroom Apartments, and 1 - Two Bedroom Apartment. Rents are 450.00, 450.00, and 500.00. Rents have been the same for 7 years. Good income potential. There is a dry basement which 2 apartments can use. Leases are month to month. Seller is paying water and gas bill. Tenants pay electric.
Key facts
- Prime location
- Multi-unit property
- Near hodag park
Tags
Property features AI
Exterior
- Parking: No garage
- Utilities: Public water; Public sewer
- Home design: Residential income property; Triplex
- Construction: Frame construction
- Exterior features: City street frontage; Road maintained by public agencies
Interior
- Heating & cooling: Natural gas heating
- Interior features: No fireplace
Neighborhood map
What this means for you Summary
Snapshot
- This is a other listed at $99k.
Deal economics
- At list price, monthly cash flow is $237 ($3k/yr) — positive.
- The deal already cash-flows at list — no discount required.
- Meets the 1% rule at list price ($1k rent vs $99k).
- Recommended offer: $96k (3.0% below list) — sets the bar for market timing.
- Cap rate 9.2% vs local median 3.9% in Rhinelander — top-decile yield for the area; either an underpriced asset or a hidden risk that comps aren't pricing in. Stress-test before assuming the spread holds.
Location & tenants
- Location reads 77/100 on livability (#112 in WI, #2,876 nationally) — a middle-class / working-renter tenant base. Strengths: cost of living A+, housing A+, health & safety A+; Watch: employment D+, schools F, amenities F.
- Rhinelander School District (rural): math 31% / reading 31% proficiency, ranked #266 of 342 in WI (top 78%) — families likely to look elsewhere, expect single-tenant / working-renter base with shorter leases.
- Market conditions: 113 active listings in the ZIP; 3 comparable units currently listed for rent nearby; rentals lingering (median 44d on market — plan ~5-8 weeks vacancy on turnover, expect pricing pressure); 100% of comp listings sitting > 30 days — soft ceiling on asking rent; 307 units permitted in Oneida County in 2024 (0 in 5+ unit buildings).
Forward outlook
- Local home prices are declining (-3.0%/yr); year-one equity from $684 of loan paydown is wiped out by about $3k of value loss. Plan a longer hold.
- Oneida County population projected at -20% by 2050 — secular population decline; favor cash flow + early exit over multi-decade hold.
Negotiation context
- It's been on market 51 days — a 3% lower offer ($96k) is reasonable based on typical stale-listing flexibility.
- 5 sale attempts since 26y ago with the ask held roughly flat each time — persistent listings suggest the price (not the market) is what's stuck; bring a comps-based counter.
- Current owner paid $85k; 16% above their basis — modest negotiation headroom, anchor on the comps not their cost.
Questions for the listing agent
- It's been on market 51 days. Have you received any prior offers? Is the seller open to a 3% concession, seller financing, or rate buy-down credit?
- Is there a deadline driving the sale (1031 exchange, divorce, estate, relocation)? That informs how much negotiation room exists.
- Schools are F-rated, which usually means shorter tenancies and higher turnover. Who's the typical renter profile here, and what's been the actual vacancy rate?
- What's the average days-on-market for RENTAL listings here right now (not sales)? A rising rental-DOM trend means longer vacancies and softer asking-rent achievability than the comps imply.
- What's the recent tenant-quality profile in this submarket — average credit score on applications, eviction rate, late-payment / NSF rate, and stable-employment percentage? A property-management company in the area should have these aggregated.
- How much new for-sale + rental construction is in the pipeline within 1–3 miles? Heavy new supply typically softens prices + rents 12–24 months out; constrained supply supports both.
Investment metrics
- 1% rule
- 1.20% ✓
- Cap rate
- 9.16%
- Cash-on-cash
- 10.25%
- DSCR
- 1.46
- GRM
- 6.9
CMA / ARV
- ARV (median comp)
- $152,297
- List price
- $99,000
- Delta
- -35.00%
- Verdict
- UNDERPRICED
- Comps
- 14 within 1.0 mi
Projected returns pro-forma
-3.0% appreciation · 3.0% rent growth · sell at horizon
- IRR
- -0.9%
- Equity multiple
- 0.97×
- Total profit
- $-931
- Equity at exit
- $14,761
- IRR
- 8.8%
- Equity multiple
- 1.68×
- Total profit
- $18,732
- Equity at exit
- $8,560
Cash invested: $27,720 (down + closing). Projections, not guarantees.
Landlord ↔ Tenant lean methodology
- Overall (STATE)
- 73 Landlord-Friendly
- State Wisconsin
- 73 Landlord-Friendly · R+2
- County
- — inherits STATE
- City
- — inherits STATE
ZIP-level market 54501
- Active inventory
- 113
- Price-to-rent
- 6.9×
Monthly cashflow live
- Estimated rent
- $1,191 medium interval (Pro) →
- Mortgage (P&I)
- −$519
- Tax from tax record
- −$144 /mo · $1,727/yr
- Insurance
- −$41
- HOA
- −$0
- Vacancy / Maint / Mgmt
- −$250
- Net cashflow
- $237
Break-even live
UW: 25.0% down · 7.5% · 30yr · 1.5% tax · 5.0% vac · 8.0% maint · 8.0% mgmt
Financing live
Cash to close
- Down payment
- $24,750
- Closing costs
- $2,970
- Reserves months
- —
- Total cash needed
- —
Loan-product check · same deal, 3 products live
Conventional
25% down · 7.5% · 30yr
- Down + closing
- —
- Monthly P&I
- —
- Monthly cashflow
- —
- DSCR
- —
- Eligible?
- —
Personal DTI + credit; lowest rate.
DSCR
20% down · 8.5% · 30yr
- Down + closing
- —
- Monthly P&I
- —
- Monthly cashflow
- —
- DSCR
- —
- Eligible?
- —
No personal income docs; deal must DSCR.
Hard money
10% down · 12.0% · 12mo
- Down + closing
- —
- Monthly P&I
- —
- Monthly cashflow
- —
- DSCR
- —
- Eligible?
- —
Short-term bridge; refi at stabilization.
Rent comps 3 comps
| Address | Beds | Baths | Sqft | Rent | $/sqft | DOM | Units | Dist |
|---|---|---|---|---|---|---|---|---|
| 942 N Stevens St Rhinelander, WI | 2.0 | 1.0 | 800 | $1,275 | $1.59 | 43d | 1 | 0.26mi |
| 28 N Brown St Rhinelander, WI | 1.0 | 1.0 | 454 | $725 | $1.60 | 43d | 4 | 0.97mi |
| 224 Maple Park Dr Rhinelander, WI | 3.0 | 1.5 | 1000 | $1,375 | $1.38 | 43d | 1 | 1.18mi |
Listing history 28 events
-
2026-06-18days on market $99,000 Active 51 DOM
-
2026-06-17days on market $99,000 Active 50 DOM
-
2026-06-16days on market $99,000 Active 49 DOM
-
2026-06-15days on market $99,000 Active 48 DOM
-
2026-06-15days on market $99,000 Active 47 DOM
-
2026-06-13days on market $99,000 Active 46 DOM
-
2026-06-12days on market $99,000 Active 45 DOM
-
2026-06-09days on market $99,000 Active 42 DOM
-
2026-06-08days on market $99,000 Active 41 DOM
-
2026-06-08days on market $99,000 Active 40 DOM
-
2026-06-07days on market $99,000 Active 39 DOM
-
2026-06-03days on market $99,000 Active 36 DOM
-
2026-06-02days on market $99,000 Active 35 DOM
-
2026-06-01days on market $99,000 Active 34 DOM
-
2026-05-31days on market $99,000 Active 33 DOM
-
2026-04-28$99,000 Active 604-char remark
-
2022-04-29soldstatus $85,000
-
2022-04-28soldstatus $85,000 338-char remark
Show marketing remark (338 chars)
City Triplex close to Hodag Park. Features 2 - One Bedroom Apartments, and 1 - Two Bedroom Apartment. Rents are 450.00, 450.00, and 500.00. Rents have been the same for 7 years. Good income potential. There is a dry basement which 2 apartments can use. Leases are month to month. Seller is paying water and gas bill. Tenants pay electric.
-
2022-03-14$79,900 338-char remark
Show marketing remark (338 chars)
City Triplex close to Hodag Park. Features 2 - One Bedroom Apartments, and 1 - Two Bedroom Apartment. Rents are 450.00, 450.00, and 500.00. Rents have been the same for 7 years. Good income potential. There is a dry basement which 2 apartments can use. Leases are month to month. Seller is paying water and gas bill. Tenants pay electric.
-
2015-05-28soldstatus $19,500
-
2015-05-26soldstatus $19,500
Show marketing remark (563 chars)
Triplex located close to Hodag Park and within walking distance to town. At one time this rental property produced a good cash flow. There is a 2 bedroom 1 bath upper unit and 2 -1 bedroom/bath lower units. Both lower units have access to the basement that is set up for laundry facilities. The upper unit is currently rented for $500 per month and tenant pays heat/electric bill. (Three separate electric meters, Landlord pays water utilities. ) With some TLC this property could be restored to be an investment property and bring in a good cash flow once again.
-
2015-04-20$24,500
Show marketing remark (563 chars)
Triplex located close to Hodag Park and within walking distance to town. At one time this rental property produced a good cash flow. There is a 2 bedroom 1 bath upper unit and 2 -1 bedroom/bath lower units. Both lower units have access to the basement that is set up for laundry facilities. The upper unit is currently rented for $500 per month and tenant pays heat/electric bill. (Three separate electric meters, Landlord pays water utilities. ) With some TLC this property could be restored to be an investment property and bring in a good cash flow once again.
-
2003-07-08soldstatus $82,000
-
2003-04-28$89,000
-
2000-07-24soldstatus $50,000
-
2000-07-21soldstatus $50,000
-
2000-06-08$57,000
-
2000-02-08soldstatus $49,900
ⓘ Source: listings_history table (triggers on properties + properties_extension) + one-shot
backfill from property_details.listing_events for pre-trigger history.
Tax reassessment forecast WI · Partial reset (capped growth)
- Current annual tax
- $1,727 · $144/mo
- Projected year-2 tax
- $1,779 · $148/mo
- Expected delta
- +$52/yr (+$4/mo · 3.0%)
ⓘ Screening estimate from a state-policy table — verify with the county assessor before closing.
Climate risk First Street
- Flood 1/10 Low FEMA zone X (unshaded) · 0% chance over 30 yrs
- Wildfire 3/10 Moderate
- Heat 1/10 Low 7 d/yr ≥92°F today · 13 d/yr by 30 yrs out
- Wind 1/10 Low
- Air quality 1/10 Low 0 unhealthy d/yr today · 0 by 30 yrs out
Nearby sold comps map
Loading sold comps map…
Walkable amenities ~0.75 mi
Loading nearby amenities…
Taxation est. · year 1
- Rental income
- $14,295
- − Mortgage interest
- −$5,546
- − Property taxes
- −$1,727
- − Insurance
- −$495
- − Repairs & maintenance
- −$1,144
- − Management
- −$1,144
- − Depreciation
- −$2,880
- Taxable income
- $1,361
- Est. tax owed @ 24.0%
- −$327
- After-tax cash flow
- $2,515/yr
For passive investors: Depreciation is non-cash, so a rental often shows a tax loss while cash-flowing — sheltering income. Rental losses are passive: they offset passive income freely, and up to $25,000/yr can offset ordinary (W-2) income if you actively participate and your MAGI is under $100k (phasing out to $0 by $150k); unused losses carry forward. On sale, claimed depreciation is recaptured at up to 25%, and gains may owe capital-gains tax (a 1031 exchange can defer both). Figures are a year-1 estimate at your 24.0% rate — not tax advice; consult a CPA.
Schools (NCES district)
- District
- Rhinelander School District
- NCES district ID
- 5512720
- Math proficiency
- 31% ▼ -2.00%
- Reading proficiency
- 31% ▼ -1.00%
- Median HH income
- $47,165
- Composite
- 26.77/100
- National rank
- #7130
- State rank
- #266 of 342 in WI
Livability — Rhinelander
- Score
- 77/100
- State rank
- #112
- US rank
- #2876
Category grades
Schools grade is shown separately in the Schools card above.
Census & demographics
- Census place
- Rhinelander, WI
- Population (ZIP)
- 21,096
Population outlook (Oneida County) Hauer SSP2
- Today (2025)
- 34,468 people
- By 2030
- 33,373 · -3.2%
- By 2040
- 30,391 · -11.8%
- By 2050
- 27,438 · -20.4%
- By 2075
- 23,041 · -33.2%
- By 2100
- 18,405 · -46.6%
Race, ethnicity, and origin ACS 2023
- Neighborhood character
- Predominantly White (94%)
- Race & ethnicity
- White 94% Two or more races 4% Hispanic / Latino 2%
- Common ancestry
- Romanian 9% Portuguese 6% Lithuanian 2%
- Foreign-born
- 1% · Canada
- Languages at home
- 98% English-only · Spanish 1% Other Asian/Pacific 1%
Political lean MEDSL · Oneida
- 2024 margin
- R (+17.6) · D 40.6% · R 58.2% · Other 1.2%
- 2008→2024 swing
- -28.0pp toward R · 2008: 10.4pp · 2024: -17.6pp
- All cycles
- 2024: R+17.6 2020: R+14.8 2016: R+17.1 2012: R+2.2 2008: D+10.4
Not yet ingested
- Civics
- —
Market trends
- HPI YoY
- ▼ -187.57%
- Current HPI
- 179.0345
- Rent YoY
- —
- Metro
- —
- State GDP YoY
- ▲ 2.10%
- F500 in state
- 20
Industry mix (Fortune 500 HQ in WI)
| Industry | F500 HQs | Revenue |
|---|---|---|
| Industrial Machinery | 4 | $23B |
|
||
| Industrial Technology | 2 | $36B |
|
||
| Insurance | 1 | $36B |
|
||
| Professional Services | 1 | $19B |
|
||
| Utilities | 1 | $9B |
|
||
| Consumer Goods | 1 | $3B |
|
||
Price history
+98.4% since first listed13 events — show timeline
- 2026-04-28 Listed $99,000 GNMLS
- 2022-04-29 Sold (Public Records) $85,000 Public Records
- 2022-04-28 Sold (MLS) $85,000 GNMLS
- 2022-03-14 Listed $79,900 GNMLS
- 2015-05-28 Sold (Public Records) $19,500 Public Records
- 2015-05-26 Sold (MLS) $19,500 GNMLS
- 2015-04-20 Listed $24,500 GNMLS
- 2003-07-08 Sold (Public Records) $82,000 Public Records
- 2003-04-28 Listed $89,000 GNMLS
- 2000-07-24 Sold (MLS) $50,000 GNMLS
- 2000-07-21 Sold (Public Records) $50,000 Public Records
- 2000-06-08 Listed $57,000 GNMLS
- 2000-02-08 Sold (Public Records) $49,900 Public Records
Property tax history
+0.4%/yrLatest (2025): $1,727 · +14.5% YoY. Source: county tax records.
Cash-flow waterfall
monthlySold comps — $/sqft
last 12 mo · ≤1 miLoading sold comps…