982 E Lassen Ave #20 · Chico, CA
Flood risk 1/10 · Minimal
- FEMA flood zone
- X (shaded)
- Chance of flooding over 30 yrs
- 0.0%
- Est. flood insurance / yr
- $507 – $1,088
Fire risk 7/10 · Major
- Est. fire insurance / yr
- $659 – $1,223
Heat risk 8/10 · Major
- Hot days now (above 105°F)
- 4 days/yr
- Hot days in 30 yrs
- 10 days/yr
Wind risk 1/10 · Minimal
- Chance of severe wind over 30 yrs
- —
Air-quality risk 10/10 · Severe
- Unhealthy air days now
- 37 days/yr
- Unhealthy air days in 30 yrs
- 39 days/yr
Risk factors via First Street. Map © Google.
Why this score? — see what drove the B grade
The composite is a weighted blend of 9 inputs, each scored 0–100. Each bar is that input's sub-score; the figure is the points it added to the 100-point composite (weight × sub-score).
- Cash flow +30.0/30.0
- 1% rule +10.0/10.0
- DSCR +10.0/10.0
- ARV discount +10.0/15.0
- Schools +4.6/10.0
- Livability +3.6/5.0
- Rent growth +2.9/5.0
- Condition / age +2.5/5.0
- Appreciation +0.0/10.0
$59,000
🖨 Deal sheet 📄 Offer letter ✓ Due diligence
Listing remarks MLS
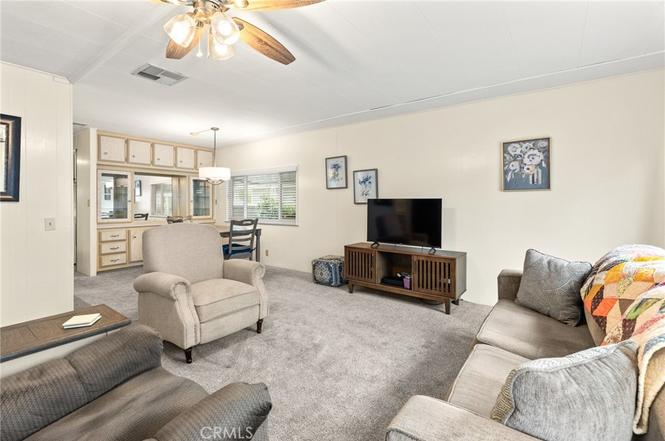
Looking for a place you'll truly enjoy calling home? This could be it! Nestled in the Coach House Mobile Estates, a senior (55+) community in Chico, this mobile home offers both comfort and convenience. The community features great amenities, including a pool, clubhouse, and RV parking. Thoughtfully upgraded in 2021, enhancing its overall functionality and appeal—These improvements included a new Heating & Air system, enhanced insulation, a re-sealed roof, and updated kitchen and bathroom fixtures. This charming home has been well cared for and retains a welcoming atmosphere. Move-in ready and waiting for its next owner—opportunities like this don’t come around often!
Key facts
- New gas range
- Built in microwave
- Inground pool
Tags
Property features AI
Finance
- Other: Park name: Coach House Mobile Estates; Directions: Enter Coach House Mobile Home Park from E. Lassen, go left at the office and right at the pool
- Financial info: Assessments: Unknown
- HOA & community: Land lease community — land lease amount $650; Community features include street lighting and shared pool
Exterior
- Parking: Carport; Has parking
- Security: Carbon monoxide detector(s); Smoke detector(s)
- Utilities: Public/district water; Sewer or septic (unknown)
- Home design: Mobile home (10' x 52') — mobile home remains; Single-story; Located in a senior community (Coach House Mobile Estates)
- Construction: Information sourced from assessor; Living area per assessor
- Exterior features: Covered patio; In-ground gunite community pool; Shed on property; View
Interior
- Kitchen: Gas range; Self-cleaning oven; Microwave; Dishwasher; Garbage disposal; Ice maker; Water line to refrigerator; Formica counters
- Bedrooms: Not specified
- Flooring: Vinyl flooring; Carpet
- Bathrooms: 1 full bathroom with bathtub and separate shower
- Heating & cooling: Central cooling; Forced air / central furnace heating
- Interior features: One-level home; Turnkey condition; Carbon monoxide and smoke detectors; Double-pane windows with drapes/curtains and screens; Covered entry/patio
- Laundry & utility: Washer and dryer included; Washer hookup; Gas and electric dryer hookup; Laundry located inside in an individual room
Neighborhood map
What this means for you Summary
Snapshot
- This is a 2-bed/2.0-bath manufactured listed at $59k.
Deal economics
- At list price, monthly cash flow is $819 ($10k/yr) — positive.
- The deal already cash-flows at list — no discount required.
- Meets the 1% rule at list price ($2k rent vs $59k).
- Cap rate 22.9% vs local median 2.6% in Chico — top-decile yield for the area; either an underpriced asset or a hidden risk that comps aren't pricing in. Stress-test before assuming the spread holds.
Location & tenants
- Location reads 72/100 on livability (#195 in CA) — a middle-class / working-renter tenant base. Strengths: amenities A+, commute A+, health & safety A-; Watch: employment C-, crime F, cost of living F.
- Chico Unified (urban): math 40% / reading 70% proficiency, ranked #117 of 517 in CA (top 23%) — acceptable for families but not a draw, mixed tenant base, ~2y average lease.
- Market conditions: Rents rising (+1.7%/yr); 151 active listings in the ZIP; 35 comparable units currently listed for rent nearby; rentals at typical pace (median 21d on market — plan ~3-4 weeks tenant-placement turnaround); 43% of comp listings sitting > 30 days — soft ceiling on asking rent; solid renter incomes; 946 units permitted in Butte County in 2024 (254 in 5+ unit buildings).
Forward outlook
- Local home prices are declining (-3.0%/yr); year-one equity from $408 of loan paydown is wiped out by about $2k of value loss. Plan a longer hold.
- Butte County population projected at +10% by 2050 — modest demand growth; plan on rents tracking national, not racing it.
- At projected returns (-3.0% appreciation + 1.7% rent growth), your $17k cash investment doubles in ~2 years — after that, you're playing with house money.
Negotiation context
- Only 9 days on market — expect competitive offers; lowballing is unlikely to land.
- 4 sale attempts since 5y ago with the ask held roughly flat each time — persistent listings suggest the price (not the market) is what's stuck; bring a comps-based counter.
Risks & watch-outs
- Climate carrying-cost: major wildfire risk; extreme-heat days projected 4→10/yr by 2055 (HVAC capex compounding) — expect insurance premiums to compound above CPI over the hold.
Questions for the listing agent
- Built in 1972 — when were the roof, HVAC, electrical panel, plumbing, and water heater last replaced?
- Is there a deadline driving the sale (1031 exchange, divorce, estate, relocation)? That informs how much negotiation room exists.
- Schools are B-rated — typically a magnet for longer-tenancy family renters. What's the average tenant stay here, and is there a school-zone premium baked into asking?
- Crime grade is F in this area — have there been break-ins, vandalism, or insurance claims at this property in the last 3 years? What carrier currently insures it and at what premium?
- What's the average days-on-market for RENTAL listings here right now (not sales)? A rising rental-DOM trend means longer vacancies and softer asking-rent achievability than the comps imply.
- What's the recent tenant-quality profile in this submarket — average credit score on applications, eviction rate, late-payment / NSF rate, and stable-employment percentage? A property-management company in the area should have these aggregated.
- How much new for-sale + rental construction is in the pipeline within 1–3 miles? Heavy new supply typically softens prices + rents 12–24 months out; constrained supply supports both.
Investment metrics
- 1% rule
- 2.61% ✓
- Cap rate
- 22.95%
- Cash-on-cash
- 59.48%
- DSCR
- 3.65
- GRM
- 3.2
CMA / ARV
- ARV (on-the-fly)
- $62,400
- Comps found
- 12
Show comp detail 12 sales within ~0.75 mi
| Address | Dist | Beds/Ba | Sqft | Sold | Price | $/sf | Match |
|---|---|---|---|---|---|---|---|
| 982 E Lassen Ave #19 | 0.01mi | 2/2.0 | 1,080 (+4%) | 5mo | $54,500 | $50 | 89 |
| 701 E Lassen Ave #163 | 0.30mi | 2/2.0 | 1,060 (+2%) | 5mo | $5,000 | $5 | 78 |
| 701 E Lassen #173 | 0.29mi | 2/2.0 | 1,152 (+11%) | 3mo | $84,900 | $74 | 66 |
| 567 E Lassen Ave #300 | 0.51mi | 2/2.0 | 1,040 (0%) | 15mo | $38,500 | $37 | 64 |
| 701 E Lassen Ave #144 | 0.35mi | 3/2.0 (+1) | 1,056 (+2%) | 17mo | $62,950 | $60 | 62 |
| 701 E Lassen Ave #54 | 0.33mi | 2/2.0 | 980 (-6%) | 16mo | $40,837 | $42 | 61 |
| 567 East Lassen Ave #109 | 0.46mi | 2/2.0 | 1,144 (+10%) | 3mo | $85,000 | $74 | 59 |
| 701 E Lassen Ave #87 | 0.35mi | 2/2.0 | 1,152 (+11%) | 10mo | $52,500 | $46 | 57 |
| 982 E Lassen Ave #43 | 0.08mi | 2/1.0 | 896 (-14%) | 15mo | $60,000 | $67 | 57 |
| 701 E Lassen Ave #149 | 0.38mi | 3/2.0 (+1) | 924 (-11%) | 10mo | $87,550 | $95 | 50 |
| 701 E Lassen Ave #180 | 0.34mi | 2/2.0 | 890 (-14%) | 17mo | $96,000 | $108 | 46 |
| 567 E Lassen Ave #514 | 0.58mi | 3/2.0 (+1) | 1,164 (+12%) | 10mo | $40,500 | $35 | 40 |
Match score weights: distance 35% · size 25% · config 20% · recency 20%. Top-matched comps best support the ARV.
Projected returns pro-forma
-3.0% appreciation · 1.7% rent growth · sell at horizon
- IRR
- 56.7%
- Equity multiple
- 3.46×
- Total profit
- $40,621
- Equity at exit
- $8,797
- IRR
- 61.2%
- Equity multiple
- 6.73×
- Total profit
- $94,651
- Equity at exit
- $5,101
Cash invested: $16,520 (down + closing). Projections, not guarantees.
Landlord ↔ Tenant lean methodology
- Overall (STATE)
- 18 Strongly Tenant-Friendly
- State California
- 18 Strongly Tenant-Friendly · D+13
- County
- — inherits STATE
- City
- — inherits STATE
ZIP-level market 95973
- Rents YoY
- 1.7%
- Active inventory
- 151
- Price-to-rent
- 3.2×
Monthly cashflow live
- Estimated rent
- $1,538 high interval (Pro) →
- Mortgage (P&I)
- −$309
- Tax from tax record
- −$62 /mo · $748/yr
- Insurance
- −$25
- HOA
- −$0
- Vacancy / Maint / Mgmt
- −$323
- Net cashflow
- $819
Break-even live
UW: 25.0% down · 7.5% · 30yr · 1.5% tax · 5.0% vac · 8.0% maint · 8.0% mgmt
Financing live
Cash to close
- Down payment
- $14,750
- Closing costs
- $1,770
- Reserves months
- —
- Total cash needed
- —
Loan-product check · same deal, 3 products live
Conventional
25% down · 7.5% · 30yr
- Down + closing
- —
- Monthly P&I
- —
- Monthly cashflow
- —
- DSCR
- —
- Eligible?
- —
Personal DTI + credit; lowest rate.
DSCR
20% down · 8.5% · 30yr
- Down + closing
- —
- Monthly P&I
- —
- Monthly cashflow
- —
- DSCR
- —
- Eligible?
- —
No personal income docs; deal must DSCR.
Hard money
10% down · 12.0% · 12mo
- Down + closing
- —
- Monthly P&I
- —
- Monthly cashflow
- —
- DSCR
- —
- Eligible?
- —
Short-term bridge; refi at stabilization.
Rent comps 35 comps
| Address | Beds | Baths | Sqft | Rent | $/sqft | DOM | Units | Dist |
|---|---|---|---|---|---|---|---|---|
| 1067 Running Springs Cir Chico, CA | 2.0 | 1.0 | 720 | $1,325 | $1.84 | 43d | 3 | 0.15mi |
| 1067 Running Springs Cir Chico, CA | 2.0 | 1.0 | 720 | $1,300 | $1.81 | 13d | 1 | 0.15mi |
| 1080 E Lassen Ave Chico, CA | 1.0–2.0 | 1.0–2.0 | 802 | $1,650 | $2.06 | 13d | 10 | 0.16mi |
| 1055 E Lassen Ave Chico, CA | 2.0 | 1.0 | 817 | $1,325 | $1.62 | 13d | 1 | 0.20mi |
| 2718 White Ave Unit B Chico, CA | 2.0 | 1.0 | 800 | $1,190 | $1.49 | 21d | 1 | 0.20mi |
| 64 Tara Ter Unit 64-2 Chico, CA | 2.0 | 1.5 | 1048 | $1,625 | $1.55 | 43d | 1 | 0.28mi |
| 1 Mayfair Dr Chico, CA | 2.0 | 1.0 | 900 | $1,325 | $1.47 | 43d | 1 | 0.29mi |
| 50 Cameo Dr Apt 3 Chico, CA | 2.0 | 1.0 | 854 | $1,350 | $1.58 | 43d | 1 | 0.30mi |
| 29 Cameo Dr #2 Chico, CA | 2.0 | 1.0 | 928 | $1,400 | $1.51 | 43d | 1 | 0.30mi |
| 2909 Godman Ave Unit 2909-2 Chico, CA | 3.0 | 2.0 | 1170 | $1,725 | $1.47 | 43d | 1 | 0.43mi |
| 583 Morgan Dr #2 Chico, CA | 3.0 | 2.0 | 1100 | $1,750 | $1.59 | 21d | 1 | 0.44mi |
| 2780 Pillsbury Rd Chico, CA | 2.0 | 1.0 | 905 | $1,345 | $1.49 | 43d | 2 | 0.57mi |
| 490 Posada Way Chico, CA | 3.0 | 2.0 | 1200 | $2,000 | $1.67 | 13d | 1 | 0.57mi |
| 599 East Ave Chico, CA | 3.0 | 1.0 | 989 | $1,750 | $1.77 | 21d | 1 | 0.68mi |
| 2485 Pillsbury Rd Unit 2485-03 Chico, CA | 2.0 | 2.0 | 950 | $1,595 | $1.68 | 13d | 1 | 0.74mi |
| 1459 E Lassen Ave Chico, CA | 2.0 | 1.0 | 592 | $1,300 | $2.19 | 13d | 1 | 0.77mi |
| 1717 E Eaton Rd Chico, CA | 2.0 | 1.5 | 1100 | $1,550 | $1.41 | 43d | 1 | 0.85mi |
| 2739 Ceres Ave Chico, CA | 3.0 | 2.0 | 1100 | $2,100 | $1.91 | 43d | 1 | 0.89mi |
| 1749 Eaton Rd Chico, CA | 2.0–3.0 | 1.5–2.5 | 1104 | $1,595 | $1.44 | 13d | 1 | 0.90mi |
| 194 E Shasta Ave Unit 3B Chico, CA | 2.0 | 1.0 | 875 | $1,900 | $2.17 | 43d | 1 | 0.95mi |
| 390 Rio Lindo Ave Chico, CA | 1.0–2.0 | 1.0 | 727 | $1,550 | $2.13 | 13d | 6 | 1.03mi |
| 455 Rio Lindo Ave Chico, CA | 1.0–2.0 | 1.0 | 709 | $1,330 | $1.87 | 21d | 4 | 1.08mi |
| 2777 Eaton Rd Chico, CA | 1.0–2.0 | 1.0–2.0 | 790 | $1,634 | $2.07 | 13d | 3 | 1.10mi |
| 139 W Lassen Ave #22 Chico, CA | 2.0 | 1.0 | 766 | $1,450 | $1.89 | 43d | 1 | 1.12mi |
| 125 Parmac Rd Chico, CA | 2.0 | 1.0 | 725 | $1,325 | $1.83 | 13d | 1 | 1.14mi |
| 205 W Lassen Ave Chico, CA | 2.0 | 1.0 | 792 | $1,500 | $1.89 | 43d | 1 | 1.19mi |
| 251 Rio Lindo Ave Chico, CA | 2.0 | 1.0 | 1100 | $1,400 | $1.27 | 43d | 1 | 1.22mi |
| 259 Rio Lindo Ave Unit 259-16 Chico, CA | 2.0 | 2.0 | 1426 | $1,595 | $1.12 | 43d | 1 | 1.27mi |
| 2833 Eaton Rd Chico, CA | 1.0–2.0 | 1.0–2.0 | 999 | $1,850 | $1.85 | 13d | 9 | 1.28mi |
| 120 Menlo Way Chico, CA | 2.0 | 1.0 | 817 | $1,330 | $1.63 | 13d | 1 | 1.38mi |
| 565 1/2 E Lindo Ave Unit Lindo Ave unit 101 1, Chico, CA | 2.0 | 1.0 | 750 | $1,575 | $2.10 | 43d | 1 | 1.40mi |
| 261 Cohasset Ln Chico, CA | 1.0–2.0 | 1.0 | 725 | $1,325 | $1.83 | 13d | 3 | 1.42mi |
| 2050 Laburnum Ave Chico, CA | 3.0 | 2.0 | 1455 | $1,795 | $1.23 | 13d | 1 | 1.45mi |
| 225 Mission Serra Ter Chico, CA | 2.0 | 2.0 | 1358 | $2,000 | $1.47 | 13d | 1 | 1.48mi |
| 400 Mission Ranch Blvd Chico, CA | 1.0–3.0 | 1.0–2.0 | 995 | $1,588 | $1.59 | 13d | 1 | 1.50mi |
Listing history 8 events
-
2026-06-19days on market $59,000 Active 9 DOM
-
2026-06-18days on market $59,000 Active 8 DOM
-
2026-06-17days on market $59,000 Active 7 DOM
-
2026-06-16days on market $59,000 Active 6 DOM
-
2026-06-15days on market $59,000 Active 5 DOM
-
2026-06-14days on market $59,000 Active 3 DOM
-
2026-06-13remarks 427-char remark
-
2026-06-13$59,000 Active 2 DOM
ⓘ Source: listings_history table (triggers on properties + properties_extension) + one-shot
backfill from property_details.listing_events for pre-trigger history.
Tax reassessment forecast CA · Resets to sale price
- Current annual tax
- $748 · $62/mo
- Projected year-2 tax
- $748 · $62/mo
- Expected delta
- $0/yr ($0/mo · 0.0%)
ⓘ Screening estimate from a state-policy table — verify with the county assessor before closing.
Climate risk First Street
- Flood 1/10 Low FEMA zone X (shaded) · 0% chance over 30 yrs
- Wildfire 7/10 Severe
- Heat 8/10 Severe 4 d/yr ≥105°F today · 10 d/yr by 30 yrs out
- Wind 1/10 Low
- Air quality 10/10 Extreme 37 unhealthy d/yr today · 39 by 30 yrs out
Nearby sold comps map
Loading sold comps map…
Walkable amenities ~0.75 mi
Loading nearby amenities…
Taxation est. · year 1
- Rental income
- $18,457
- − Mortgage interest
- −$3,305
- − Property taxes
- −$748
- − Insurance
- −$295
- − Repairs & maintenance
- −$1,477
- − Management
- −$1,477
- − Depreciation
- −$1,716
- Taxable income
- $9,440
- Est. tax owed @ 24.0%
- −$2,266
- After-tax cash flow
- $7,560/yr
For passive investors: Depreciation is non-cash, so a rental often shows a tax loss while cash-flowing — sheltering income. Rental losses are passive: they offset passive income freely, and up to $25,000/yr can offset ordinary (W-2) income if you actively participate and your MAGI is under $100k (phasing out to $0 by $150k); unused losses carry forward. On sale, claimed depreciation is recaptured at up to 25%, and gains may owe capital-gains tax (a 1031 exchange can defer both). Figures are a year-1 estimate at your 24.0% rate — not tax advice; consult a CPA.
Schools (NCES district)
- District
- Chico Unified
- NCES district ID
- 0608370
- Math proficiency
- 40% ▼ -2.00%
- Reading proficiency
- 70% ▲ 14.00%
- Median HH income
- $46,223
- Composite
- 46.45/100
- National rank
- #2443
- State rank
- #117 of 517 in CA
Livability — Chico
- Score
- 72/100
- State rank
- #195
- US rank
- #6332
Category grades
Schools grade is shown separately in the Schools card above.
Census & demographics
- Census place
- Chico, CA
- County
- Butte County · 175,030 people
- City population
- 117,007
- Metro
- Chico, CA
- Population (ZIP)
- 39,031
- Household income
- $92,813
- Rent vs Own
- Severe rent burden
- 1230.0
Population outlook (Butte County) Hauer SSP2
- Today (2025)
- 237,527 people
- By 2030
- 243,804 · +2.6%
- By 2040
- 253,899 · +6.9%
- By 2050
- 262,561 · +10.5%
- By 2075
- 283,709 · +19.4%
- By 2100
- 282,689 · +19.0%
Race, ethnicity, and origin ACS 2023
- Neighborhood character
- Predominantly White (71%)
- Race & ethnicity
- White 71% Hispanic / Latino 19% Two or more races 10% Asian 5% Native American 1%
- Hispanic origin (detail)
- Mexican 15%
- Common ancestry
- Slovak 4% Italian 4% Russian 3%
- Foreign-born
- 8% · Canada, China
- Languages at home
- 84% English-only · Spanish 11% Other Asian/Pacific 2% Chinese 1%
Political lean MEDSL · Butte
- 2024 margin
- Toss-up / Even · D 46.8% · R 49.9% · Other 3.3%
- 2008→2024 swing
- -5.5pp toward R · 2008: 2.4pp · 2024: -3.1pp
- All cycles
- 2024: R+3.1 2020: D+1.7 2016: R+4.0 2012: R+3.9 2008: D+2.4
Not yet ingested
- Civics
- —
Market trends
- HPI YoY
- ▼ -182.94%
- Current HPI
- 259.9774
- Rent YoY
- ▲ 1.70%
- Metro
- Chico, CA
- State GDP YoY
- ▲ 3.21%
- F500 in state
- 116
Industry mix (Fortune 500 HQ in CA)
| Industry | F500 HQs | Revenue |
|---|---|---|
| Technology | 27 | $1,492B |
|
||
| Financial Services | 3 | $174B |
|
||
| Retail | 3 | $44B |
|
||
| Insurance | 3 | $26B |
|
||
| Media / Entertainment | 2 | $115B |
|
||
| Pharmaceuticals / Biotech | 2 | $62B |
|
||
Price history
-26.2% since first listed12 events — show timeline
- 2026-06-10 Listed $59,000 CRMLS
- 2024-09-03 Sold (MLS) $65,000 CRMLS
- 2024-08-07 Pending — CRMLS
- 2024-08-01 Listed $65,000 CRMLS
- 2022-02-25 Sold (MLS) $65,000 CRMLS
- 2022-02-22 Pending — CRMLS
- 2022-02-13 Contingent — CRMLS
- 2022-01-31 Price Changed $69,000 CRMLS
- 2022-01-22 Price Changed $75,000 CRMLS
- 2022-01-15 Relisted — CRMLS
- 2022-01-03 Contingent — CRMLS
- 2021-12-15 Listed $80,000 CRMLS
Property tax history
+19.6%/yrLatest (2025): $748 · +2.2% YoY. Source: county tax records.
Cash-flow waterfall
monthlySold comps — $/sqft
last 12 mo · ≤1 miLoading sold comps…