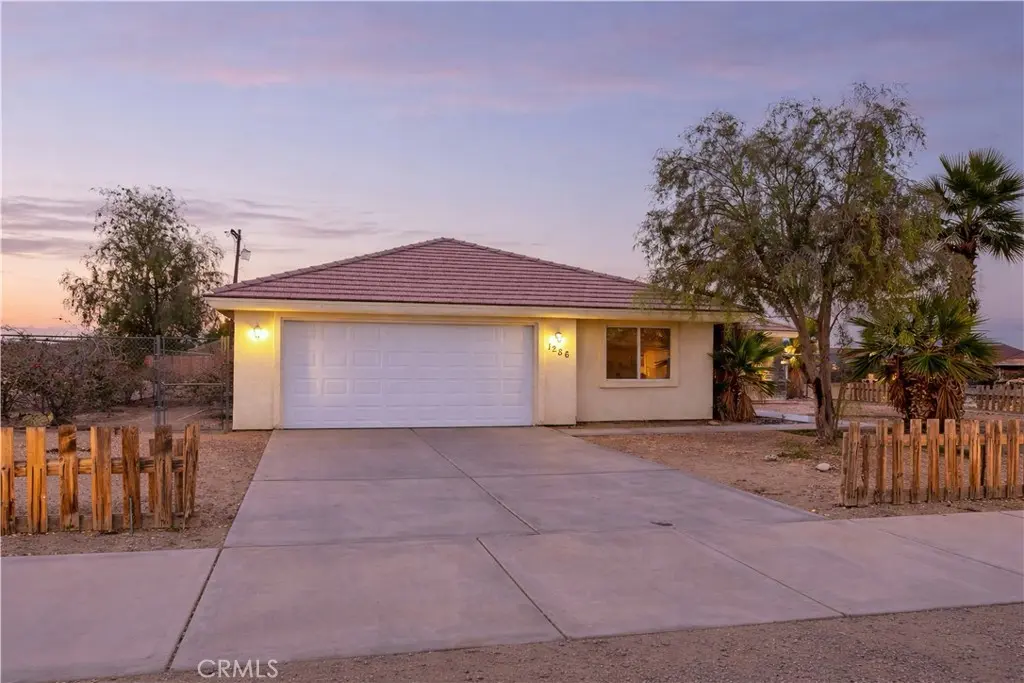
1286 Arctic Ave · Salton City, CA
Flood risk 1/10 · Minimal
- FEMA flood zone
- X (unshaded)
- Chance of flooding over 30 yrs
- 0.0%
- Est. flood insurance / yr
- $507 – $1,088
Fire risk 1/10 · Minimal
- Est. fire insurance / yr
- $659 – $1,223
Heat risk 10/10 · Severe
- Hot days now (above 114°F)
- 6 days/yr
- Hot days in 30 yrs
- 16 days/yr
Wind risk 1/10 · Minimal
- Chance of severe wind over 30 yrs
- —
Air-quality risk 2/10 · Minimal
- Unhealthy air days now
- 2 days/yr
- Unhealthy air days in 30 yrs
- 2 days/yr
Risk factors via First Street. Map © Google.
Why this score? — see what drove the D- grade
The composite is a weighted blend of 9 inputs, each scored 0–100. Each bar is that input's sub-score; the figure is the points it added to the 100-point composite (weight × sub-score).
- Appreciation +10.0/10.0
- Cash flow +9.8/30.0
- ARV discount +5.8/15.0
- DSCR +2.8/10.0
- Rent growth +2.5/5.0
- Condition / age +2.5/5.0
- Livability +2.3/5.0
- 1% rule +2.0/10.0
- Schools +1.5/10.0
$315,000
🖨 Deal sheet 📄 Offer letter ✓ Due diligence
Listing remarks MLS
Renovated and move-in ready in Salton City! Enjoy a nearly 9,500 sq ft lot in a neighborhood where everyone has plenty of space to breathe, plus a 4-bedroom, 2-bathroom home with a primary suite, attached garage, and a pleasant, modern feel throughout. Turnkey desert living at this price won't last long!
Key facts
- 9,497 sq ft lot
- 2 garage spots
- Built 2006
Neighborhood map
What this means for you Summary
Snapshot
- This is a 4-bed/2.0-bath single-family listed at $315k.
Deal economics
- At list price, monthly cash flow is $-203 ($-2k/yr) — negative.
- To cash-flow at today's rent, offer at most $279k (11.4% below list).
- To meet the 1% rule (rent ≥ 1% of price), the offer needs to be $221k (29.7% below list).
- Recommended offer: $221k (29.7% below list) — sets the bar for 1% rule.
- Cap rate 5.5% vs local median 4.4% in Salton City — meaningfully above typical; check what's discounted (condition, days-on-market, listing class) to confirm the premium yield is real.
Location & tenants
- Location reads 46/100 on livability (#1,265 in CA) — a working-class tenant base; expect higher turnover. Strengths: housing A-; Watch: schools F, crime F, amenities F.
- Coachella Valley Unified (rural): math 12% / reading 23% proficiency, ranked #481 of 517 in CA (top 93%) — low school quality limits family demand, transient renter base, plan for 1-2y turnover; 79% free/reduced lunch — lower-income household profile, screen leases tightly.
- Market conditions: 492 active listings in the ZIP; 271 units permitted in Imperial County in 2024 (112 in 5+ unit buildings).
Forward outlook
- In year one you build about $34k of equity ($2k loan paydown + $32k appreciation (10.0% local appreciation)).
- Imperial County population projected at +7% by 2050 — modest demand growth; plan on rents tracking national, not racing it.
- By year 2, paydown + projected appreciation supports a ~$54k cash-out refi (75% LTV) — recoverable capital for the next deal without selling this one.
Negotiation context
- It's been on market 62 days — a 6% lower offer ($296k) is reasonable based on typical stale-listing flexibility.
- 4 sale attempts with the ask held roughly flat each time — persistent listings suggest the price (not the market) is what's stuck; bring a comps-based counter.
- Current owner paid $85k; list at $315k implies a 271% gain — meaningful room to come down on a strong offer.
Risks & watch-outs
- Climate carrying-cost: extreme-heat days projected 6→16/yr by 2055 (HVAC capex compounding) — expect insurance premiums to compound above CPI over the hold.
Questions for the listing agent
- What do current leases actually rent for vs. the listed asking? Can we see a recent rent roll and the last 12 months of T-12 income?
- It's been on market 62 days. Have you received any prior offers? Is the seller open to a 30% concession, seller financing, or rate buy-down credit?
- Why hasn't it sold? Are there any deal-killer items the seller is aware of (foundation, flood, title, zoning, code violations)?
- Is there a deadline driving the sale (1031 exchange, divorce, estate, relocation)? That informs how much negotiation room exists.
- Schools are F-rated, which usually means shorter tenancies and higher turnover. Who's the typical renter profile here, and what's been the actual vacancy rate?
- Crime grade is F in this area — have there been break-ins, vandalism, or insurance claims at this property in the last 3 years? What carrier currently insures it and at what premium?
- The area grade is low — what's the realistic commute time and amenity access for the typical tenant pool here? Any planned neighborhood developments (good or bad) we should know about?
- What's the average days-on-market for RENTAL listings here right now (not sales)? A rising rental-DOM trend means longer vacancies and softer asking-rent achievability than the comps imply.
- What's the recent tenant-quality profile in this submarket — average credit score on applications, eviction rate, late-payment / NSF rate, and stable-employment percentage? A property-management company in the area should have these aggregated.
- How much new for-sale + rental construction is in the pipeline within 1–3 miles? Heavy new supply typically softens prices + rents 12–24 months out; constrained supply supports both.
Investment metrics
- 1% rule
- 0.70% ✗
- Cap rate
- 5.52%
- Cash-on-cash
- -2.77%
- DSCR
- 0.88
- GRM
- 11.9
CMA / ARV
- ARV (median comp)
- $303,275
- List price
- $315,000
- Delta
- 3.87%
- Verdict
- FAIR
- Comps
- 20 within 1.0 mi
Show comp detail 12 sales within ~0.75 mi
| Address | Dist | Beds/Ba | Sqft | Sold | Price | $/sf | Match |
|---|---|---|---|---|---|---|---|
| 2867 Stardust Ave | 0.10mi | 4/2.0 | 1,259 (0%) | 1mo | $320,000 | $254 | 95 |
| 1267 Black Sea Ave | 0.13mi | 4/2.0 | 1,250 (-1%) | 10mo | $290,000 | $232 | 85 |
| 2869 Stardust Ave | 0.11mi | 4/2.0 | 1,331 (+6%) | 3mo | $299,999 | $225 | 83 |
| 1281 Black Sea Ave | 0.06mi | 4/2.0 | 1,250 (-1%) | 17mo | $265,000 | $212 | 82 |
| 2839 Bach Ave | 0.33mi | 3/2.0 (-1) | 1,269 (+1%) | 2mo | $300,000 | $236 | 76 |
| 1293 China Sea Ave | 0.16mi | 3/2.0 (-1) | 1,144 (-9%) | 8mo | $290,000 | $253 | 66 |
| 1240 Indian Ocean Ave | 0.25mi | 3/2.0 (-1) | 1,437 (+14%) | 2mo | $175,500 | $122 | 58 |
| 1348 Persimmon | 0.46mi | 3/2.0 (-1) | 1,150 (-9%) | 7mo | $275,000 | $239 | 53 |
| 1279 Corvina Ave | 0.42mi | 3/2.0 (-1) | 1,144 (-9%) | 14mo | $267,500 | $234 | 49 |
| 1239 Corvina Ave | 0.46mi | 3/2.0 (-1) | 1,144 (-9%) | 12mo | $279,000 | $244 | 48 |
| 1231 Roselle Ave | 0.44mi | 4/2.0 | 1,436 (+14%) | 12mo | $335,000 | $233 | 46 |
| 1229 Roselle Ave | 0.44mi | 3/2.0 (-1) | 1,430 (+14%) | 12mo | $308,000 | $215 | 42 |
Match score weights: distance 35% · size 25% · config 20% · recency 20%. Top-matched comps best support the ARV.
Projected returns pro-forma
10.0% appreciation · 3.0% rent growth · sell at horizon
- IRR
- 22.3%
- Equity multiple
- 2.80×
- Total profit
- $158,506
- Equity at exit
- $283,777
- IRR
- 20.0%
- Equity multiple
- 6.41×
- Total profit
- $476,748
- Equity at exit
- $611,976
Cash invested: $88,200 (down + closing). Projections, not guarantees.
Landlord ↔ Tenant lean methodology
- Overall (STATE)
- 18 Strongly Tenant-Friendly
- State California
- 18 Strongly Tenant-Friendly · D+13
- County
- — inherits STATE
- City
- — inherits STATE
ZIP-level market 92274
- Home prices YoY
- 31.9%
- Active inventory
- 492
- Price-to-rent
- 11.9×
Monthly cashflow live
- Estimated rent
- $2,214 medium interval (Pro) →
- Mortgage (P&I)
- −$1,652
- Tax from tax record
- −$169 /mo · $2,026/yr
- Insurance
- −$131
- HOA
- −$0
- Vacancy / Maint / Mgmt
- −$465
- Net cashflow
- $-203
Break-even live
UW: 25.0% down · 7.5% · 30yr · 1.5% tax · 5.0% vac · 8.0% maint · 8.0% mgmt
Financing live
Cash to close
- Down payment
- $78,750
- Closing costs
- $9,450
- Reserves months
- —
- Total cash needed
- —
Loan-product check · same deal, 3 products live
Conventional
25% down · 7.5% · 30yr
- Down + closing
- —
- Monthly P&I
- —
- Monthly cashflow
- —
- DSCR
- —
- Eligible?
- —
Personal DTI + credit; lowest rate.
DSCR
20% down · 8.5% · 30yr
- Down + closing
- —
- Monthly P&I
- —
- Monthly cashflow
- —
- DSCR
- —
- Eligible?
- —
No personal income docs; deal must DSCR.
Hard money
10% down · 12.0% · 12mo
- Down + closing
- —
- Monthly P&I
- —
- Monthly cashflow
- —
- DSCR
- —
- Eligible?
- —
Short-term bridge; refi at stabilization.
Listing history 23 events
-
2026-06-18days on market $315,000 Active 62 DOM
-
2026-06-17days on market $315,000 Active 61 DOM
-
2026-06-16days on market $315,000 Active 60 DOM
-
2026-06-15days on market $315,000 Active 59 DOM
-
2026-06-13days on market $315,000 Active 57 DOM
-
2026-06-13days on market $315,000 Active 56 DOM
-
2026-06-09days on market $315,000 Active 53 DOM
-
2026-06-08days on market $315,000 Active 52 DOM
-
2026-06-07days on market $315,000 Active 51 DOM
-
2026-06-04days on market $315,000 Active 48 DOM
-
2026-06-03days on market $315,000 Active 47 DOM
-
2026-06-02days on market $315,000 Active 46 DOM
-
2026-06-01days on market $315,000 Active 45 DOM
-
2026-05-31days on market $315,000 Active 44 DOM
-
2026-04-24price $1,925
-
2026-04-17$315,000 Active 305-char remark
Show marketing remark (305 chars)
Renovated and move-in ready in Salton City! Enjoy a nearly 9,500 sq ft lot in a neighborhood where everyone has plenty of space to breathe, plus a 4-bedroom, 2-bathroom home with a primary suite, attached garage, and a pleasant, modern feel throughout. Turnkey desert living at this price won't last long!
-
2026-02-14$2,000
-
2026-02-14historical $2,000
-
2026-01-01$2,000
-
2025-12-21historical $2,000
-
2025-12-18$2,000
-
2025-11-21soldstatus $85,000
-
2002-03-28soldstatus $37,000
ⓘ Source: listings_history table (triggers on properties + properties_extension) + one-shot
backfill from property_details.listing_events for pre-trigger history.
Tax reassessment forecast CA · Resets to sale price
- Current annual tax
- $2,026 · $169/mo
- Projected year-2 tax
- $2,394 · $200/mo
- Expected delta
- +$368/yr (+$31/mo · 18.1%)
ⓘ Screening estimate from a state-policy table — verify with the county assessor before closing.
Climate risk First Street
- Flood 1/10 Low FEMA zone X (unshaded) · 0% chance over 30 yrs
- Wildfire 1/10 Low
- Heat 10/10 Extreme 6 d/yr ≥114°F today · 16 d/yr by 30 yrs out
- Wind 1/10 Low
- Air quality 2/10 Low 2 unhealthy d/yr today · 2 by 30 yrs out
Nearby sold comps map
Loading sold comps map…
Walkable amenities ~0.75 mi
Loading nearby amenities…
Taxation est. · year 1
- Rental income
- $26,563
- − Mortgage interest
- −$17,645
- − Property taxes
- −$2,026
- − Insurance
- −$1,575
- − Repairs & maintenance
- −$2,125
- − Management
- −$2,125
- − Depreciation
- −$9,164
- Taxable loss
- −$8,097
- Est. tax savings @ 24.0%
- +$1,943
- After-tax cash flow
- $-496/yr
For passive investors: Depreciation is non-cash, so a rental often shows a tax loss while cash-flowing — sheltering income. Rental losses are passive: they offset passive income freely, and up to $25,000/yr can offset ordinary (W-2) income if you actively participate and your MAGI is under $100k (phasing out to $0 by $150k); unused losses carry forward. On sale, claimed depreciation is recaptured at up to 25%, and gains may owe capital-gains tax (a 1031 exchange can defer both). Figures are a year-1 estimate at your 24.0% rate — not tax advice; consult a CPA.
Schools (NCES district)
- District
- Coachella Valley Unified
- NCES district ID
- 0609070
- Math proficiency
- 12% ▼ -8.00%
- Reading proficiency
- 23% ▼ -6.00%
- Median HH income
- $37,683
- Composite
- 14.62/100
- National rank
- #9408
- State rank
- #481 of 517 in CA
Livability — Salton City
- Score
- 46/100
- State rank
- #1265
- US rank
- #26406
Category grades
Schools grade is shown separately in the Schools card above.
Census & demographics
- Census place
- Salton City, CA
- Population (ZIP)
- 17,909
Population outlook (Imperial County) Hauer SSP2
- Today (2025)
- 186,713 people
- By 2030
- 190,022 · +1.8%
- By 2040
- 195,993 · +5.0%
- By 2050
- 199,534 · +6.9%
- By 2075
- 216,878 · +16.2%
- By 2100
- 352,705 · +88.9%
Race, ethnicity, and origin ACS 2023
- Neighborhood character
- Predominantly Hispanic (88%)
- Race & ethnicity
- Hispanic / Latino 88% Two or more races 49% White 10%
- Hispanic origin (detail)
- Mexican 87%
- Common ancestry
- Italian 1% Portuguese 1%
- Foreign-born
- 42% · Canada
- Languages at home
- 24% English-only · Spanish 76%
Political lean MEDSL · Imperial
- 2024 margin
- Toss-up / Even · D 48.3% · R 49.1% · Other 2.6%
- 2008→2024 swing
- -27.0pp toward R · 2008: 26.2pp · 2024: -0.9pp
- All cycles
- 2024: R+0.9 2020: D+24.4 2016: D+41.1 2012: D+28.8 2008: D+26.2
Not yet ingested
- Civics
- —
Market trends
- HPI YoY
- ▲ 179.97%
- Current HPI
- 744.8454
- Rent YoY
- —
- Metro
- —
- State GDP YoY
- ▲ 3.21%
- F500 in state
- 116
Industry mix (Fortune 500 HQ in CA)
| Industry | F500 HQs | Revenue |
|---|---|---|
| Technology | 27 | $1,492B |
|
||
| Financial Services | 3 | $174B |
|
||
| Retail | 3 | $44B |
|
||
| Insurance | 3 | $26B |
|
||
| Media / Entertainment | 2 | $115B |
|
||
| Pharmaceuticals / Biotech | 2 | $62B |
|
||
Price history
-94.8% since first listed9 events — show timeline
- 2026-04-24 Price Changed $1,925 CRMLS
- 2026-04-17 Listed $315,000 CRMLS
- 2026-02-14 Listed for Rent $2,000 CRMLS
- 2026-02-14 Rental Removed $2,000 CRMLS
- 2026-01-01 Listed for Rent $2,000 CRMLS
- 2025-12-21 Rental Removed $2,000 CRMLS
- 2025-12-18 Listed for Rent $2,000 CRMLS
- 2025-11-21 Sold (Public Records) $85,000 Public Records
- 2002-03-28 Sold (Public Records) $37,000 Public Records
Property tax history
+6.3%/yrLatest (2025): $2,026 · +3.0% YoY. Source: county tax records.
Cash-flow waterfall
monthlySold comps — $/sqft
last 12 mo · ≤1 miLoading sold comps…