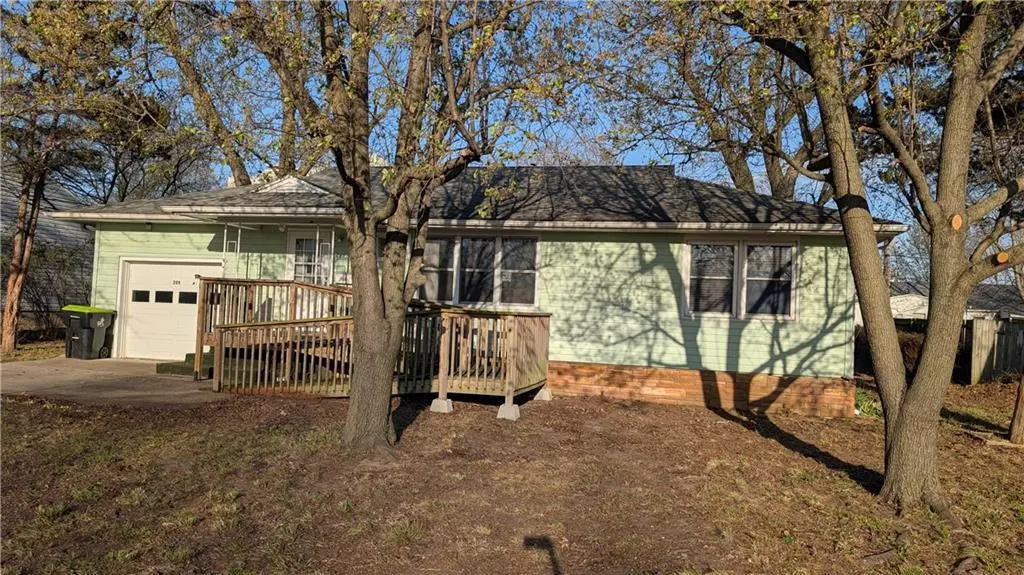
209 S West Haven Rd · El Dorado Springs, MO
Flood risk 1/10 · Minimal
- FEMA flood zone
- X (unshaded)
- Chance of flooding over 30 yrs
- 0.0%
- Est. flood insurance / yr
- $507 – $1,088
Fire risk 4/10 · Minor
- Est. fire insurance / yr
- $1,054 – $1,958
Heat risk 5/10 · Moderate
- Hot days now (above 108°F)
- 7 days/yr
- Hot days in 30 yrs
- 18 days/yr
Wind risk 2/10 · Minimal
- Chance of severe wind over 30 yrs
- 2.0%
Air-quality risk 2/10 · Minimal
- Unhealthy air days now
- 0 days/yr
- Unhealthy air days in 30 yrs
- 1 days/yr
Risk factors via First Street. Map © Google.
Why this score? — see what drove the B- grade
The composite is a weighted blend of 9 inputs, each scored 0–100. Each bar is that input's sub-score; the figure is the points it added to the 100-point composite (weight × sub-score).
- Cash flow +26.1/30.0
- Appreciation +10.0/10.0
- DSCR +8.8/10.0
- ARV discount +5.8/15.0
- 1% rule +5.7/10.0
- Livability +3.1/5.0
- Rent growth +2.5/5.0
- Condition / age +2.5/5.0
- Schools +2.4/10.0
$134,900
🖨 Deal sheet 📄 Offer letter ✓ Due diligence
Listing remarks MLS
Charming and affordable home tucked away on a peaceful street in El Dorado Springs. This 3-bedroom, 2-bath property offers 1,114 square feet of comfortable living space and is priced at $134900.00. Inside, you’ll find fresh paint throughout along with newer windows and updated fixtures that enhance both style and efficiency. The backyard is designed for easy upkeep, partially fenced, and provides a private, relaxing outdoor space. Additional features include a one-car attached garage, a handy outbuilding for extra storage, and a thoughtfully constructed ramp for convenient front access. Don’t miss your chance to see this well-kept home—schedule your showing today!
Key facts
- 7,500 sq ft lot
- Garage
- Listed 40 days
Neighborhood map
What this means for you Summary
Snapshot
- This is a 3-bed/2.0-bath single-family listed at $135k.
Deal economics
- At list price, monthly cash flow is $338 ($4k/yr) — positive.
- The deal already cash-flows at list — no discount required.
- Meets the 1% rule at list price ($1k rent vs $135k).
- Recommended offer: $131k (3.0% below list) — sets the bar for market timing.
- Cap rate 9.3% vs local median 4.9% in El Dorado Springs — top-decile yield for the area; either an underpriced asset or a hidden risk that comps aren't pricing in. Stress-test before assuming the spread holds.
Location & tenants
- Location reads 62/100 on livability (#370 in MO) — a middle-class / working-renter tenant base. Strengths: cost of living A+, housing A+, health & safety A+; Watch: schools D-, amenities F, commute F.
- El Dorado Springs R-II (town): math 25% / reading 34% proficiency, ranked #279 of 324 in MO (top 86%) — low school quality limits family demand, transient renter base, plan for 1-2y turnover.
- Market conditions: 81 active listings in the ZIP; 1 comparable units currently listed for rent nearby; 4 units permitted in Cedar County in 2024 (0 in 5+ unit buildings).
Forward outlook
- In year one you build about $14k of equity ($933 loan paydown + $13k appreciation (10.0% local appreciation)).
- Cedar County population projected at -12% by 2050 — secular population decline; favor cash flow + early exit over multi-decade hold.
- At projected returns (10.0% appreciation + 3.0% rent growth), your $38k cash investment doubles in ~2 years — after that, you're playing with house money.
- By year 3, paydown + projected appreciation supports a ~$37k cash-out refi (75% LTV) — recoverable capital for the next deal without selling this one.
Negotiation context
- It's been on market 40 days — a 3% lower offer ($131k) is reasonable based on typical stale-listing flexibility.
- 4 sale attempts since 5y ago with the ask held roughly flat each time — persistent listings suggest the price (not the market) is what's stuck; bring a comps-based counter.
Risks & watch-outs
- Watch-outs: built in 1958 — expect roof / HVAC / electrical / plumbing capex.
- Climate carrying-cost: extreme-heat days projected 7→18/yr by 2055 (HVAC capex compounding) — expect insurance premiums to compound above CPI over the hold.
Questions for the listing agent
- It's been on market 40 days. Have you received any prior offers? Is the seller open to a 3% concession, seller financing, or rate buy-down credit?
- Built in 1958 — when were the roof, HVAC, electrical panel, plumbing, and water heater last replaced?
- Is there a deadline driving the sale (1031 exchange, divorce, estate, relocation)? That informs how much negotiation room exists.
- Schools are D-rated, which usually means shorter tenancies and higher turnover. Who's the typical renter profile here, and what's been the actual vacancy rate?
- What's the average days-on-market for RENTAL listings here right now (not sales)? A rising rental-DOM trend means longer vacancies and softer asking-rent achievability than the comps imply.
- What's the recent tenant-quality profile in this submarket — average credit score on applications, eviction rate, late-payment / NSF rate, and stable-employment percentage? A property-management company in the area should have these aggregated.
- How much new for-sale + rental construction is in the pipeline within 1–3 miles? Heavy new supply typically softens prices + rents 12–24 months out; constrained supply supports both.
Investment metrics
- 1% rule
- 1.07% ✓
- Cap rate
- 9.30%
- Cash-on-cash
- 10.75%
- DSCR
- 1.48
- GRM
- 7.8
CMA / ARV
- ARV (median comp)
- $129,969
- List price
- $134,900
- Delta
- 3.79%
- Verdict
- FAIR
- Comps
- 20 within 1.0 mi
Show comp detail 12 sales within ~0.75 mi
| Address | Dist | Beds/Ba | Sqft | Sold | Price | $/sf | Match |
|---|---|---|---|---|---|---|---|
| 103.5 Westhaven Dr | 0.09mi | 3/2.0 | 1,120 (+0%) | 13mo | $175,000 | $156 | 84 |
| 103 Westhaven Dr | 0.09mi | 3/2.0 | 1,120 (+0%) | 15mo | $175,000 | $156 | 83 |
| 103.5 Westhaven Rd | 0.16mi | 3/2.0 | 1,120 (+0%) | 13mo | $175,000 | $156 | 81 |
| 300 W Pine St | 0.28mi | 3/2.0 | 1,250 (+12%) | 4mo | $75,000 | $60 | 63 |
| 1100 S Jackson St | 0.33mi | 2/2.0 (-1) | 1,157 (+4%) | 12mo | $112,500 | $97 | 63 |
| 807 S Jackson St | 0.48mi | 3/1.0 | 1,152 (+3%) | 10mo | $129,900 | $113 | 60 |
| 1804 S Phillips St | 0.55mi | 4/2.0 (+1) | 1,118 (+0%) | 11mo | $199,900 | $179 | 59 |
| 109 E Poplar St | 0.58mi | 3/2.0 | 1,120 (+0%) | 15mo | $125,900 | $112 | 59 |
| 1109 S High St | 0.18mi | 3/1.0 | 1,232 (+11%) | 14mo | $127,500 | $103 | 59 |
| 121 W Pine St | 0.42mi | 2/1.0 (-1) | 1,056 (-5%) | 8mo | $20,000 | $19 | 56 |
| 109 W Marshall St | 0.69mi | 2/1.0 (-1) | 1,040 (-7%) | 13mo | $125,900 | $121 | 37 |
| 210 E Oak St | 0.57mi | 2/1.0 (-1) | 972 (-13%) | 9mo | $129,900 | $134 | 36 |
Match score weights: distance 35% · size 25% · config 20% · recency 20%. Top-matched comps best support the ARV.
Projected returns pro-forma
10.0% appreciation · 3.0% rent growth · sell at horizon
- IRR
- 32.1%
- Equity multiple
- 3.51×
- Total profit
- $94,972
- Equity at exit
- $121,529
- IRR
- 27.7%
- Equity multiple
- 7.95×
- Total profit
- $262,614
- Equity at exit
- $262,081
Cash invested: $37,772 (down + closing). Projections, not guarantees.
Landlord ↔ Tenant lean methodology
- Overall (STATE)
- 81 Strongly Landlord-Friendly
- State Missouri
- 81 Strongly Landlord-Friendly · R+10
- County
- — inherits STATE
- City
- — inherits STATE
ZIP-level market 64744
- Home prices YoY
- 5.2%
- Active inventory
- 81
- Price-to-rent
- 7.8×
Monthly cashflow live
- Estimated rent
- $1,450 medium interval (Pro) →
- Mortgage (P&I)
- −$707
- Tax from tax record
- −$43 /mo · $521/yr
- Insurance
- −$56
- HOA
- −$0
- Vacancy / Maint / Mgmt
- −$304
- Net cashflow
- $338
Break-even live
UW: 25.0% down · 7.5% · 30yr · 1.5% tax · 5.0% vac · 8.0% maint · 8.0% mgmt
Financing live
Cash to close
- Down payment
- $33,725
- Closing costs
- $4,047
- Reserves months
- —
- Total cash needed
- —
Loan-product check · same deal, 3 products live
Conventional
25% down · 7.5% · 30yr
- Down + closing
- —
- Monthly P&I
- —
- Monthly cashflow
- —
- DSCR
- —
- Eligible?
- —
Personal DTI + credit; lowest rate.
DSCR
20% down · 8.5% · 30yr
- Down + closing
- —
- Monthly P&I
- —
- Monthly cashflow
- —
- DSCR
- —
- Eligible?
- —
No personal income docs; deal must DSCR.
Hard money
10% down · 12.0% · 12mo
- Down + closing
- —
- Monthly P&I
- —
- Monthly cashflow
- —
- DSCR
- —
- Eligible?
- —
Short-term bridge; refi at stabilization.
Rent comps 1 comps
| Address | Beds | Baths | Sqft | Rent | $/sqft | DOM | Units | Dist |
|---|---|---|---|---|---|---|---|---|
| 410 S Ohio St El Dorado Springs, MO | 3.0 | 2.0 | 1020 | $1,450 | $1.42 | 43d | 1 | 0.97mi |
Listing history 9 events
-
2026-05-16status Pending 690-char remark
Show marketing remark (690 chars)
Charming and affordable home tucked away on a peaceful street in El Dorado Springs. This 3-bedroom, 2-bath property offers 1,114 square feet of comfortable living space and is priced at $134900.00. Inside, you’ll find fresh paint throughout along with newer windows and updated fixtures that enhance both style and efficiency. The backyard is designed for easy upkeep, partially fenced, and provides a private, relaxing outdoor space. Additional features include a one-car attached garage, a handy outbuilding for extra storage, and a thoughtfully constructed ramp for convenient front access. Don’t miss your chance to see this well-kept home—schedule your showing today!
-
2026-04-08$134,900 Active 673-char remark
Show marketing remark (673 chars)
Charming and affordable home tucked away on a peaceful street in El Dorado Springs. This 3-bedroom, 2-bath property offers 1,114 square feet of comfortable living space and is priced at $134900.00. Inside, you'll find fresh paint throughout along with newer windows and updated fixtures that enhance both style and efficiency. The backyard is designed for easy upkeep, partially fenced, and provides a private, relaxing outdoor space. Additional features include a one-car attached garage, a handy outbuilding for extra storage, and a thoughtfully constructed ramp for convenient front access. Don't miss your chance to see this well-kept home--schedule your showing today!
-
2026-04-07$134,900 Active 690-char remark
Show marketing remark (690 chars)
Charming and affordable home tucked away on a peaceful street in El Dorado Springs. This 3-bedroom, 2-bath property offers 1,114 square feet of comfortable living space and is priced at $134900.00. Inside, you’ll find fresh paint throughout along with newer windows and updated fixtures that enhance both style and efficiency. The backyard is designed for easy upkeep, partially fenced, and provides a private, relaxing outdoor space. Additional features include a one-car attached garage, a handy outbuilding for extra storage, and a thoughtfully constructed ramp for convenient front access. Don’t miss your chance to see this well-kept home—schedule your showing today!
-
2026-04-01historical $134,900 690-char remark
Show marketing remark (690 chars)
Charming and affordable home tucked away on a peaceful street in El Dorado Springs. This 3-bedroom, 2-bath property offers 1,114 square feet of comfortable living space and is priced at $134900.00. Inside, you’ll find fresh paint throughout along with newer windows and updated fixtures that enhance both style and efficiency. The backyard is designed for easy upkeep, partially fenced, and provides a private, relaxing outdoor space. Additional features include a one-car attached garage, a handy outbuilding for extra storage, and a thoughtfully constructed ramp for convenient front access. Don’t miss your chance to see this well-kept home—schedule your showing today!
-
2021-09-17soldstatus
-
2021-09-16soldstatus
-
2021-09-15soldstatus
-
2021-07-06$81,500
-
2021-07-06$81,500
ⓘ Source: listings_history table (triggers on properties + properties_extension) + one-shot
backfill from property_details.listing_events for pre-trigger history.
Tax reassessment forecast MO · Resets to sale price
- Current annual tax
- $521 · $43/mo
- Projected year-2 tax
- $1,309 · $109/mo
- Expected delta
- +$788/yr (+$66/mo · 151.2%)
ⓘ Screening estimate from a state-policy table — verify with the county assessor before closing.
Climate risk First Street
- Flood 1/10 Low FEMA zone X (unshaded) · 0% chance over 30 yrs
- Wildfire 4/10 Moderate
- Heat 5/10 Major 7 d/yr ≥108°F today · 18 d/yr by 30 yrs out
- Wind 2/10 Low 2% chance of damaging wind over 30 yrs
- Air quality 2/10 Low 0 unhealthy d/yr today · 1 by 30 yrs out
Nearby sold comps map
Loading sold comps map…
Walkable amenities ~0.75 mi
Loading nearby amenities…
Taxation est. · year 1
- Rental income
- $17,400
- − Mortgage interest
- −$7,556
- − Property taxes
- −$521
- − Insurance
- −$674
- − Repairs & maintenance
- −$1,392
- − Management
- −$1,392
- − Depreciation
- −$3,924
- Taxable income
- $1,940
- Est. tax owed @ 24.0%
- −$466
- After-tax cash flow
- $3,596/yr
For passive investors: Depreciation is non-cash, so a rental often shows a tax loss while cash-flowing — sheltering income. Rental losses are passive: they offset passive income freely, and up to $25,000/yr can offset ordinary (W-2) income if you actively participate and your MAGI is under $100k (phasing out to $0 by $150k); unused losses carry forward. On sale, claimed depreciation is recaptured at up to 25%, and gains may owe capital-gains tax (a 1031 exchange can defer both). Figures are a year-1 estimate at your 24.0% rate — not tax advice; consult a CPA.
Schools (NCES district)
- District
- El Dorado Springs R-II
- NCES district ID
- 2911310
- Math proficiency
- 25% ▼ -5.00%
- Reading proficiency
- 34% ▼ -5.00%
- Median HH income
- $31,880
- Composite
- 24.02/100
- National rank
- #7772
- State rank
- #279 of 324 in MO
Livability — El Dorado Springs
- Score
- 62/100
- State rank
- #370
- US rank
- #16324
Category grades
Schools grade is shown separately in the Schools card above.
Census & demographics
- Census place
- El Dorado Springs, MO
- Population (ZIP)
- 8,547
Population outlook (Cedar County) Hauer SSP2
- Today (2025)
- 13,424 people
- By 2030
- 13,080 · -2.6%
- By 2040
- 12,434 · -7.4%
- By 2050
- 11,841 · -11.8%
- By 2075
- 10,171 · -24.2%
- By 2100
- 7,744 · -42.3%
Race, ethnicity, and origin ACS 2023
- Neighborhood character
- Predominantly White (95%)
- Race & ethnicity
- White 95% Two or more races 4%
- Common ancestry
- Italian 6% Iranian 3% Romanian 3%
- Foreign-born
- 1% · Canada
- Languages at home
- 94% English-only · German/W. Germanic 5% Spanish 1%
Political lean MEDSL · Cedar
- 2024 margin
- Solid R (+69.6) · D 14.8% · R 84.4%
- 2008→2024 swing
- -36.0pp toward R · 2008: -33.6pp · 2024: -69.6pp
- All cycles
- 2024: R+69.6 2020: R+65.9 2016: R+63.9 2012: R+47.0 2008: R+33.6
Not yet ingested
- Civics
- —
Market trends
- HPI YoY
- ▲ 11.88%
- Current HPI
- 242.0421
- Rent YoY
- —
- Metro
- —
- State GDP YoY
- ▲ 1.84%
- F500 in state
- 20
Industry mix (Fortune 500 HQ in MO)
| Industry | F500 HQs | Revenue |
|---|---|---|
| Healthcare | 1 | $163B |
|
||
| Insurance | 1 | $21B |
|
||
| Industrial Technology | 1 | $17B |
|
||
| Retail | 1 | $16B |
|
||
| Industrial Distribution | 1 | $10B |
|
||
| Utilities | 1 | $9B |
|
||
Price history
+65.5% since first listed9 events — show timeline
- 2026-05-16 Pending — Heartland MLS as Distributed by MLS Grid
- 2026-04-08 Listed $134,900 SOMO
- 2026-04-07 Listed $134,900 Heartland MLS as Distributed by MLS Grid
- 2026-04-01 Coming Soon $134,900 Heartland MLS as Distributed by MLS Grid
- 2021-09-17 Sold (MLS) — SOMO
- 2021-09-16 Sold (Public Records) — Public Records
- 2021-09-15 Sold (MLS) — Heartland MLS as Distributed by MLS Grid
- 2021-07-06 Listed $81,500 Heartland MLS as Distributed by MLS Grid
- 2021-07-06 Listed $81,500 SOMO
Property tax history
+3.4%/yrLatest (2025): $521 · +10.6% YoY. Source: county tax records.
Cash-flow waterfall
monthlySold comps — $/sqft
last 12 mo · ≤1 miLoading sold comps…