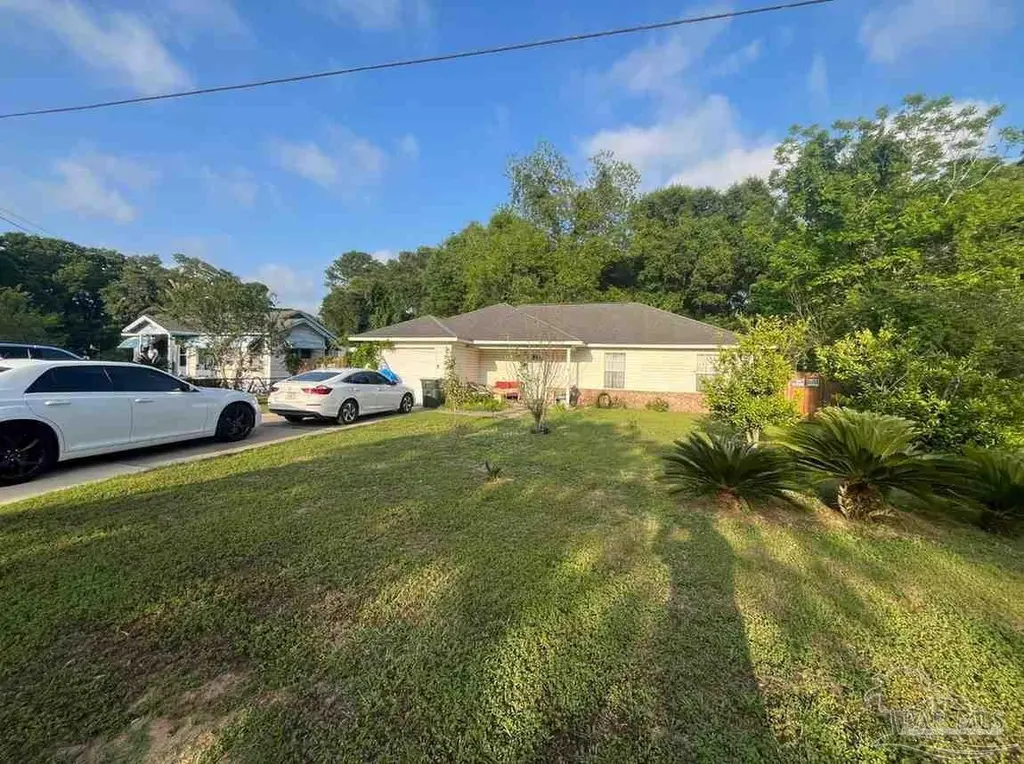
700 46th Ave · West Pensacola, FL
Flood risk 1/10 · Minimal
- FEMA flood zone
- X (unshaded)
- Chance of flooding over 30 yrs
- 0.0%
- Est. flood insurance / yr
- $507 – $1,088
Fire risk 1/10 · Minimal
- Est. fire insurance / yr
- $947 – $1,759
Heat risk 10/10 · Severe
- Hot days now (above 105°F)
- 7 days/yr
- Hot days in 30 yrs
- 23 days/yr
Wind risk 9/10 · Severe
- Chance of severe wind over 30 yrs
- 99.0%
Air-quality risk 1/10 · Minimal
- Unhealthy air days now
- 0 days/yr
- Unhealthy air days in 30 yrs
- 0 days/yr
Risk factors via First Street. Map © Google.
Why this score? — see what drove the C+ grade
The composite is a weighted blend of 9 inputs, each scored 0–100. Each bar is that input's sub-score; the figure is the points it added to the 100-point composite (weight × sub-score).
- Cash flow +24.5/30.0
- ARV discount +14.1/15.0
- DSCR +7.9/10.0
- 1% rule +5.4/10.0
- Schools +3.6/10.0
- Rent growth +3.5/5.0
- Livability +3.3/5.0
- Condition / age +2.5/5.0
- Appreciation +0.0/10.0
$144,900
🖨 Deal sheet 📄 Offer letter ✓ Due diligence
Listing remarks
Opportunity knocks at 700 N 46th Ave! This 3-bedroom, 2-bath home offers 1,196 sq ft and is ready for a full renovation. Whether you?re looking for your next flip, rental, or long-term hold, this property has the potential to be transformed into a strong investment in the Pensacola market. The home features a functional layout, a 15-year-old roof, and plenty of upside for the right buyer willing to bring it back to life. Priced with the needed renovation in mind, this is a great chance to add value and create equity. Conveniently located near shopping, schools, military bases, and major roadways. Bring your contractor, your vision, and your offer!
Key facts
- Near schools
- 15 year old roof
- Near shopping
Tags
Property features AI
Finance
- Other: Road maintenance not provided by owner (No road maintenance)
- Financial info: No investor or income/expense details provided
- HOA & community: No homeowners association
Exterior
- Parking: Attached garage (1 covered garage space, total 1 parking space)
- Security: No specific security features listed
- Utilities: Public sewer; Electric service with circuit breakers
- Home design: Single-story (one level); Resale property; Not attached to another property; Homestead exempt
- Construction: Brick and frame construction; Slab foundation; Built on a 0.3-acre lot; Total building area about 1,196 square feet
- Exterior features: Shingle roof; Paved road access; Public water
Interior
- Kitchen: No kitchen feature details provided
- Bedrooms: Master bedroom on the first floor (approx. 12 x 12); Two additional first-floor bedrooms (each approx. 10 x 10)
- Flooring: Carpet
- Bathrooms: Two full bathrooms
- Heating & cooling: Cooling provided by wall/window units; Ceiling fans; Geothermal heat pump (open loop system)
- Interior features: Carpet flooring
- Laundry & utility: No laundry or utility appliance details provided
Neighborhood map
What this means for you Summary
Snapshot
- This is a 3-bed/2.0-bath single-family listed at $145k.
Deal economics
- At list price, monthly cash flow is $298 ($4k/yr) — positive.
- The deal already cash-flows at list — no discount required.
- Meets the 1% rule at list price ($2k rent vs $145k).
- Recommended offer: $143k (1.5% below list) — sets the bar for market timing.
Location & tenants
- Location reads 66/100 on livability (#629 in FL) — a middle-class / working-renter tenant base. Strengths: cost of living A+, housing A+, health & safety B+; Watch: crime D, schools F, amenities F.
- Escambia (suburban): math 40% / reading 45% proficiency, ranked #56 of 73 in FL (top 77%) — families likely to look elsewhere, expect single-tenant / working-renter base with shorter leases.
- Market conditions: Rents rising (+3.9%/yr); 270 active listings in the ZIP; 10 comparable units currently listed for rent nearby; rentals at typical pace (median 24d on market — plan ~3-4 weeks tenant-placement turnaround); 1,479 units permitted in Escambia County in 2024 (0 in 5+ unit buildings).
Forward outlook
- Local home prices are declining (-3.0%/yr); year-one equity from $1k of loan paydown is wiped out by about $4k of value loss. Plan a longer hold.
- Escambia County population projected at +13% by 2050 — modest demand growth; plan on rents tracking national, not racing it.
Negotiation context
- It's been on market 17 days — a 2% lower offer ($143k) is reasonable based on typical stale-listing flexibility.
Risks & watch-outs
- Climate carrying-cost: severe wind risk, 99% chance of damaging wind over 30y; extreme-heat days projected 7→23/yr by 2055 (HVAC capex compounding) — expect insurance premiums to compound above CPI over the hold.
Questions for the listing agent
- Is there a deadline driving the sale (1031 exchange, divorce, estate, relocation)? That informs how much negotiation room exists.
- Schools are F-rated, which usually means shorter tenancies and higher turnover. Who's the typical renter profile here, and what's been the actual vacancy rate?
- Crime grade is D in this area — have there been break-ins, vandalism, or insurance claims at this property in the last 3 years? What carrier currently insures it and at what premium?
- What's the average days-on-market for RENTAL listings here right now (not sales)? A rising rental-DOM trend means longer vacancies and softer asking-rent achievability than the comps imply.
- What's the recent tenant-quality profile in this submarket — average credit score on applications, eviction rate, late-payment / NSF rate, and stable-employment percentage? A property-management company in the area should have these aggregated.
- How much new for-sale + rental construction is in the pipeline within 1–3 miles? Heavy new supply typically softens prices + rents 12–24 months out; constrained supply supports both.
Investment metrics
- 1% rule
- 1.04% ✓
- Cap rate
- 8.76%
- Cash-on-cash
- 8.81%
- DSCR
- 1.39
- GRM
- 8.0
CMA / ARV
- ARV (on-the-fly)
- $169,832
- Comps found
- 12
Show comp detail 12 sales within ~0.75 mi
| Address | Dist | Beds/Ba | Sqft | Sold | Price | $/sf | Match |
|---|---|---|---|---|---|---|---|
| 105 Citrus St | 0.53mi | 3/2.0 | 1,200 (+0%) | 5mo | $170,000 | $142 | 71 |
| 4953 Martha Ave | 0.47mi | 3/2.0 | 1,120 (-6%) | 4mo | $220,000 | $196 | 64 |
| 35 Randolph Dr | 0.68mi | 4/2.0 (+1) | 1,182 (-1%) | 2mo | $167,900 | $142 | 60 |
| 249 Willow St | 0.52mi | 2/2.0 (-1) | 1,137 (-5%) | 5mo | $184,000 | $162 | 59 |
| 258 Omega Ct | 0.45mi | 3/1.0 | 1,098 (-8%) | 5mo | $127,500 | $116 | 57 |
| 1106 N 50th Ave | 0.57mi | 3/2.0 | 1,086 (-9%) | 5mo | $190,000 | $175 | 54 |
| 522 S Edgewood Cir | 0.48mi | 3/1.0 | 1,355 (+13%) | 1mo | $208,500 | $154 | 50 |
| 5236 W Jackson St | 0.51mi | 3/1.5 | 1,358 (+14%) | 3mo | $122,000 | $90 | 50 |
| 132 Elm St | 0.46mi | 2/1.0 (-1) | 1,336 (+12%) | 3mo | $170,000 | $127 | 48 |
| 4130 W Jackson St | 0.54mi | 3/2.0 | 1,028 (-14%) | 5mo | $140,000 | $136 | 48 |
| 15 Janet St | 0.74mi | 4/1.5 (+1) | 1,252 (+5%) | 5mo | $86,000 | $69 | 46 |
| 22 Gloucester Ave | 0.70mi | 4/1.0 (+1) | 1,041 (-13%) | 1mo | $125,000 | $120 | 36 |
Match score weights: distance 35% · size 25% · config 20% · recency 20%. Top-matched comps best support the ARV.
Projected returns pro-forma
-3.0% appreciation · 3.85% rent growth · sell at horizon
- IRR
- -2.1%
- Equity multiple
- 0.92×
- Total profit
- $-3,246
- Equity at exit
- $21,605
- IRR
- 8.4%
- Equity multiple
- 1.66×
- Total profit
- $26,881
- Equity at exit
- $12,528
Cash invested: $40,572 (down + closing). Projections, not guarantees.
Landlord ↔ Tenant lean methodology
- Overall (STATE)
- 87 Strongly Landlord-Friendly
- State Florida
- 87 Strongly Landlord-Friendly · R+3
- County
- — inherits STATE
- City
- — inherits STATE
ZIP-level market 32506
- Home prices YoY
- -22.5%
- Rents YoY
- 3.9%
- Active inventory
- 270
- Price-to-rent
- 8.0×
Monthly cashflow live
- Estimated rent
- $1,513 high interval (Pro) →
- Mortgage (P&I)
- −$760
- Tax from tax record
- −$77 /mo · $926/yr
- Insurance
- −$60
- HOA
- −$0
- Vacancy / Maint / Mgmt
- −$318
- Net cashflow
- $298
Break-even live
UW: 25.0% down · 7.5% · 30yr · 1.5% tax · 5.0% vac · 8.0% maint · 8.0% mgmt
Financing live
Cash to close
- Down payment
- $36,225
- Closing costs
- $4,347
- Reserves months
- —
- Total cash needed
- —
Loan-product check · same deal, 3 products live
Conventional
25% down · 7.5% · 30yr
- Down + closing
- —
- Monthly P&I
- —
- Monthly cashflow
- —
- DSCR
- —
- Eligible?
- —
Personal DTI + credit; lowest rate.
DSCR
20% down · 8.5% · 30yr
- Down + closing
- —
- Monthly P&I
- —
- Monthly cashflow
- —
- DSCR
- —
- Eligible?
- —
No personal income docs; deal must DSCR.
Hard money
10% down · 12.0% · 12mo
- Down + closing
- —
- Monthly P&I
- —
- Monthly cashflow
- —
- DSCR
- —
- Eligible?
- —
Short-term bridge; refi at stabilization.
Rent comps 10 comps
| Address | Beds | Baths | Sqft | Rent | $/sqft | DOM | Units | Dist |
|---|---|---|---|---|---|---|---|---|
| 4519 Martha Ave Pensacola, FL | 3.0 | 1.0 | 1104 | $1,600 | $1.45 | 23d | 1 | 0.32mi |
| 4600 Twin Oaks Dr Pensacola, FL | 1.0–2.0 | 1.0 | 838 | $1,499 | $1.79 | 14d | 29 | 0.57mi |
| 190 N Old Corry Field Rd Pensacola, FL | 1.0–2.0 | 1.0–2.0 | 915 | $1,174 | $1.28 | 14d | 3 | 0.67mi |
| 5501 Mayfair Dr Pensacola, FL | 3.0 | 1.0 | 912 | $1,295 | $1.42 | 23d | 1 | 0.68mi |
| 316 Teakwood Cir Pensacola, FL | 2.0 | 1.5 | 1024 | $1,350 | $1.32 | 14d | 1 | 0.71mi |
| 101 Vanderbilt Rd Pensacola, FL | 3.0 | 2.0 | 1104 | $1,850 | $1.68 | 21d | 1 | 0.92mi |
| 3740 Frontera Cir Pensacola, FL | 3.0 | 1.0 | 1024 | $1,295 | $1.26 | 23d | 1 | 1.05mi |
| 852 Garnet St Pensacola, FL | 3.0 | 1.5 | 1150 | $1,150 | $1.00 | 14d | 1 | 1.10mi |
| 1218 N Kirk St Pensacola, FL | 2.0 | 1.0 | 850 | $1,150 | $1.35 | 23d | 1 | 1.26mi |
| 419 N Wentworth St Pensacola, FL | 2.0 | 1.0 | 1100 | $1,195 | $1.09 | 23d | 1 | 1.32mi |
Listing history 12 events
-
2026-06-18days on market $144,900 Active 17 DOM
-
2026-06-17days on market $144,900 Active 16 DOM
-
2026-06-16days on market $144,900 Active 15 DOM
-
2026-06-15days on market $144,900 Active 14 DOM
-
2026-06-14days on market $144,900 Active 12 DOM
-
2026-06-10days on market $144,900 Active 9 DOM
-
2026-06-09days on market $144,900 Active 8 DOM
-
2026-06-08days on market $144,900 Active 7 DOM
-
2026-06-07days on market $144,900 Active 6 DOM
-
2026-06-03days on market $144,900 Active 2 DOM
-
2026-06-02remarks 656-char remark
-
2026-06-02$144,900 Active 1 DOM
ⓘ Source: listings_history table (triggers on properties + properties_extension) + one-shot
backfill from property_details.listing_events for pre-trigger history.
Tax reassessment forecast FL · Resets to sale price
- Current annual tax
- $926 · $77/mo
- Projected year-2 tax
- $1,203 · $100/mo
- Expected delta
- +$276/yr (+$23/mo · 29.8%)
ⓘ Screening estimate from a state-policy table — verify with the county assessor before closing.
Climate risk First Street
- Flood 1/10 Low FEMA zone X (unshaded) · 0% chance over 30 yrs
- Wildfire 1/10 Low
- Heat 10/10 Extreme 7 d/yr ≥105°F today · 23 d/yr by 30 yrs out
- Wind 9/10 Extreme 99% chance of damaging wind over 30 yrs
- Air quality 1/10 Low 0 unhealthy d/yr today · 0 by 30 yrs out
Nearby sold comps map
Loading sold comps map…
Walkable amenities ~0.75 mi
Loading nearby amenities…
Taxation est. · year 1
- Rental income
- $18,156
- − Mortgage interest
- −$8,117
- − Property taxes
- −$926
- − Insurance
- −$724
- − Repairs & maintenance
- −$1,452
- − Management
- −$1,452
- − Depreciation
- −$4,215
- Taxable income
- $1,268
- Est. tax owed @ 24.0%
- −$304
- After-tax cash flow
- $3,270/yr
For passive investors: Depreciation is non-cash, so a rental often shows a tax loss while cash-flowing — sheltering income. Rental losses are passive: they offset passive income freely, and up to $25,000/yr can offset ordinary (W-2) income if you actively participate and your MAGI is under $100k (phasing out to $0 by $150k); unused losses carry forward. On sale, claimed depreciation is recaptured at up to 25%, and gains may owe capital-gains tax (a 1031 exchange can defer both). Figures are a year-1 estimate at your 24.0% rate — not tax advice; consult a CPA.
Schools (NCES district)
- District
- Escambia
- NCES district ID
- 1200510
- Math proficiency
- 40% ▼ -9.00%
- Reading proficiency
- 45% ▼ -4.00%
- Median HH income
- $44,649
- Composite
- 36.04/100
- National rank
- #4773
- State rank
- #56 of 73 in FL
Livability — West Pensacola
- Score
- 66/100
- State rank
- #629
- US rank
- #12275
Category grades
Schools grade is shown separately in the Schools card above.
Census & demographics
- Census place
- West Pensacola, FL
- County
- Escambia County · 301,722 people
- Metro
- Pensacola-Ferry Pass-Brent, FL
- Population (ZIP)
- 34,549
- Household income
- $62,486
- Rent vs Own
- Severe rent burden
- 1359.0
Population outlook (Escambia County) Hauer SSP2
- Today (2025)
- 334,637 people
- By 2030
- 345,779 · +3.3%
- By 2040
- 364,828 · +9.0%
- By 2050
- 378,514 · +13.1%
- By 2075
- 403,220 · +20.5%
- By 2100
- 386,125 · +15.4%
Race, ethnicity, and origin ACS 2023
- Neighborhood character
- Diverse neighborhood (Simpson 0.60)
- Race & ethnicity
- White 60% Black 18% Two or more races 11% Hispanic / Latino 6% Asian 6%
- Hispanic origin (detail)
- Mexican 3%
- Common ancestry
- Lithuanian 4% Slovak 2% Italian 2%
- Foreign-born
- 9% · Canada, China, Vietnam
- Languages at home
- 89% English-only · Spanish 4% Tagalog/Filipino 2% Other Indo-European 1%
Political lean MEDSL · Escambia
- 2024 margin
- R (+19.5) · D 39.7% · R 59.2% · Other 1.1%
- 2008→2024 swing
- -0.2pp no change · 2008: -19.3pp · 2024: -19.5pp
- All cycles
- 2024: R+19.5 2020: R+15.1 2016: R+20.6 2012: R+20.6 2008: R+19.3
Not yet ingested
- Civics
- —
Market trends
- HPI YoY
- ▼ -71.86%
- Current HPI
- 247.6085
- Rent YoY
- ▲ 3.85%
- Metro
- Pensacola-Ferry Pass-Brent, FL
- State GDP YoY
- ▲ 3.28%
- F500 in state
- 36
Industry mix (Fortune 500 HQ in FL)
| Industry | F500 HQs | Revenue |
|---|---|---|
| Industrial Technology | 2 | $29B |
|
||
| Insurance | 2 | $17B |
|
||
| Retail | 1 | $60B |
|
||
| Technology Distribution | 1 | $58B |
|
||
| Homebuilding | 1 | $35B |
|
||
| Technology Manufacturing | 1 | $35B |
|
||
Price history
+5.8% since first listed3 events — show timeline
- 2026-06-01 Listed $144,900 PARMLS
- 2006-04-05 Sold (Public Records) $137,000 Public Records
- 2006-04-05 Sold (Public Records) $137,000 Public Records
Property tax history
+3.9%/yrLatest (2025): $926 · +21.2% YoY. Source: county tax records.
Cash-flow waterfall
monthlySold comps — $/sqft
last 12 mo · ≤1 miLoading sold comps…