1443 Bedford Dr · New Haven, IN
Flood risk 1/10 · Minimal
- FEMA flood zone
- X (unshaded)
- Chance of flooding over 30 yrs
- 0.0%
- Est. flood insurance / yr
- $507 – $1,088
Fire risk 1/10 · Minimal
- Est. fire insurance / yr
- $717 – $1,331
Heat risk 3/10 · Minor
- Hot days now (above 100°F)
- 7 days/yr
- Hot days in 30 yrs
- 17 days/yr
Wind risk 2/10 · Minimal
- Chance of severe wind over 30 yrs
- —
Air-quality risk 3/10 · Minor
- Unhealthy air days now
- 3 days/yr
- Unhealthy air days in 30 yrs
- 3 days/yr
Risk factors via First Street. Map © Google.
Why this score? — see what drove the D+ grade
The composite is a weighted blend of 9 inputs, each scored 0–100. Each bar is that input's sub-score; the figure is the points it added to the 100-point composite (weight × sub-score).
- Cash flow +16.4/30.0
- ARV discount +11.8/15.0
- DSCR +5.1/10.0
- 1% rule +4.5/10.0
- Schools +3.6/10.0
- Livability +3.5/5.0
- Rent growth +2.5/5.0
- Condition / age +2.5/5.0
- Appreciation +0.0/10.0
$160,000
🖨 Deal sheet 📄 Offer letter ✓ Due diligence
Listing remarks
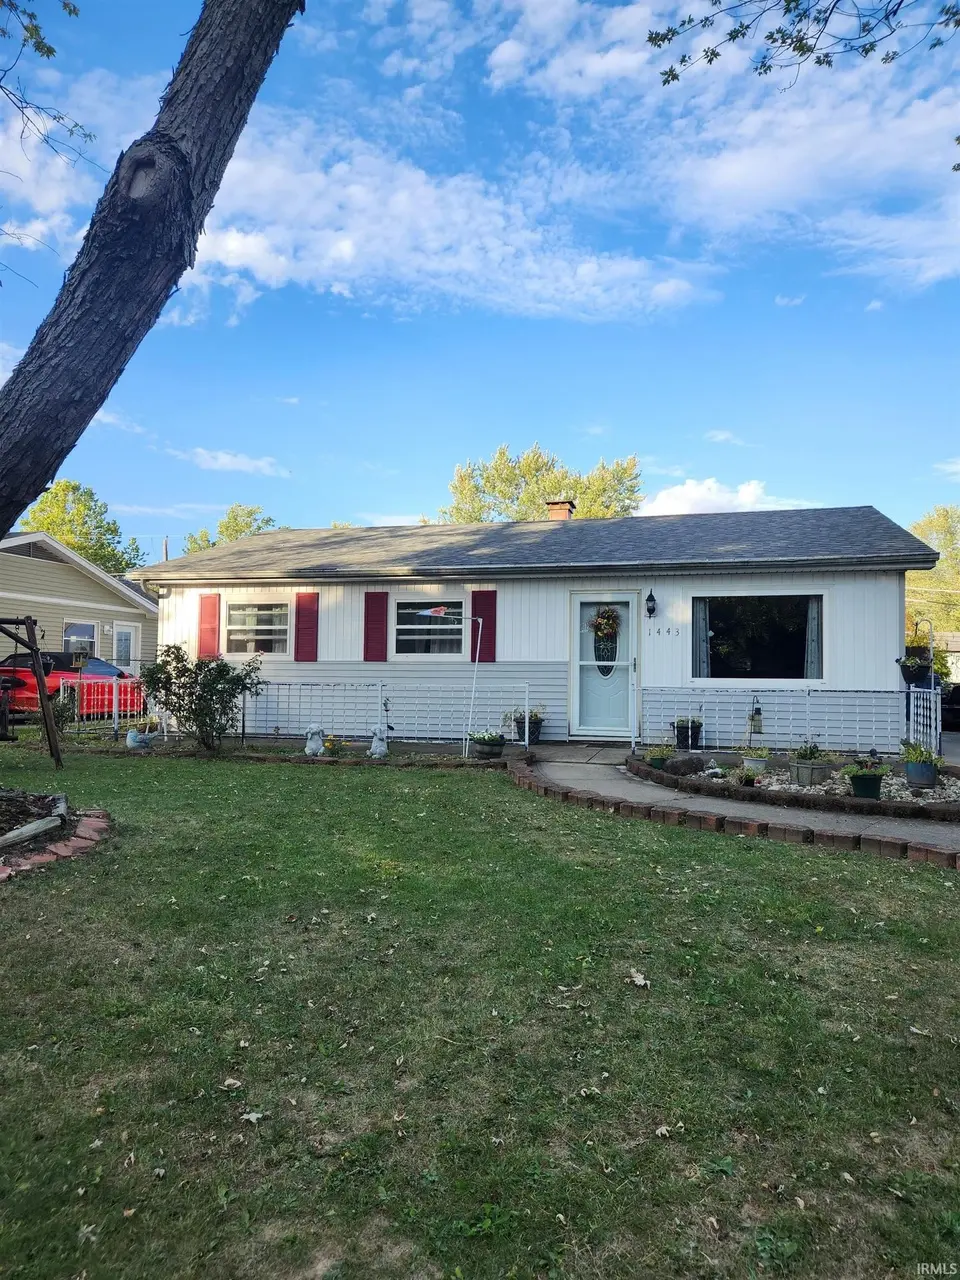
Beat the summer rush with this move-in-ready 3-bedroom home! Offering 1,215 sq. ft. of comfortable, one-story living, this property is designed for those who value both relaxation and reliability. The standout feature? A 3-year-old roof that provides immediate "big ticket" relief for years to come. The heart of the home is the fantastic sunroom, acting as a brilliant extension of your living space just in time for the warmer weather. Whether you’re hosting friends or seeking a quiet suburban escape, you’ll love the tight-knit feel of this New Haven community. With easy access to local green spaces and parks, this home offers a balanced lifestyle that's hard to find.
Key facts
- 0.3 acre lot
- Built 1960
- Listed 2 days
Property features AI
Exterior
- Parking: Concrete parking
- Utilities: Public water; Public sewer
- Home design: Single-family residence (site-built); 1 story; Slab foundation
- Construction: Vinyl siding; Asphalt roof; Built as site-built construction
- Exterior features: Shed(s); Located on a cul-de-sac
Interior
- Kitchen: Gas cooktop; Microwave; Refrigerator
- Flooring: Carpet; Laminate
- Bathrooms: 1 full bathroom (main level)
- Heating & cooling: Natural gas forced-air heating; Central air conditioning
- Interior features: Window treatments; 1 fireplace
- Laundry & utility: Washer and dryer on main level; Gas water heater
Neighborhood map
What this means for you Summary
Snapshot
- This is a 3-bed/1.0-bath single-family listed at $160k.
Deal economics
- At list price, monthly cash flow is $91 ($1k/yr) — positive.
- The deal already cash-flows at list — no discount required.
- To meet the 1% rule (rent ≥ 1% of price), the offer needs to be $151k (5.3% below list).
- Recommended offer: $151k (5.3% below list) — sets the bar for 1% rule.
- Cap rate 7.0% vs local median 4.9% in New Haven — top-decile yield for the area; either an underpriced asset or a hidden risk that comps aren't pricing in. Stress-test before assuming the spread holds.
Location & tenants
- Location reads 70/100 on livability (#149 in IN) — a middle-class / working-renter tenant base. Strengths: cost of living A+, housing A+, crime B+; Watch: employment D, amenities F, commute F.
- East Allen County Schools (suburban): math 36% / reading 47% proficiency, ranked #122 of 301 in IN (top 40%) — families likely to look elsewhere, expect single-tenant / working-renter base with shorter leases.
- Zoned schools: New Haven Primary School (470 students, 61% FRL); New Haven Jr/Sr High School (math 21% / reading 50%, grade F, #263 of 369 statewide, top 72%, 1,494 students, 67% FRL) — zoned schools average 64% FRL vs 43% district-wide (21 pts higher); higher-poverty schools than district average — tighter screening recommended.
- Market conditions: 176 active listings in the ZIP; 3 comparable units currently listed for rent nearby; rentals lingering (median 44d on market — plan ~5-8 weeks vacancy on turnover, expect pricing pressure); 67% of comp listings sitting > 30 days — soft ceiling on asking rent; 1,861 units permitted in Allen County in 2024 (576 in 5+ unit buildings).
Forward outlook
- Local home prices are declining (-3.0%/yr); year-one equity from $1k of loan paydown is wiped out by about $5k of value loss. Plan a longer hold.
- Allen County population projected at +10% by 2050 — modest demand growth; plan on rents tracking national, not racing it.
Negotiation context
- Only 2 days on market — expect competitive offers; lowballing is unlikely to land.
- 2 sale attempts with the ask held roughly flat each time — persistent listings suggest the price (not the market) is what's stuck; bring a comps-based counter.
Questions for the listing agent
- Built in 1960 — when were the roof, HVAC, electrical panel, plumbing, and water heater last replaced?
- Is there a deadline driving the sale (1031 exchange, divorce, estate, relocation)? That informs how much negotiation room exists.
- Schools are D-rated, which usually means shorter tenancies and higher turnover. Who's the typical renter profile here, and what's been the actual vacancy rate?
- The area grade is low — what's the realistic commute time and amenity access for the typical tenant pool here? Any planned neighborhood developments (good or bad) we should know about?
- What's the average days-on-market for RENTAL listings here right now (not sales)? A rising rental-DOM trend means longer vacancies and softer asking-rent achievability than the comps imply.
- What's the recent tenant-quality profile in this submarket — average credit score on applications, eviction rate, late-payment / NSF rate, and stable-employment percentage? A property-management company in the area should have these aggregated.
- How much new for-sale + rental construction is in the pipeline within 1–3 miles? Heavy new supply typically softens prices + rents 12–24 months out; constrained supply supports both.
Investment metrics
- 1% rule
- 0.95% ✗
- Cap rate
- 6.97%
- Cash-on-cash
- 2.43%
- DSCR
- 1.11
- GRM
- 8.8
CMA / ARV
- ARV (median comp)
- $176,911
- List price
- $160,000
- Delta
- -9.56%
- Verdict
- FAIR
- Comps
- 20 within 1.0 mi
Show comp detail 12 sales within ~0.75 mi
| Address | Dist | Beds/Ba | Sqft | Sold | Price | $/sf | Match |
|---|---|---|---|---|---|---|---|
| 1606 Melbourne Dr | 0.11mi | 3/1.5 | 1,176 (-3%) | 3mo | $193,000 | $164 | 85 |
| 417 Sara Dr | 0.14mi | 3/1.0 | 1,280 (+6%) | 2mo | $176,900 | $138 | 82 |
| 1706 Sherbrook Dr | 0.25mi | 3/1.5 | 1,248 (+3%) | 9mo | $170,000 | $136 | 74 |
| 1407 Melbourne Dr | 0.11mi | 3/1.0 | 1,066 (-12%) | 2mo | $170,000 | $159 | 73 |
| 1186 Braeburn Dr | 0.30mi | 3/1.5 | 1,300 (+7%) | 3mo | $170,000 | $131 | 69 |
| 1356 Melbourne Dr | 0.13mi | 3/1.5 | 1,378 (+14%) | 6mo | $189,500 | $138 | 64 |
| 546 Kirkmore Dr | 0.34mi | 3/1.0 | 1,345 (+11%) | 5mo | $176,000 | $131 | 62 |
| 1345 Melbourne Dr | 0.16mi | 4/2.0 (+1) | 1,378 (+14%) | 10mo | $222,000 | $161 | 53 |
| 579 Courtney Dr | 0.48mi | 3/1.0 | 1,350 (+11%) | 8mo | $175,000 | $130 | 52 |
| 1176 Melbourne Dr | 0.38mi | 4/1.0 (+1) | 1,361 (+12%) | 8mo | $120,000 | $88 | 50 |
| 1142 Melbourne Dr | 0.44mi | 4/1.5 (+1) | 1,376 (+13%) | 6mo | $113,775 | $83 | 45 |
| 1010 Courtney Dr | 0.62mi | 3/1.5 | 1,050 (-13%) | 11mo | $142,000 | $135 | 37 |
Match score weights: distance 35% · size 25% · config 20% · recency 20%. Top-matched comps best support the ARV.
Projected returns pro-forma
-3.0% appreciation · 3.0% rent growth · sell at horizon
- IRR
- -12.4%
- Equity multiple
- 0.55×
- Total profit
- $-20,130
- Equity at exit
- $23,857
- IRR
- -3.3%
- Equity multiple
- 0.78×
- Total profit
- $-10,002
- Equity at exit
- $13,834
Cash invested: $44,800 (down + closing). Projections, not guarantees.
Landlord ↔ Tenant lean methodology
- Overall (STATE)
- 90 Strongly Landlord-Friendly
- State Indiana
- 90 Strongly Landlord-Friendly · R+11
- County
- — inherits STATE
- City
- — inherits STATE
ZIP-level market 46774
- Active inventory
- 176
- Price-to-rent
- 8.8×
Monthly cashflow live
- Estimated rent
- $1,514 medium interval (Pro) →
- Mortgage (P&I)
- −$839
- Tax est. 1.5%
- −$200 /mo · $2,400/yr
- Insurance
- −$67
- HOA
- −$0
- Vacancy / Maint / Mgmt
- −$318
- Net cashflow
- $91
Break-even live
UW: 25.0% down · 7.5% · 30yr · 1.5% tax · 5.0% vac · 8.0% maint · 8.0% mgmt
Financing live
Cash to close
- Down payment
- $40,000
- Closing costs
- $4,800
- Reserves months
- —
- Total cash needed
- —
Loan-product check · same deal, 3 products live
Conventional
25% down · 7.5% · 30yr
- Down + closing
- —
- Monthly P&I
- —
- Monthly cashflow
- —
- DSCR
- —
- Eligible?
- —
Personal DTI + credit; lowest rate.
DSCR
20% down · 8.5% · 30yr
- Down + closing
- —
- Monthly P&I
- —
- Monthly cashflow
- —
- DSCR
- —
- Eligible?
- —
No personal income docs; deal must DSCR.
Hard money
10% down · 12.0% · 12mo
- Down + closing
- —
- Monthly P&I
- —
- Monthly cashflow
- —
- DSCR
- —
- Eligible?
- —
Short-term bridge; refi at stabilization.
Rent comps 3 comps
| Address | Beds | Baths | Sqft | Rent | $/sqft | DOM | Units | Dist |
|---|---|---|---|---|---|---|---|---|
| 920 Courtney Dr New Haven, IN | 3.0 | 1.5 | 1000 | $1,499 | $1.50 | 13d | 1 | 0.58mi |
| 3591 Canal Square Dr New Haven, IN | 3.0 | 1.5 | 1467 | $1,695 | $1.16 | 43d | 1 | 1.37mi |
| 1155 Hartzell St New Haven, IN | 2.0 | 1.0 | 720 | $1,300 | $1.81 | 43d | 1 | 1.46mi |
Listing history 5 events
-
2026-05-14status Pending 696-char remark
-
2026-05-12$160,000 Active 696-char remark
-
2026-05-01historical $160,000 696-char remark
-
2025-11-12price $199,999
-
2025-10-07$207,199 Active
ⓘ Source: listings_history table (triggers on properties + properties_extension) + one-shot
backfill from property_details.listing_events for pre-trigger history.
Climate risk First Street
- Flood 1/10 Low FEMA zone X (unshaded) · 0% chance over 30 yrs
- Wildfire 1/10 Low
- Heat 3/10 Moderate 7 d/yr ≥100°F today · 17 d/yr by 30 yrs out
- Wind 2/10 Low
- Air quality 3/10 Moderate 3 unhealthy d/yr today · 3 by 30 yrs out
Nearby sold comps map
Loading sold comps map…
Walkable amenities ~0.75 mi
Loading nearby amenities…
Taxation est. · year 1
- Rental income
- $18,173
- − Mortgage interest
- −$8,962
- − Property taxes
- −$2,400
- − Insurance
- −$800
- − Repairs & maintenance
- −$1,454
- − Management
- −$1,454
- − Depreciation
- −$4,655
- Taxable loss
- −$1,552
- Est. tax savings @ 24.0%
- +$372
- After-tax cash flow
- $1,460/yr
For passive investors: Depreciation is non-cash, so a rental often shows a tax loss while cash-flowing — sheltering income. Rental losses are passive: they offset passive income freely, and up to $25,000/yr can offset ordinary (W-2) income if you actively participate and your MAGI is under $100k (phasing out to $0 by $150k); unused losses carry forward. On sale, claimed depreciation is recaptured at up to 25%, and gains may owe capital-gains tax (a 1031 exchange can defer both). Figures are a year-1 estimate at your 24.0% rate — not tax advice; consult a CPA.
Schools (NCES district)
- District
- East Allen County Schools
- NCES district ID
- 1802850
- Math proficiency
- 36% ▼ -8.00%
- Reading proficiency
- 47% ▼ -4.00%
- Median HH income
- $50,524
- Composite
- 35.75/100
- National rank
- #4849
- State rank
- #122 of 301 in IN
Livability — New Haven
- Score
- 70/100
- State rank
- #149
- US rank
- #7499
Category grades
Schools grade is shown separately in the Schools card above.
Census & demographics
- Census place
- New Haven, IN
- Population (ZIP)
- 17,066
Population outlook (Allen County) Hauer SSP2
- Today (2025)
- 394,020 people
- By 2030
- 405,128 · +2.8%
- By 2040
- 423,476 · +7.5%
- By 2050
- 435,137 · +10.4%
- By 2075
- 450,293 · +14.3%
- By 2100
- 424,101 · +7.6%
Race, ethnicity, and origin ACS 2023
- Neighborhood character
- Predominantly White (89%)
- Race & ethnicity
- White 89% Two or more races 4% Hispanic / Latino 4% Black 3% Asian 1%
- Common ancestry
- Lithuanian 5% Italian 2% Slovak 1%
- Foreign-born
- 3% · Canada, Philippines
- Languages at home
- 89% English-only · German/W. Germanic 6% Spanish 3% Chinese 1%
Political lean MEDSL · Allen
- 2024 margin
- R (+12.5) · D 42.9% · R 55.4% · Other 1.7%
- 2008→2024 swing
- -8.1pp toward R · 2008: -4.3pp · 2024: -12.5pp
- All cycles
- 2024: R+12.5 2020: R+11.2 2016: R+19.6 2012: R+16.8 2008: R+4.3
Not yet ingested
- Civics
- —
Market trends
- HPI YoY
- ▼ -185.27%
- Current HPI
- 241.5333
- Rent YoY
- —
- Metro
- —
- State GDP YoY
- ▲ 2.90%
- F500 in state
- 18
Industry mix (Fortune 500 HQ in IN)
| Industry | F500 HQs | Revenue |
|---|---|---|
| Industrial Machinery | 2 | $37B |
|
||
| Healthcare | 1 | $177B |
|
||
| Pharmaceuticals | 1 | $45B |
|
||
| Metals / Steel | 1 | $18B |
|
||
| Agriculture | 1 | $17B |
|
||
| Packaging | 1 | $12B |
|
||
Price history
-22.8% since first listed5 events — show timeline
- 2026-05-14 Pending — IRMLS
- 2026-05-12 Listed $160,000 IRMLS
- 2026-05-01 Coming Soon $160,000 IRMLS
- 2025-11-12 Price Changed $199,999 IRMLS
- 2025-10-07 Listed $207,199 IRMLS
Property tax history
+0.0%/yrLatest (2019): $5 · +0.0% YoY. Source: county tax records.
Cash-flow waterfall
monthlySold comps — $/sqft
last 12 mo · ≤1 miLoading sold comps…