51XPS16442BH2MH Plan · Peoria, AZ
Flood risk 1/10 · Minimal
- FEMA flood zone
- X (shaded)
- Chance of flooding over 30 yrs
- 0.0%
- Est. flood insurance / yr
- $507 – $1,088
Fire risk 1/10 · Minimal
- Est. fire insurance / yr
- $610 – $1,132
Heat risk 9/10 · Severe
- Hot days now (above 112°F)
- 6 days/yr
- Hot days in 30 yrs
- 17 days/yr
Wind risk 1/10 · Minimal
- Chance of severe wind over 30 yrs
- —
Air-quality risk 3/10 · Minor
- Unhealthy air days now
- 3 days/yr
- Unhealthy air days in 30 yrs
- 3 days/yr
Risk factors via First Street. Map © Google.
Why this score? — see what drove the D+ grade
The composite is a weighted blend of 9 inputs, each scored 0–100. Each bar is that input's sub-score; the figure is the points it added to the 100-point composite (weight × sub-score).
- Cash flow +15.0/30.0
- ARV discount +9.0/15.0
- 1% rule +5.0/10.0
- DSCR +5.0/10.0
- Livability +3.8/5.0
- Condition / age +3.8/5.0
- Schools +3.5/10.0
- Rent growth +2.2/5.0
- Appreciation +0.0/10.0
$33,500
🖨 Deal sheet 📄 Offer letter ✓ Due diligence
Listing remarks
55+ age qualified community. Welcome to Casa del Sol Resort East III a 55+ age-qualified active and vibrant community, where you can find yourself in your dream home. We have a updated 2021 2 bed, 1 bath home for sale featuring 704.00 sq ft of beautifully designed living space. Located in Peoria, this property offers the perfect blend of modern amenities and timeless charm. Step inside to find an open-concept floor plan, hardwood floors, and natural light, . The kitchen boasts has just been updated and has all the appliances that come with it and new cabinetry. , perfect for both everyday living and entertaining. The spacious bathroom come complete with dual vanities, and a new shower. , wh
Key facts
- Dual vanities
- New shower
- Updated kitchen
Tags
Property features AI
Finance
- Financial info: List price $34,500
Exterior
- Home design: Plan: 51XPS16442BH2MH; New construction plan
- Exterior features: Address: 10960 N 67th Ave, Glendale AZ 85304
Interior
- Bedrooms: 2 bedrooms
- Bathrooms: 1 full bathroom
- Interior features: Living area approximately 704
Neighborhood map
What this means for you Summary
Snapshot
- This is a 2-bed/1.0-bath manufactured listed at $34k. Condition is rated good.
Deal economics
- At list price, monthly cash flow is $919 ($11k/yr) — positive.
- The deal already cash-flows at list — no discount required.
- Meets the 1% rule at list price ($1k rent vs $34k).
- Recommended offer: $32k (3.0% below list) — sets the bar for market timing.
- Cap rate 39.2% vs local median 3.3% in Peoria — top-decile yield for the area; either an underpriced asset or a hidden risk that comps aren't pricing in. Stress-test before assuming the spread holds.
Location & tenants
- Location reads 76/100 on livability (#14 in AZ, #3,603 nationally) — a middle-class / working-renter tenant base. Strengths: housing A+, commute A, employment A; Watch: cost of living C-, amenities D, health & safety F.
- Peoria Unified School District (4237) (suburban): math 36% / reading 42% proficiency, ranked #64 of 249 in AZ (top 26%) — families likely to look elsewhere, expect single-tenant / working-renter base with shorter leases.
- Market conditions: Rents soft (-1.3%/yr); 125 active listings in the ZIP; 7 comparable units currently listed for rent nearby; rentals leasing fast (median 1d on market — plan ~1-2 weeks tenant-placement turnaround); solid renter incomes; 36,011 units permitted in Maricopa County in 2024 (12,801 in 5+ unit buildings).
Forward outlook
- Local home prices are declining (-3.0%/yr); year-one equity from $232 of loan paydown is wiped out by about $1k of value loss. Plan a longer hold.
- Maricopa County population projected at +38% by 2050 — long-run rental-demand tailwind backs the buy-and-hold thesis.
- At projected returns (-3.0% appreciation + 0.0% rent growth), your $9k cash investment doubles in ~1 year — after that, you're playing with house money.
Negotiation context
- It's been on market 55 days — a 3% lower offer ($32k) is reasonable based on typical stale-listing flexibility.
Risks & watch-outs
- Climate carrying-cost: extreme-heat days projected 6→17/yr by 2055 (HVAC capex compounding) — expect insurance premiums to compound above CPI over the hold.
Questions for the listing agent
- It's been on market 55 days. Have you received any prior offers? Is the seller open to a 3% concession, seller financing, or rate buy-down credit?
- Is there a deadline driving the sale (1031 exchange, divorce, estate, relocation)? That informs how much negotiation room exists.
- Schools are B-rated — typically a magnet for longer-tenancy family renters. What's the average tenant stay here, and is there a school-zone premium baked into asking?
- The area grade is low — what's the realistic commute time and amenity access for the typical tenant pool here? Any planned neighborhood developments (good or bad) we should know about?
- What's the average days-on-market for RENTAL listings here right now (not sales)? A rising rental-DOM trend means longer vacancies and softer asking-rent achievability than the comps imply.
- What's the recent tenant-quality profile in this submarket — average credit score on applications, eviction rate, late-payment / NSF rate, and stable-employment percentage? A property-management company in the area should have these aggregated.
- How much new for-sale + rental construction is in the pipeline within 1–3 miles? Heavy new supply typically softens prices + rents 12–24 months out; constrained supply supports both.
Investment metrics
- 1% rule
- 4.35% ✓
- Cap rate
- 39.19%
- Cash-on-cash
- 117.51%
- DSCR
- 6.23
- GRM
- 1.9
CMA / ARV
- ARV (median comp)
- $34,620
- List price
- $33,500
- Delta
- -3.24%
- Verdict
- FAIR
- Comps
- 8 within 1.0 mi
Show comp detail 8 sales within ~0.75 mi
| Address | Dist | Beds/Ba | Sqft | Sold | Price | $/sf | Match |
|---|---|---|---|---|---|---|---|
| 10960 N 67th Ave #233 | 0.00mi | 1/1.0 (-1) | 672 (-4%) | 1mo | $14,000 | $21 | 87 |
| 10960 N 67th Ave #118 | 0.01mi | 1/1.0 (-1) | 760 (+8%) | 4mo | $45,000 | $59 | 78 |
| 10960 N 67th Ave #174 | 0.11mi | 1/1.0 (-1) | 738 (+5%) | 5mo | $12,000 | $16 | 78 |
| 10960 N 67th Ave #6 | 0.00mi | 2/2.0 | 792 (+12%) | 1mo | $45,000 | $57 | 74 |
| 6960 W Peoria Ave #2 | 0.33mi | 2/2.0 | 728 (+3%) | 8mo | $46,000 | $63 | 69 |
| 10960 N 67th Ave Unit 103-2 | 0.01mi | 2/2.0 | 792 (+12%) | 12mo | $32,000 | $40 | 65 |
| 10960 N 67th Ave #189 | 0.00mi | 2/2.0 | 792 (+12%) | 15mo | $48,700 | $61 | 63 |
| 10960 N 67th Ave #10 | 0.00mi | 1/1.0 (-1) | 792 (+12%) | 20mo | $42,000 | $53 | 58 |
Match score weights: distance 35% · size 25% · config 20% · recency 20%. Top-matched comps best support the ARV.
Projected returns pro-forma
-3.0% appreciation · 0.0% rent growth · sell at horizon
- IRR
- —
- Equity multiple
- 6.21×
- Total profit
- $48,828
- Equity at exit
- $4,995
- IRR
- —
- Equity multiple
- 11.82×
- Total profit
- $101,449
- Equity at exit
- $2,896
Cash invested: $9,380 (down + closing). Projections, not guarantees.
Landlord ↔ Tenant lean methodology
- Overall (STATE)
- 87 Strongly Landlord-Friendly
- State Arizona
- 87 Strongly Landlord-Friendly · R+3
- County
- — inherits STATE
- City
- — inherits STATE
ZIP-level market 85304
- Rents YoY
- -1.3%
- Active inventory
- 125
- Price-to-rent
- 1.9×
Monthly cashflow live
- Estimated rent
- $1,456 high interval (Pro) →
- Mortgage (P&I)
- −$176
- Tax est. 1.5%
- −$42 /mo · $502/yr
- Insurance
- −$14
- HOA
- −$0
- Vacancy / Maint / Mgmt
- −$306
- Net cashflow
- $919
Break-even live
UW: 25.0% down · 7.5% · 30yr · 1.5% tax · 5.0% vac · 8.0% maint · 8.0% mgmt
Financing live
Cash to close
- Down payment
- $8,375
- Closing costs
- $1,005
- Reserves months
- —
- Total cash needed
- —
Loan-product check · same deal, 3 products live
Conventional
25% down · 7.5% · 30yr
- Down + closing
- —
- Monthly P&I
- —
- Monthly cashflow
- —
- DSCR
- —
- Eligible?
- —
Personal DTI + credit; lowest rate.
DSCR
20% down · 8.5% · 30yr
- Down + closing
- —
- Monthly P&I
- —
- Monthly cashflow
- —
- DSCR
- —
- Eligible?
- —
No personal income docs; deal must DSCR.
Hard money
10% down · 12.0% · 12mo
- Down + closing
- —
- Monthly P&I
- —
- Monthly cashflow
- —
- DSCR
- —
- Eligible?
- —
Short-term bridge; refi at stabilization.
Rent comps 7 comps
| Address | Beds | Baths | Sqft | Rent | $/sqft | DOM | Units | Dist |
|---|---|---|---|---|---|---|---|---|
| 6960 W Peoria Ave #90 Peoria, AZ | 2.0 | 1.0 | 704 | $1,320 | $1.88 | 24d | 1 | 0.40mi |
| 10654 N 60th Ave Glendale, AZ | 1.0–2.0 | 1.0–2.0 | 732 | $1,475 | $2.01 | 2d | 27 | 0.79mi |
| 9350 N 67th Ave Unit A1 Glendale, AZ | 1.0 | 1.0 | 600 | $990 | $1.65 | 24d | 1 | 1.07mi |
| 6201 W Olive Ave Unit A4 Glendale, AZ | 1.0 | 1.0 | 585 | $875 | $1.50 | 1d | 1 | 1.43mi |
| 6201 W Olive Ave Unit A2 Glendale, AZ | 1.0 | 1.0 | 456 | $825 | $1.81 | 1d | 1 | 1.43mi |
| 6201 W Olive Ave Unit A3 Glendale, AZ | 1.0 | 1.0 | 554 | $820 | $1.48 | 1d | 1 | 1.43mi |
| 6201 W Olive Ave Glendale, AZ | 1.0 | 1.0 | 585 | $960 | $1.64 | 1d | 1 | 1.49mi |
Listing history 16 events
-
2026-06-18days on market $33,500 Active 55 DOM
-
2026-06-17days on market $33,500 Active 54 DOM
-
2026-06-16days on market $33,500 Active 53 DOM
-
2026-06-15days on market $33,500 Active 52 DOM
-
2026-06-13days on market $33,500 Active 50 DOM
-
2026-06-13days on market $33,500 Active 49 DOM
-
2026-06-09days on market $33,500 Active 46 DOM
-
2026-06-08days on market $33,500 Active 45 DOM
-
2026-06-07days on market $33,500 Active 44 DOM
-
2026-06-04days on market $33,500 Active 41 DOM
-
2026-06-03days on market $33,500 Active 40 DOM
-
2026-06-02days on market $33,500 Active 39 DOM
-
2026-06-01days on market $33,500 Active 38 DOM
-
2026-05-31days on market $33,500 Active 37 DOM
-
2026-05-02price $33,500 1497-char remark
-
2026-04-24$34,500 Active 1497-char remark
ⓘ Source: listings_history table (triggers on properties + properties_extension) + one-shot
backfill from property_details.listing_events for pre-trigger history.
Climate risk First Street
- Flood 1/10 Low FEMA zone X (shaded) · 0% chance over 30 yrs
- Wildfire 1/10 Low
- Heat 9/10 Extreme 6 d/yr ≥112°F today · 17 d/yr by 30 yrs out
- Wind 1/10 Low
- Air quality 3/10 Moderate 3 unhealthy d/yr today · 3 by 30 yrs out
Nearby sold comps map
Loading sold comps map…
Walkable amenities ~0.75 mi
Loading nearby amenities…
Taxation est. · year 1
- Rental income
- $17,469
- − Mortgage interest
- −$1,877
- − Property taxes
- −$502
- − Insurance
- −$168
- − Repairs & maintenance
- −$1,397
- − Management
- −$1,397
- − Depreciation
- −$975
- Taxable income
- $11,153
- Est. tax owed @ 24.0%
- −$2,677
- After-tax cash flow
- $8,345/yr
For passive investors: Depreciation is non-cash, so a rental often shows a tax loss while cash-flowing — sheltering income. Rental losses are passive: they offset passive income freely, and up to $25,000/yr can offset ordinary (W-2) income if you actively participate and your MAGI is under $100k (phasing out to $0 by $150k); unused losses carry forward. On sale, claimed depreciation is recaptured at up to 25%, and gains may owe capital-gains tax (a 1031 exchange can defer both). Figures are a year-1 estimate at your 24.0% rate — not tax advice; consult a CPA.
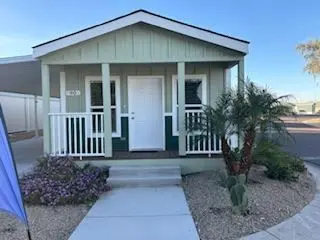
Condition & rehab AI · 1 photo
This 55+ age-qualified home in Peoria, AZ is in good condition with recent updates to the kitchen and bathroom. It offers a good investment opportunity with potential for cosmetic improvements to boost its resale and rental value.
Value-add opportunities
- Both Painting the exterior and interior — Enhances curb appeal and interior aesthetics.
- Both Landscaping improvements — Enhances curb appeal and adds value to the property.
Renovation cost estimate screening
Value-add ROI direction
- Both Painting the exterior and interior — Enhances curb appeal and interior aesthetics. ↑
- Both Landscaping improvements — Enhances curb appeal and adds value to the property. ↑
ⓘ Cost ranges are severity-bucket heuristics (US national rule-of-thumb). Get contractor quotes + a written scope before underwriting a rehab budget.
Schools (NCES district)
- District
- Peoria Unified School District (4237)
- NCES district ID
- 0406250
- Math proficiency
- 36% ▼ -14.00%
- Reading proficiency
- 42% ▼ -8.00%
- Median HH income
- $60,171
- Composite
- 34.62/100
- National rank
- #5152
- State rank
- #64 of 249 in AZ
Livability — Peoria
- Score
- 76/100
- State rank
- #14
- US rank
- #3603
Category grades
Schools grade is shown separately in the Schools card above.
Census & demographics
- Census place
- Peoria, AZ
- County
- Maricopa County · 4,537,380 people
- City population
- 206,687
- Metro
- Phoenix-Mesa-Chandler, AZ
- Population (ZIP)
- 29,861
- Household income
- $86,927
- Rent vs Own
- Severe rent burden
- 640.0
Population outlook (Maricopa County) Hauer SSP2
- Today (2025)
- 4,979,203 people
- By 2030
- 5,378,229 · +8.0%
- By 2040
- 6,156,598 · +23.6%
- By 2050
- 6,872,376 · +38.0%
- By 2075
- 8,401,270 · +68.7%
- By 2100
- 9,247,439 · +85.7%
Race, ethnicity, and origin ACS 2023
- Neighborhood character
- Majority White (61%)
- Race & ethnicity
- White 61% Hispanic / Latino 30% Two or more races 16% Black 2% Asian 2% Native American 2%
- Hispanic origin (detail)
- Mexican 24%
- Common ancestry
- Lithuanian 3% Romanian 2% Portuguese 2%
- Foreign-born
- 7% · Canada, Vietnam, China
- Languages at home
- 83% English-only · Spanish 14% Other Indo-European 1% Vietnamese 1%
Political lean MEDSL · Maricopa
- 2024 margin
- Toss-up / Even · D 47.7% · R 51.2% · Other 1.1%
- 2008→2024 swing
- +7.1pp toward D · 2008: -10.6pp · 2024: -3.5pp
- All cycles
- 2024: R+3.5 2020: D+2.2 2016: R+3.5 2012: R+12.0 2008: R+10.6
Not yet ingested
- Civics
- —
Market trends
- HPI YoY
- ▼ -259.68%
- Current HPI
- 310.0679
- Rent YoY
- ▼ -1.30%
- Metro
- Phoenix-Mesa-Chandler, AZ
- State GDP YoY
- ▲ 4.54%
- F500 in state
- 20
Industry mix (Fortune 500 HQ in AZ)
| Industry | F500 HQs | Revenue |
|---|---|---|
| Technology | 2 | $13B |
|
||
| Mining / Metals | 1 | $23B |
|
||
| Environmental Services | 1 | $16B |
|
||
| Metals / Steel | 1 | $14B |
|
||
| Technology Distribution | 1 | $9B |
|
||
| Homebuilding | 1 | $8B |
|
||
Cash-flow waterfall
monthlySold comps — $/sqft
last 12 mo · ≤1 miLoading sold comps…