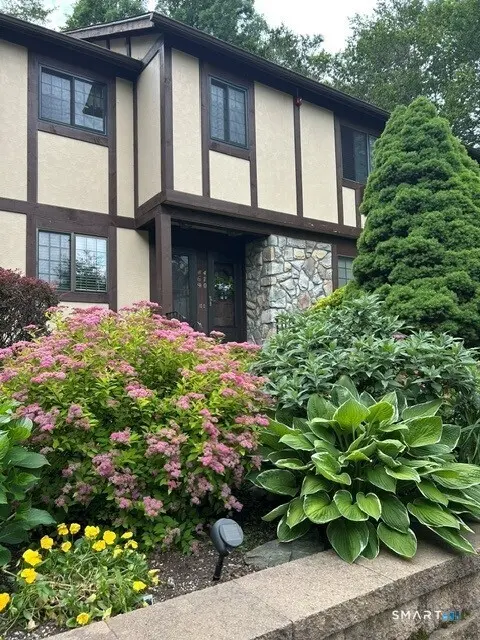
470 Swanson Cres #470 · Milford, CT
Flood risk No data
- FEMA flood zone
- —
- Chance of flooding over 30 yrs
- —
- Est. flood insurance / yr
- —
Fire risk No data
- Est. fire insurance / yr
- —
Heat risk No data
- Hot days now (above threshold)
- —
- Hot days in 30 yrs
- —
Wind risk No data
- Chance of severe wind over 30 yrs
- —
Air-quality risk No data
- Unhealthy air days now
- —
- Unhealthy air days in 30 yrs
- —
Risk factors via First Street. Map © Google.
Why this score? — see what drove the D grade
The composite is a weighted blend of 9 inputs, each scored 0–100. Each bar is that input's sub-score; the figure is the points it added to the 100-point composite (weight × sub-score).
- Cash flow +11.9/30.0
- ARV discount +7.5/15.0
- 1% rule +4.9/10.0
- Schools +4.6/10.0
- DSCR +3.5/10.0
- Rent growth +2.5/5.0
- Livability +2.5/5.0
- Condition / age +2.5/5.0
- Appreciation +0.0/10.0
$282,000
🖨 Deal sheet 📄 Offer letter ✓ Due diligence
Listing remarks MLS
Desirable well run, self managed and nicely maintained, pet friendly complex. Washer and dryer in unit. Fantastic location, less than a half mile to shopping mall, restaurants, highways, downtown and train station yet quiet and peaceful. Unit needs updating throughout yet priced for it. It has an eat in kitchen with pantry closet, dining room, spacious living room, bedroom and deck. Very reasonable condo fees include heat, hot water, beautiful inground pool, tennis courts and bocci court. Units cannot be rented.
Key facts
- Pantry
- Stainless appliances
- Eat-in kitchen
Tags
Property features AI
Finance
- Other: Complex amenities include pool, tennis courts, basketball court, bocci court, clubhouse, guest parking; Nearby amenities: commuter bus, health club, library, medical facilities, shopping/mall
- Financial info: HOA fee: $328 monthly; One pet per unit allowed (restrictions apply)
- HOA & community: Homeowners association with monthly fee; HOA fee includes heat, hot water, water, pool service, grounds maintenance, trash pickup, snow removal, road maintenance, tennis
Exterior
- Parking: Paved off-street parking; Assigned parking (1 space)
- Utilities: Public water connected; Public sewer connected; Natural gas for hot water and heating
- Home design: Condominium unit; Part of Foxwood complex; Beige exterior color
- Construction: Frame construction
- Exterior features: Clapboard/wood siding; Deck; Gutters; Exterior lighting; Sidewalk; Tennis court on-site; In-ground swimming pool with pool house and safety fence
Interior
- Kitchen: Electric range / oven; Microwave; Refrigerator; Dishwasher
- Bedrooms: 1 bedroom (single-level unit)
- Bathrooms: 1 full bathroom
- Heating & cooling: Hot water/baseboard heating; Natural gas hot water; Ceiling fans; Wall unit cooling
- Interior features: Open floor plan; Cable available; Ceiling fans; Wall air-conditioning unit; Partial basement with storage
- Laundry & utility: Washer and dryer included; Laundry located in the bathroom (main level)
Neighborhood map
What this means for you Summary
Snapshot
- This is a 1-bed/1.0-bath condo listed at $282k.
Deal economics
- At list price, monthly cash flow is $-70 ($-845/yr) — negative.
- To cash-flow at today's rent, offer at most $272k (3.6% below list).
- To meet the 1% rule (rent ≥ 1% of price), the offer needs to be $279k (1.0% below list).
- Recommended offer: $272k (3.6% below list) — sets the bar for cash-flow.
Location & tenants
- Location reads: area grade D — affects rentability + tenant quality, not the cash-flow math above.
- Milford School District (urban): math 44% / reading 58% proficiency, ranked #73 of 153 in CT (top 48%) — acceptable for families but not a draw, mixed tenant base, ~2y average lease; only 15% free/reduced lunch — higher-income household profile.
- Market conditions: 55 active listings in the ZIP; 3 comparable units currently listed for rent nearby; rentals leasing fast (median 3d on market — plan ~1-2 weeks tenant-placement turnaround); high-income renter base; 1,059 units permitted in South Central Connecticut Planning Region in 2024 (779 in 5+ unit buildings).
Forward outlook
- Local home prices are declining (-3.0%/yr); year-one equity from $2k of loan paydown is wiped out by about $8k of value loss. Plan a longer hold.
Negotiation context
- Only 5 days on market — expect competitive offers; lowballing is unlikely to land.
- Current owner paid $121k; list at $282k implies a 133% gain — meaningful room to come down on a strong offer.
Questions for the listing agent
- What do current leases actually rent for vs. the listed asking? Can we see a recent rent roll and the last 12 months of T-12 income?
- Built in 1978 — when were the roof, HVAC, electrical panel, plumbing, and water heater last replaced?
- What does the HOA fee cover, when was the last increase, and are there any pending special assessments or reserve-fund shortfalls?
- Any open or pending special assessments — roof, HVAC, plumbing, elevator, façade? What's the per-unit balance and payoff schedule, and is the seller paying it off at close or rolling it to the buyer?
- Is there a deadline driving the sale (1031 exchange, divorce, estate, relocation)? That informs how much negotiation room exists.
- The area grade is low — what's the realistic commute time and amenity access for the typical tenant pool here? Any planned neighborhood developments (good or bad) we should know about?
- What's the average days-on-market for RENTAL listings here right now (not sales)? A rising rental-DOM trend means longer vacancies and softer asking-rent achievability than the comps imply.
- What's the recent tenant-quality profile in this submarket — average credit score on applications, eviction rate, late-payment / NSF rate, and stable-employment percentage? A property-management company in the area should have these aggregated.
- How much new apartment / multifamily construction is in the pipeline within 1–3 miles? Heavy new supply (>2% of stock underway) typically softens rents 12–24 months out; light construction supports rent growth.
Investment metrics
- 1% rule
- 0.99% ✗
- Cap rate
- 5.99%
- Cash-on-cash
- -1.07%
- DSCR
- 0.95
- GRM
- 8.4
CMA / ARV
No comps found within radius.
Projected returns pro-forma
-3.0% appreciation · 3.0% rent growth · sell at horizon
- IRR
- -17.9%
- Equity multiple
- 0.37×
- Total profit
- $-49,936
- Equity at exit
- $42,047
- IRR
- -10.0%
- Equity multiple
- 0.39×
- Total profit
- $-48,267
- Equity at exit
- $24,382
Cash invested: $78,960 (down + closing). Projections, not guarantees.
Landlord ↔ Tenant lean methodology
- Overall (STATE)
- 27 Tenant-Leaning
- State Connecticut
- 27 Tenant-Leaning · D+7
- County
- — inherits STATE
- City
- — inherits STATE
ZIP-level market 06461
- Active inventory
- 55
- Price-to-rent
- 8.4×
Monthly cashflow live
- Estimated rent
- $2,793 medium interval (Pro) →
- Mortgage (P&I)
- −$1,479
- Tax est. 1.5%
- −$352 /mo · $4,230/yr
- Insurance
- −$118
- HOA
- −$328
- Vacancy / Maint / Mgmt
- −$587
- Net cashflow
- $-70
Break-even live
UW: 25.0% down · 7.5% · 30yr · 1.5% tax · 5.0% vac · 8.0% maint · 8.0% mgmt
Financing live
Cash to close
- Down payment
- $70,500
- Closing costs
- $8,460
- Reserves months
- —
- Total cash needed
- —
Loan-product check · same deal, 3 products live
Conventional
25% down · 7.5% · 30yr
- Down + closing
- —
- Monthly P&I
- —
- Monthly cashflow
- —
- DSCR
- —
- Eligible?
- —
Personal DTI + credit; lowest rate.
DSCR
20% down · 8.5% · 30yr
- Down + closing
- —
- Monthly P&I
- —
- Monthly cashflow
- —
- DSCR
- —
- Eligible?
- —
No personal income docs; deal must DSCR.
Hard money
10% down · 12.0% · 12mo
- Down + closing
- —
- Monthly P&I
- —
- Monthly cashflow
- —
- DSCR
- —
- Eligible?
- —
Short-term bridge; refi at stabilization.
Rent comps 3 comps
| Address | Beds | Baths | Sqft | Rent | $/sqft | DOM | Units | Dist |
|---|---|---|---|---|---|---|---|---|
| 70 Tumblebrook Rd Milford, CT | 2.0 | 1.0 | 1056 | $3,500 | $3.31 | 44d | 1 | 0.51mi |
| 158 Cherry St Milford, CT | 1.0 | 1.0 | 703 | $2,535 | $3.61 | 3d | 1 | 1.31mi |
| 99 Cherry St Unit 1 Milford, CT | 1.0 | 1.5 | 850 | $2,250 | $2.65 | 3d | 1 | 1.44mi |
HOA detail condo
- Monthly dues
- $328 · $3,936/yr
- Likely covers
- waterpool
- Assessments
- None detected in remarks — confirm with the listing agent.
Listing history 7 events
-
2026-06-18days on market $282,000 Active 5 DOM
-
2026-06-17days on market $282,000 Active 4 DOM
-
2026-06-16days on market $282,000 Active 3 DOM
-
2026-06-15days on market $282,000 Active 2 DOM
-
2026-06-14status $282,000 Active 1 DOM
-
2026-06-13remarks 699-char remark
-
2026-06-13$282,000 Coming Soon 1 DOM
ⓘ Source: listings_history table (triggers on properties + properties_extension) + one-shot
backfill from property_details.listing_events for pre-trigger history.
Nearby sold comps map
Loading sold comps map…
Walkable amenities ~0.75 mi
Loading nearby amenities…
Taxation est. · year 1
- Rental income
- $33,516
- − Mortgage interest
- −$15,796
- − Property taxes
- −$4,230
- − Insurance
- −$1,410
- − Repairs & maintenance
- −$2,681
- − Management
- −$2,681
- − HOA
- −$3,936
- − Depreciation
- −$8,204
- Taxable loss
- −$5,423
- Est. tax savings @ 24.0%
- +$1,302
- After-tax cash flow
- $457/yr
For passive investors: Depreciation is non-cash, so a rental often shows a tax loss while cash-flowing — sheltering income. Rental losses are passive: they offset passive income freely, and up to $25,000/yr can offset ordinary (W-2) income if you actively participate and your MAGI is under $100k (phasing out to $0 by $150k); unused losses carry forward. On sale, claimed depreciation is recaptured at up to 25%, and gains may owe capital-gains tax (a 1031 exchange can defer both). Figures are a year-1 estimate at your 24.0% rate — not tax advice; consult a CPA.
Schools (NCES district)
- District
- Milford School District
- NCES district ID
- 0902520
- Math proficiency
- 44% ▼ -14.00%
- Reading proficiency
- 58% ▼ -11.00%
- Median HH income
- $80,198
- Composite
- 46.45/100
- National rank
- #2444
- State rank
- #73 of 153 in CT
Livability — Milford
No livability data for this city. (Only ~50 U.S. cities are tracked.)
Census & demographics
- Census place
- Milford city (balance), CT
- County
- New Haven County · 688,236 people
- City population
- 52,684
- Metro
- New Haven-Milford, CT
- Population (ZIP)
- 15,035
- Household income
- $133,221
- Rent vs Own
- Severe rent burden
- 134.0
Population outlook (South Central Connecticut County) Hauer SSP2
- By 2040
- 608,362
Race, ethnicity, and origin ACS 2023
- Neighborhood character
- Predominantly White (76%)
- Race & ethnicity
- White 76% Hispanic / Latino 11% Two or more races 8% Asian 8% Black 1%
- Hispanic origin (detail)
- Mexican 2% Puerto Rican 5%
- Common ancestry
- Romanian 10% Scotch-Irish 2% Lithuanian 2%
- Foreign-born
- 12% · Canada, China, Vietnam
- Languages at home
- 84% English-only · Other Indo-European 5% Spanish 5% Russian/Polish/Slavic 2%
Political lean MEDSL · South Central Connecticut
- 2024 margin
- Strong D (+20.1) · D 59.0% · R 38.9% · Other 2.1%
- All cycles
- 2024: D+20.1
Not yet ingested
- Civics
- —
Market trends
- HPI YoY
- ▼ -207.85%
- Current HPI
- 248.904
- Rent YoY
- —
- Metro
- New Haven-Milford, CT
- State GDP YoY
- ▲ 1.06%
- F500 in state
- 38
Industry mix (Fortune 500 HQ in CT)
| Industry | F500 HQs | Revenue |
|---|---|---|
| Industrial Machinery | 4 | $38B |
|
||
| Insurance | 3 | $71B |
|
||
| Financial Services | 2 | $25B |
|
||
| Transportation / Logistics | 2 | $18B |
|
||
| Healthcare | 1 | $247B |
|
||
| Telecommunications | 1 | $55B |
|
||
Price history
+120.3% since first listed4 events — show timeline
- 2026-06-12 Coming Soon $282,000 Smart MLS
- 2018-02-16 Sold (MLS) $121,000 Smart MLS
- 2018-01-22 Pending — Smart MLS
- 2018-01-08 Listed $128,000 Smart MLS
Cash-flow waterfall
monthlySold comps — $/sqft
last 12 mo · ≤1 miLoading sold comps…