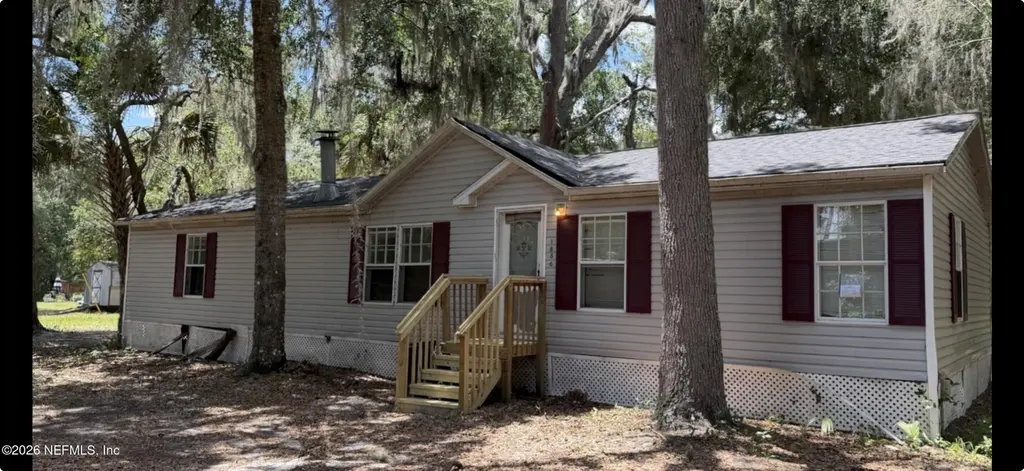
1886 County Road 308 · Crescent City, FL
Flood risk 1/10 · Minimal
- FEMA flood zone
- X (unshaded)
- Chance of flooding over 30 yrs
- 0.0%
- Est. flood insurance / yr
- $507 – $1,088
Fire risk 7/10 · Major
- Est. fire insurance / yr
- $947 – $1,759
Heat risk 8/10 · Major
- Hot days now (above 108°F)
- 7 days/yr
- Hot days in 30 yrs
- 20 days/yr
Wind risk 9/10 · Severe
- Chance of severe wind over 30 yrs
- 99.0%
Air-quality risk 3/10 · Minor
- Unhealthy air days now
- 3 days/yr
- Unhealthy air days in 30 yrs
- 3 days/yr
Risk factors via First Street. Map © Google.
Why this score? — see what drove the D+ grade
The composite is a weighted blend of 9 inputs, each scored 0–100. Each bar is that input's sub-score; the figure is the points it added to the 100-point composite (weight × sub-score).
- Cash flow +16.4/30.0
- Appreciation +6.4/10.0
- DSCR +5.1/10.0
- ARV discount +4.7/15.0
- 1% rule +4.5/10.0
- Schools +3.0/10.0
- Livability +2.9/5.0
- Rent growth +2.5/5.0
- Condition / age +2.2/5.0
$179,900
🖨 Deal sheet 📄 Offer letter ✓ Due diligence
Listing remarks
Take a look at this beutiful 2.55 acre lot in Crescent City. This home is ready for you to put in some sweat equity and make this house your home. Brand new roof has just been installed, but the home needs some TLC. The two older mobile homes will need to be removed and have no value, shed is a container of some sort and seems to be leak free.
Key facts
- Shed is leak free
- Brand new roof
- 2.55 acre lot
Tags
Property features AI
Finance
- HOA & community: Not a senior community
Exterior
- Parking: Other parking type
- Utilities: Septic tank; Electricity connected
- Home design: Double wide manufactured home; One story; Current use: agricultural
- Construction: Vinyl siding; Shingle roof
- Exterior features: Shingle roof; Vinyl siding; County road frontage; Asphalt road surface; 2.55-acre lot
Interior
- Kitchen: No appliances included
- Bedrooms: 3 bedrooms
- Flooring: Carpet
- Bathrooms: 2 full bathrooms
- Heating & cooling: No heating; No cooling
- Interior features: Ceiling fans; Split bedroom layout; Vaulted ceilings; Wood-burning fireplace (1)
- Laundry & utility: No heating or cooling equipment listed
Neighborhood map
What this means for you Summary
Snapshot
- This is a 3-bed/2.0-bath manufactured listed at $180k. Condition is rated fair.
Deal economics
- At list price, monthly cash flow is $101 ($1k/yr) — positive.
- The deal already cash-flows at list — no discount required.
- To meet the 1% rule (rent ≥ 1% of price), the offer needs to be $170k (5.4% below list).
- Recommended offer: $170k (5.4% below list) — sets the bar for 1% rule.
- Cap rate 7.0% vs local median 3.1% in Crescent City — top-decile yield for the area; either an underpriced asset or a hidden risk that comps aren't pricing in. Stress-test before assuming the spread holds.
Location & tenants
- Location reads 57/100 on livability (#857 in FL) — a working-class tenant base; expect higher turnover. Strengths: crime A+, cost of living A+; Watch: health & safety C-, schools F, amenities F.
- Putnam (town): math 34% / reading 39% proficiency, ranked #66 of 73 in FL (top 90%) — families likely to look elsewhere, expect single-tenant / working-renter base with shorter leases; 71% free/reduced lunch — lower-income household profile, screen leases tightly.
- Market conditions: 143 active listings in the ZIP; 113 units permitted in Putnam County in 2024 (0 in 5+ unit buildings).
Forward outlook
- In year one you build about $6k of equity ($1k loan paydown + $5k appreciation (2.9% local appreciation)).
- Putnam County population projected at -31% by 2050 — secular population decline; favor cash flow + early exit over multi-decade hold.
- At projected returns (2.9% appreciation + 3.0% rent growth), your $50k cash investment doubles in ~6 years — after that, you're playing with house money.
- By year 6, paydown + projected appreciation supports a ~$34k cash-out refi (75% LTV) — recoverable capital for the next deal without selling this one.
Negotiation context
- Only 13 days on market — expect competitive offers; lowballing is unlikely to land.
Risks & watch-outs
- Climate carrying-cost: severe wind risk, 99% chance of damaging wind over 30y; major wildfire risk; extreme-heat days projected 7→20/yr by 2055 (HVAC capex compounding) — expect insurance premiums to compound above CPI over the hold.
Questions for the listing agent
- Have any recent inspections been done? Can we get a copy of the seller's disclosures and any deferred-maintenance estimates?
- Is there a deadline driving the sale (1031 exchange, divorce, estate, relocation)? That informs how much negotiation room exists.
- Schools are F-rated, which usually means shorter tenancies and higher turnover. Who's the typical renter profile here, and what's been the actual vacancy rate?
- The area grade is low — what's the realistic commute time and amenity access for the typical tenant pool here? Any planned neighborhood developments (good or bad) we should know about?
- What's the average days-on-market for RENTAL listings here right now (not sales)? A rising rental-DOM trend means longer vacancies and softer asking-rent achievability than the comps imply.
- What's the recent tenant-quality profile in this submarket — average credit score on applications, eviction rate, late-payment / NSF rate, and stable-employment percentage? A property-management company in the area should have these aggregated.
- How much new for-sale + rental construction is in the pipeline within 1–3 miles? Heavy new supply typically softens prices + rents 12–24 months out; constrained supply supports both.
Investment metrics
- 1% rule
- 0.95% ✗
- Cap rate
- 6.97%
- Cash-on-cash
- 2.41%
- DSCR
- 1.11
- GRM
- 8.8
CMA / ARV
- ARV (on-the-fly)
- $169,290
- Comps found
- 2
Show comp detail 2 sales within ~0.75 mi
| Address | Dist | Beds/Ba | Sqft | Sold | Price | $/sf | Match |
|---|---|---|---|---|---|---|---|
| 123 Peninsular Dr | 0.67mi | 2/2.0 (-1) | 1,345 (-13%) | 3mo | $131,950 | $98 | 40 |
| 106 Georgia Ave | 0.74mi | 3/2.0 | 1,344 (-13%) | 9mo | $148,000 | $110 | 37 |
Match score weights: distance 35% · size 25% · config 20% · recency 20%. Top-matched comps best support the ARV.
Projected returns pro-forma
2.86% appreciation · 3.0% rent growth · sell at horizon
- IRR
- 9.4%
- Equity multiple
- 1.53×
- Total profit
- $26,810
- Equity at exit
- $79,478
- IRR
- 11.9%
- Equity multiple
- 2.75×
- Total profit
- $88,138
- Equity at exit
- $121,399
Cash invested: $50,372 (down + closing). Projections, not guarantees.
Landlord ↔ Tenant lean methodology
- Overall (STATE)
- 87 Strongly Landlord-Friendly
- State Florida
- 87 Strongly Landlord-Friendly · R+3
- County
- — inherits STATE
- City
- — inherits STATE
ZIP-level market 32112
- Home prices YoY
- 1.0%
- Active inventory
- 143
- Price-to-rent
- 8.8×
Monthly cashflow live
- Estimated rent
- $1,702 medium interval (Pro) →
- Mortgage (P&I)
- −$943
- Tax est. 1.5%
- −$225 /mo · $2,698/yr
- Insurance
- −$75
- HOA
- −$0
- Vacancy / Maint / Mgmt
- −$357
- Net cashflow
- $101
Break-even live
UW: 25.0% down · 7.5% · 30yr · 1.5% tax · 5.0% vac · 8.0% maint · 8.0% mgmt
Financing live
Cash to close
- Down payment
- $44,975
- Closing costs
- $5,397
- Reserves months
- —
- Total cash needed
- —
Loan-product check · same deal, 3 products live
Conventional
25% down · 7.5% · 30yr
- Down + closing
- —
- Monthly P&I
- —
- Monthly cashflow
- —
- DSCR
- —
- Eligible?
- —
Personal DTI + credit; lowest rate.
DSCR
20% down · 8.5% · 30yr
- Down + closing
- —
- Monthly P&I
- —
- Monthly cashflow
- —
- DSCR
- —
- Eligible?
- —
No personal income docs; deal must DSCR.
Hard money
10% down · 12.0% · 12mo
- Down + closing
- —
- Monthly P&I
- —
- Monthly cashflow
- —
- DSCR
- —
- Eligible?
- —
Short-term bridge; refi at stabilization.
Listing history 9 events
-
2026-06-18days on market $179,900 Active 13 DOM
-
2026-06-17days on market $179,900 Active 12 DOM
-
2026-06-16days on market $179,900 Active 11 DOM
-
2026-06-15days on market $179,900 Active 10 DOM
-
2026-06-13days on market $179,900 Active 8 DOM
-
2026-06-09days on market $179,900 Active 4 DOM
-
2026-06-08days on market $179,900 Active 3 DOM
-
2026-06-07remarks 345-char remark
-
2026-06-07$179,900 Active 2 DOM
ⓘ Source: listings_history table (triggers on properties + properties_extension) + one-shot
backfill from property_details.listing_events for pre-trigger history.
Climate risk First Street
- Flood 1/10 Low FEMA zone X (unshaded) · 0% chance over 30 yrs
- Wildfire 7/10 Severe
- Heat 8/10 Severe 7 d/yr ≥108°F today · 20 d/yr by 30 yrs out
- Wind 9/10 Extreme 99% chance of damaging wind over 30 yrs
- Air quality 3/10 Moderate 3 unhealthy d/yr today · 3 by 30 yrs out
Nearby sold comps map
Loading sold comps map…
Walkable amenities ~0.75 mi
Loading nearby amenities…
Taxation est. · year 1
- Rental income
- $20,421
- − Mortgage interest
- −$10,077
- − Property taxes
- −$2,698
- − Insurance
- −$900
- − Repairs & maintenance
- −$1,634
- − Management
- −$1,634
- − Depreciation
- −$5,233
- Taxable loss
- −$1,755
- Est. tax savings @ 24.0%
- +$421
- After-tax cash flow
- $1,635/yr
For passive investors: Depreciation is non-cash, so a rental often shows a tax loss while cash-flowing — sheltering income. Rental losses are passive: they offset passive income freely, and up to $25,000/yr can offset ordinary (W-2) income if you actively participate and your MAGI is under $100k (phasing out to $0 by $150k); unused losses carry forward. On sale, claimed depreciation is recaptured at up to 25%, and gains may owe capital-gains tax (a 1031 exchange can defer both). Figures are a year-1 estimate at your 24.0% rate — not tax advice; consult a CPA.
Condition & rehab AI · 14 photos
This home requires moderate renovations, including painting, landscaping, and flooring replacement, to improve its condition and increase its resale and rental value.
Repairs flagged
- Major exterior siding — Siding appears weathered and in need of replacement.
- Major paint — Paint peeling and in need of repainting.
- Major carpet — Carpeted floors in poor condition and need replacement.
- Major landscaping — Overgrown and in need of trimming.
Value-add opportunities
- Resale Painting and repainting the exterior and interior walls — Fresh paint can significantly improve the home's curb appeal and value.
- Both Landscaping and trimming — A well-maintained yard can increase both resale and rental value.
- Resale Flooring replacement — New flooring can greatly enhance the home's appearance and value.
Renovation cost estimate screening
| Repair item | Severity | Est. cost |
|---|---|---|
| exterior siding · Siding appears weathered and in need of replacement. | Major | $15,000–50,000 |
| paint · Paint peeling and in need of repainting. | Major | $15,000–50,000 |
| carpet · Carpeted floors in poor condition and need replacement. | Major | $15,000–50,000 |
| landscaping · Overgrown and in need of trimming. | Major | $15,000–50,000 |
| Total estimated repair cost · 4 items | $60,000–200,000 |
Value-add ROI direction
- Resale Painting and repainting the exterior and interior walls — Fresh paint can significantly improve the home's curb appeal and value. ↑
- Both Landscaping and trimming — A well-maintained yard can increase both resale and rental value. ↑
- Resale Flooring replacement — New flooring can greatly enhance the home's appearance and value. ↑
ⓘ Cost ranges are severity-bucket heuristics (US national rule-of-thumb). Get contractor quotes + a written scope before underwriting a rehab budget.
Schools (NCES district)
- District
- Putnam
- NCES district ID
- 1201620
- Math proficiency
- 34% ▼ -10.00%
- Reading proficiency
- 39% ▼ -4.00%
- Median HH income
- $33,350
- Composite
- 29.99/100
- National rank
- #6361
- State rank
- #66 of 73 in FL
Livability — Crescent City
- Score
- 57/100
- State rank
- #857
- US rank
- #22035
Category grades
Schools grade is shown separately in the Schools card above.
Census & demographics
- Population (ZIP)
- 8,099
Population outlook (Putnam County) Hauer SSP2
- Today (2025)
- 65,299 people
- By 2030
- 61,255 · -6.2%
- By 2040
- 52,930 · -18.9%
- By 2050
- 45,051 · -31.0%
- By 2075
- 28,720 · -56.0%
- By 2100
- 15,852 · -75.7%
Race, ethnicity, and origin ACS 2023
- Neighborhood character
- Diverse neighborhood (Simpson 0.63)
- Race & ethnicity
- White 47% Hispanic / Latino 38% Two or more races 30% Black 8% Asian 3%
- Hispanic origin (detail)
- Mexican 34% Puerto Rican 2%
- Common ancestry
- Lithuanian 2% Romanian 2% Slovak 1%
- Foreign-born
- 20% · Canada
- Languages at home
- 64% English-only · Spanish 32% Other Asian/Pacific 3%
Political lean MEDSL · Putnam
- 2024 margin
- Solid R (+47.8) · D 25.8% · R 73.6%
- 2008→2024 swing
- -28.5pp toward R · 2008: -19.3pp · 2024: -47.8pp
- All cycles
- 2024: R+47.8 2020: R+41.2 2016: R+36.6 2012: R+24.5 2008: R+19.3
Not yet ingested
- Civics
- —
Market trends
- HPI YoY
- ▲ 2.86%
- Current HPI
- 279.58
- Rent YoY
- —
- Metro
- —
- State GDP YoY
- ▲ 3.28%
- F500 in state
- 36
Industry mix (Fortune 500 HQ in FL)
| Industry | F500 HQs | Revenue |
|---|---|---|
| Industrial Technology | 2 | $29B |
|
||
| Insurance | 2 | $17B |
|
||
| Retail | 1 | $60B |
|
||
| Technology Distribution | 1 | $58B |
|
||
| Homebuilding | 1 | $35B |
|
||
| Technology Manufacturing | 1 | $35B |
|
||
Price history
1 event — show timeline
- 2026-06-05 Listed $179,900 realMLS
Cash-flow waterfall
monthlySold comps — $/sqft
last 12 mo · ≤1 miLoading sold comps…