None · Redding, CA
Flood risk 1/10 · Minimal
- FEMA flood zone
- X (unshaded)
- Chance of flooding over 30 yrs
- 0.0%
- Est. flood insurance / yr
- $507 – $1,088
Fire risk 8/10 · Major
- Est. fire insurance / yr
- $659 – $1,223
Heat risk 8/10 · Major
- Hot days now (above 105°F)
- 5 days/yr
- Hot days in 30 yrs
- 12 days/yr
Wind risk 1/10 · Minimal
- Chance of severe wind over 30 yrs
- —
Air-quality risk 10/10 · Severe
- Unhealthy air days now
- 35 days/yr
- Unhealthy air days in 30 yrs
- 42 days/yr
Risk factors via First Street. Map © Google.
Why this score? — see what drove the B grade
The composite is a weighted blend of 9 inputs, each scored 0–100. Each bar is that input's sub-score; the figure is the points it added to the 100-point composite (weight × sub-score).
- Cash flow +30.0/30.0
- ARV discount +11.6/15.0
- 1% rule +10.0/10.0
- DSCR +10.0/10.0
- Livability +3.8/5.0
- Schools +3.1/10.0
- Rent growth +3.0/5.0
- Condition / age +2.5/5.0
- Appreciation +0.0/10.0
$67,000
🖨 Deal sheet 📄 Offer letter ✓ Due diligence
Listing remarks
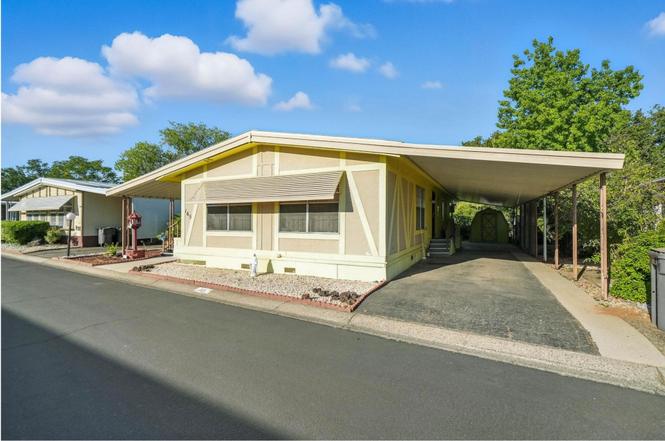
55+ Fairway Oaks Mobile Home Community. Relax and enjoy the sounds of the creek from your backyard. This double wide home offers a Sunroom and all appliances are included. Covered carport for 2 and a storage shed. Hardwired Generac generator.
Key facts
- Covered carport
- Sun room
- Storage shed
Tags
Property features AI
Finance
- HOA & community: Located in Fairway Oaks park
Exterior
- Parking: Carport (2 spaces); On-street parking available; Guest parking
- Home design: Manufactured home (mobile home) located in a park; Dualwide model; Skirted with wood
- Construction: Wood skirting; Other foundation
- Exterior features: Awning-covered patio/porch; Level topography; Asphalt road access; View
Interior
- Kitchen: Dishwasher; Disposal; Range; Oven; Refrigerator
- Flooring: Vinyl flooring; Carpet
- Heating & cooling: Central air conditioning; Has heating
- Interior features: Dishwasher; Disposal; Range; Oven; Refrigerator; No fireplace
- Laundry & utility: Washer; Dryer
Neighborhood map
What this means for you Summary
Snapshot
- This is a 2-bed/2.0-bath manufactured listed at $67k.
Deal economics
- At list price, monthly cash flow is $892 ($11k/yr) — positive.
- The deal already cash-flows at list — no discount required.
- Meets the 1% rule at list price ($2k rent vs $67k).
- Recommended offer: $59k (12.0% below list) — sets the bar for market timing.
- Cap rate 22.3% vs local median 3.3% in Redding — top-decile yield for the area; either an underpriced asset or a hidden risk that comps aren't pricing in. Stress-test before assuming the spread holds.
Location & tenants
- Location reads 76/100 on livability (#106 in CA, #3,726 nationally) — a middle-class / working-renter tenant base. Strengths: amenities A+, commute A+, health & safety A+; Watch: employment C-, crime F, cost of living F.
- Pacheco Union Elementary (rural): math 30% / reading 40% proficiency, ranked #264 of 517 in CA (top 51%) — families likely to look elsewhere, expect single-tenant / working-renter base with shorter leases.
- Market conditions: Rents rising (+1.9%/yr); 286 active listings in the ZIP; 246 units permitted in Shasta County in 2024 (0 in 5+ unit buildings).
Forward outlook
- Local home prices are declining (-3.0%/yr); year-one equity from $463 of loan paydown is wiped out by about $2k of value loss. Plan a longer hold.
- Shasta County population projected to shrink 9% by 2050 — rents likely to lag national; underwrite the cash flow, not the appreciation.
- At projected returns (-3.0% appreciation + 1.9% rent growth), your $19k cash investment doubles in ~3 years — after that, you're playing with house money.
Negotiation context
- It's been on market 298 days — a 12% lower offer ($59k) is reasonable based on typical stale-listing flexibility.
- 2 sale attempts; this cycle's ask has dropped $23k (26%) from the opening price — seller is motivated, your offer sets the floor, not the list.
Risks & watch-outs
- Climate carrying-cost: severe wildfire risk; extreme-heat days projected 5→12/yr by 2055 (HVAC capex compounding) — expect insurance premiums to compound above CPI over the hold.
Questions for the listing agent
- It's been on market 298 days. Have you received any prior offers? Is the seller open to a 12% concession, seller financing, or rate buy-down credit?
- Built in 1976 — when were the roof, HVAC, electrical panel, plumbing, and water heater last replaced?
- Why hasn't it sold? Are there any deal-killer items the seller is aware of (foundation, flood, title, zoning, code violations)?
- Is there a deadline driving the sale (1031 exchange, divorce, estate, relocation)? That informs how much negotiation room exists.
- Schools are B-rated — typically a magnet for longer-tenancy family renters. What's the average tenant stay here, and is there a school-zone premium baked into asking?
- Crime grade is F in this area — have there been break-ins, vandalism, or insurance claims at this property in the last 3 years? What carrier currently insures it and at what premium?
- What's the average days-on-market for RENTAL listings here right now (not sales)? A rising rental-DOM trend means longer vacancies and softer asking-rent achievability than the comps imply.
- What's the recent tenant-quality profile in this submarket — average credit score on applications, eviction rate, late-payment / NSF rate, and stable-employment percentage? A property-management company in the area should have these aggregated.
- How much new for-sale + rental construction is in the pipeline within 1–3 miles? Heavy new supply typically softens prices + rents 12–24 months out; constrained supply supports both.
Investment metrics
- 1% rule
- 2.56% ✓
- Cap rate
- 22.27%
- Cash-on-cash
- 57.06%
- DSCR
- 3.54
- GRM
- 3.3
CMA / ARV
- ARV (on-the-fly)
- $73,728
- Comps found
- 12
Show comp detail 12 sales within ~0.75 mi
| Address | Dist | Beds/Ba | Sqft | Sold | Price | $/sf | Match |
|---|---|---|---|---|---|---|---|
| 20350 Hole In One Dr #170 | 0.00mi | 2/2.0 | 1,536 (0%) | 1mo | $106,595 | $69 | 99 |
| 20350 Hole in One Drive Dr #112 | 0.00mi | 2/2.0 | 1,532 (-0%) | 9mo | $87,000 | $57 | 92 |
| 20350 Hole In One Dr Spc 42 | 0.00mi | 2/2.0 | 1,440 (-6%) | 1mo | $42,500 | $30 | 89 |
| 20350 Hole In One Dr Spc 122 | 0.00mi | 2/2.0 | 1,440 (-6%) | 3mo | $85,400 | $59 | 87 |
| 20350 Hole in One Dr #157 | 0.00mi | 2/2.0 | 1,464 (-5%) | 9mo | $58,900 | $40 | 85 |
| 20350 Hole in One Dr Spc 98 | 0.00mi | 2/2.0 | 1,440 (-6%) | 8mo | $55,000 | $38 | 83 |
| 20350 Hole in One Dr Spc 105 | 0.00mi | 2/2.0 | 1,440 (-6%) | 9mo | $70,000 | $49 | 82 |
| 20350 Hole In One Dr #149 | 0.00mi | 3/2.0 (+1) | 1,464 (-5%) | 10mo | $60,000 | $41 | 79 |
| 20350 Hole In One Dr Dr #118 | 0.00mi | 2/2.0 | 1,344 (-12%) | 4mo | $65,000 | $48 | 76 |
| 20350 Hole In 1 Dr Spc 24 | 0.00mi | 2/2.0 | 1,344 (-12%) | 6mo | $47,800 | $36 | 74 |
| 20350 Hole in One Dr #131 | 0.00mi | 3/2.0 (+1) | 1,411 (-8%) | 9mo | $82,000 | $58 | 74 |
| 20350 Hole in One Dr #86 | 0.00mi | 2/2.0 | 1,340 (-13%) | 11mo | $60,000 | $45 | 70 |
Match score weights: distance 35% · size 25% · config 20% · recency 20%. Top-matched comps best support the ARV.
Projected returns pro-forma
-3.0% appreciation · 1.88% rent growth · sell at horizon
- IRR
- 54.3%
- Equity multiple
- 3.35×
- Total profit
- $44,073
- Equity at exit
- $9,990
- IRR
- 58.9%
- Equity multiple
- 6.54×
- Total profit
- $103,972
- Equity at exit
- $5,793
Cash invested: $18,760 (down + closing). Projections, not guarantees.
Landlord ↔ Tenant lean methodology
- Overall (STATE)
- 18 Strongly Tenant-Friendly
- State California
- 18 Strongly Tenant-Friendly · D+13
- County
- — inherits STATE
- City
- — inherits STATE
ZIP-level market 96002
- Rents YoY
- 1.9%
- Active inventory
- 286
- Price-to-rent
- 3.3×
Monthly cashflow live
- Estimated rent
- $1,715 medium interval (Pro) →
- Mortgage (P&I)
- −$351
- Tax est. 1.5%
- −$84 /mo · $1,005/yr
- Insurance
- −$28
- HOA
- −$0
- Vacancy / Maint / Mgmt
- −$360
- Net cashflow
- $892
Break-even live
UW: 25.0% down · 7.5% · 30yr · 1.5% tax · 5.0% vac · 8.0% maint · 8.0% mgmt
Financing live
Cash to close
- Down payment
- $16,750
- Closing costs
- $2,010
- Reserves months
- —
- Total cash needed
- —
Loan-product check · same deal, 3 products live
Conventional
25% down · 7.5% · 30yr
- Down + closing
- —
- Monthly P&I
- —
- Monthly cashflow
- —
- DSCR
- —
- Eligible?
- —
Personal DTI + credit; lowest rate.
DSCR
20% down · 8.5% · 30yr
- Down + closing
- —
- Monthly P&I
- —
- Monthly cashflow
- —
- DSCR
- —
- Eligible?
- —
No personal income docs; deal must DSCR.
Hard money
10% down · 12.0% · 12mo
- Down + closing
- —
- Monthly P&I
- —
- Monthly cashflow
- —
- DSCR
- —
- Eligible?
- —
Short-term bridge; refi at stabilization.
Listing history 21 events
-
2026-06-19days on market $67,000 Active 298 DOM
-
2026-06-18days on market $67,000 Active 297 DOM
-
2026-06-17days on market $67,000 Active 296 DOM
-
2026-06-16days on market $67,000 Active 295 DOM
-
2026-06-15days on market $67,000 Active 294 DOM
-
2026-06-14days on market $67,000 Active 292 DOM
-
2026-06-13days on market $67,000 Active 291 DOM
-
2026-06-10days on market $67,000 Active 289 DOM
-
2026-06-09days on market $67,000 Active 288 DOM
-
2026-06-08days on market $67,000 Active 287 DOM
-
2026-06-07days on market $67,000 Active 286 DOM
-
2026-06-05days on market $67,000 Active 283 DOM
-
2026-06-03days on market $67,000 Active 282 DOM
-
2026-06-02days on market $67,000 Active 281 DOM
-
2026-06-01days on market $67,000 Active 280 DOM
-
2026-05-31days on market $67,000 Active 279 DOM
-
2026-05-30statusdays on market $67,000 Active 278 DOM
-
2026-05-12status Pending
-
2025-12-15status Active
-
2025-12-15price $67,000
-
2025-08-06$90,000 Active
ⓘ Source: listings_history table (triggers on properties + properties_extension) + one-shot
backfill from property_details.listing_events for pre-trigger history.
Climate risk First Street
- Flood 1/10 Low FEMA zone X (unshaded) · 0% chance over 30 yrs
- Wildfire 8/10 Severe
- Heat 8/10 Severe 5 d/yr ≥105°F today · 12 d/yr by 30 yrs out
- Wind 1/10 Low
- Air quality 10/10 Extreme 35 unhealthy d/yr today · 42 by 30 yrs out
Nearby sold comps map
Loading sold comps map…
Walkable amenities ~0.75 mi
Loading nearby amenities…
Taxation est. · year 1
- Rental income
- $20,583
- − Mortgage interest
- −$3,753
- − Property taxes
- −$1,005
- − Insurance
- −$335
- − Repairs & maintenance
- −$1,647
- − Management
- −$1,647
- − Depreciation
- −$1,949
- Taxable income
- $10,248
- Est. tax owed @ 24.0%
- −$2,460
- After-tax cash flow
- $8,245/yr
For passive investors: Depreciation is non-cash, so a rental often shows a tax loss while cash-flowing — sheltering income. Rental losses are passive: they offset passive income freely, and up to $25,000/yr can offset ordinary (W-2) income if you actively participate and your MAGI is under $100k (phasing out to $0 by $150k); unused losses carry forward. On sale, claimed depreciation is recaptured at up to 25%, and gains may owe capital-gains tax (a 1031 exchange can defer both). Figures are a year-1 estimate at your 24.0% rate — not tax advice; consult a CPA.
Schools (NCES district)
- District
- Pacheco Union Elementary
- NCES district ID
- 0629280
- Math proficiency
- 30% ▼ -7.00%
- Reading proficiency
- 40% ▼ -1.00%
- Median HH income
- $59,905
- Composite
- 31.26/100
- National rank
- #6025
- State rank
- #264 of 517 in CA
Livability — Redding
- Score
- 76/100
- State rank
- #106
- US rank
- #3726
Category grades
Schools grade is shown separately in the Schools card above.
Census & demographics
- Census place
- Redding, CA
- County
- Shasta County · 147,641 people
- City population
- 112,523
- Metro
- Redding, CA
- Population (ZIP)
- 33,783
- Household income
- $73,222
- Rent vs Own
- Severe rent burden
- 1026.0
Population outlook (Shasta County) Hauer SSP2
- Today (2025)
- 179,231 people
- By 2030
- 176,953 · -1.3%
- By 2040
- 169,982 · -5.2%
- By 2050
- 162,547 · -9.3%
- By 2075
- 145,649 · -18.7%
- By 2100
- 123,025 · -31.4%
Race, ethnicity, and origin ACS 2023
- Neighborhood character
- Predominantly White (72%)
- Race & ethnicity
- White 72% Hispanic / Latino 13% Two or more races 12% Asian 6% Native American 2% Black 1%
- Hispanic origin (detail)
- Mexican 10%
- Common ancestry
- Italian 4% Lithuanian 2% Slovak 2%
- Foreign-born
- 5% · Canada
- Languages at home
- 91% English-only · Spanish 4% Other Asian/Pacific 2% Other Indo-European 1%
Political lean MEDSL · Shasta
- 2024 margin
- Solid R (+36.5) · D 30.5% · R 67.0% · Other 2.5%
- 2008→2024 swing
- -10.7pp toward R · 2008: -25.8pp · 2024: -36.5pp
- All cycles
- 2024: R+36.5 2020: R+33.1 2016: R+37.4 2012: R+30.3 2008: R+25.8
Not yet ingested
- Civics
- —
Market trends
- HPI YoY
- ▼ -248.70%
- Current HPI
- 319.713
- Rent YoY
- ▲ 1.88%
- Metro
- Redding, CA
- State GDP YoY
- ▲ 3.21%
- F500 in state
- 116
Industry mix (Fortune 500 HQ in CA)
| Industry | F500 HQs | Revenue |
|---|---|---|
| Technology | 27 | $1,492B |
|
||
| Financial Services | 3 | $174B |
|
||
| Retail | 3 | $44B |
|
||
| Insurance | 3 | $26B |
|
||
| Media / Entertainment | 2 | $115B |
|
||
| Pharmaceuticals / Biotech | 2 | $62B |
|
||
Price history
-25.6% since first listed4 events — show timeline
- 2026-05-12 Pending — SAOR
- 2025-12-15 Relisted — SAOR
- 2025-12-15 Price Changed $67,000 SAOR
- 2025-08-06 Listed $90,000 SAOR
Cash-flow waterfall
monthlySold comps — $/sqft
last 12 mo · ≤1 miLoading sold comps…