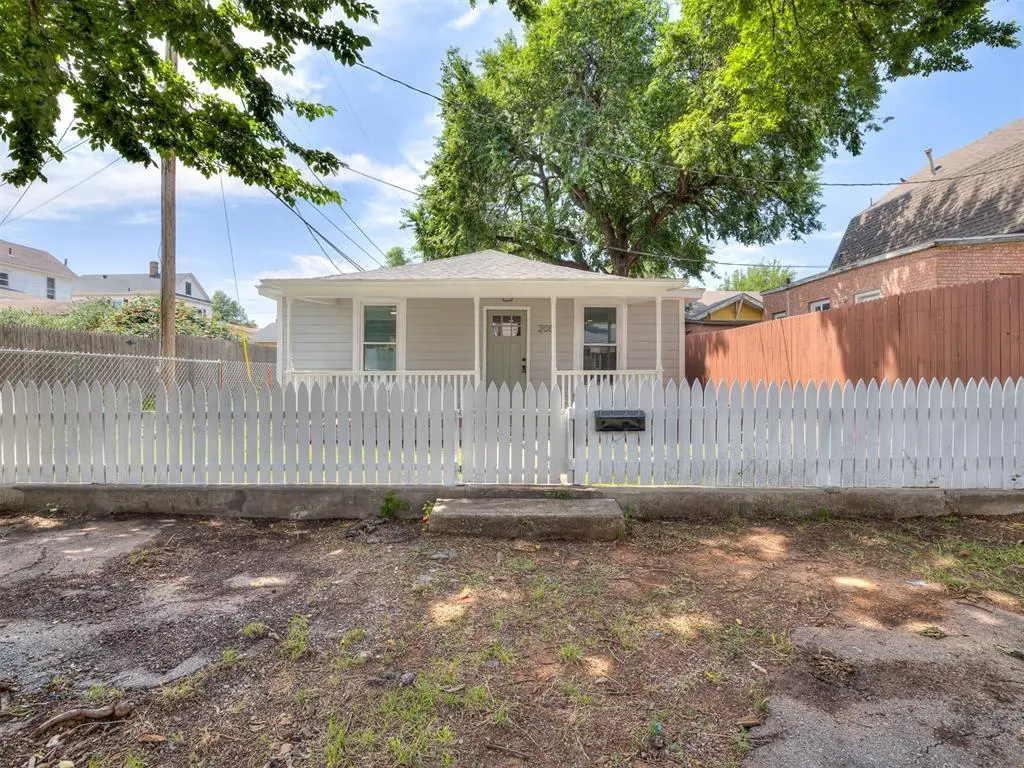
208 E Carson St · El Reno, OK
Flood risk 1/10 · Minimal
- FEMA flood zone
- X (unshaded)
- Chance of flooding over 30 yrs
- 0.0%
- Est. flood insurance / yr
- $507 – $1,088
Fire risk 1/10 · Minimal
- Est. fire insurance / yr
- $2,463 – $4,575
Heat risk 5/10 · Moderate
- Hot days now (above 107°F)
- 7 days/yr
- Hot days in 30 yrs
- 19 days/yr
Wind risk 2/10 · Minimal
- Chance of severe wind over 30 yrs
- 2.0%
Air-quality risk 2/10 · Minimal
- Unhealthy air days now
- 1 days/yr
- Unhealthy air days in 30 yrs
- 2 days/yr
Risk factors via First Street. Map © Google.
Why this score? — see what drove the D grade
The composite is a weighted blend of 9 inputs, each scored 0–100. Each bar is that input's sub-score; the figure is the points it added to the 100-point composite (weight × sub-score).
- Cash flow +16.4/30.0
- ARV discount +6.3/15.0
- DSCR +5.1/10.0
- 1% rule +3.5/10.0
- Rent growth +3.5/5.0
- Livability +3.4/5.0
- Condition / age +2.5/5.0
- Schools +1.2/10.0
- Appreciation +0.0/10.0
$125,000
🖨 Deal sheet (PDF) 📄 Offer letter ✓ Due diligence
Listing remarks MLS
Say hello to this beautiful, newly remodeled bungalow! Though you will find yourself greeted by a brand new white picket fence, invited in by a covered patio style porch, welcomed by double paned windows, the real hospitality occurs when stepping inside the home! Upon entrance you will find newly installed flooring throughout hugged by freshly painted walls and new base boards. Kitchen amenities include refurbished cabinets and new back splash. With a 1 yr old roof and low maintenance yard, this home is the perfect candidate for easy living! Schedule a showing today to view the extent of the remodel!
Key facts
- New lvp flooring
- Fresh carpet
- Bold accent walls
Tags
Property features AI
Finance
- Other: Assessor-reported living area; Vacant and available; Located in El Reno original town addition
- Financial info: Accepts Cash, Conventional, FHA or VA financing; Loan qualification possible
- HOA & community: No mandatory association dues
Exterior
- Parking: Asphalt parking
- Utilities: Public water/sewer (not flood-insured)
- Home design: Single family residence; One-story; Existing property
- Construction: Frame construction; Composition roof (replaced/updated 2019); Conventional foundation; Roof year 2019
- Exterior features: Covered patio; Covered porch; Interior lot
Interior
- Kitchen: Dishwasher; Microwave; Warming drawer
- Bedrooms: 2 bedrooms (one-level property)
- Bathrooms: 1 full bathroom
- Interior features: Ceiling fans; Electric fireplace
- Laundry & utility: Water heater
Neighborhood map
What this means for you Summary
Snapshot
- This is a 2-bed/1.0-bath single-family listed at $125k.
Deal economics
- At list price, monthly cash flow is $70 ($839/yr) — positive.
- The deal already cash-flows at list — no discount required.
- To meet the 1% rule (rent ≥ 1% of price), the offer needs to be $106k (15.0% below list).
- Recommended offer: $106k (15.0% below list) — sets the bar for 1% rule.
- Cap rate 7.0% vs local median 4.8% in El Reno — top-decile yield for the area; either an underpriced asset or a hidden risk that comps aren't pricing in. Stress-test before assuming the spread holds.
Location & tenants
- Location reads 67/100 on livability (#95 in OK) — a middle-class / working-renter tenant base. Strengths: cost of living A+, housing A+, crime B+; Watch: health & safety C-, amenities F, commute F.
- El Reno (town): math 12% / reading 15% proficiency, ranked #232 of 270 in OK (top 86%) — low school quality limits family demand, transient renter base, plan for 1-2y turnover; 68% free/reduced lunch — lower-income household profile, screen leases tightly.
- Zoned schools: Rose Witcher Es (387 students, 0% FRL); Etta Dale Jhs (math 7% / reading 13%, grade F, #277 of 345 statewide, top 83%, 444 students, 0% FRL); El Reno Hs (math 16% / reading 19%, grade F, #307 of 447 statewide, top 69%, 980 students, 0% FRL) — zoned schools average 0% FRL vs 68% district-wide (68 pts lower); this property's tenant base skews higher-income than the district average.
- Market conditions: Rents rising fast (+4.2%/yr); 281 active listings in the ZIP; 5 comparable units currently listed for rent nearby; rentals at typical pace (median 17d on market — plan ~3-4 weeks tenant-placement turnaround); 260 units permitted in Canadian County in 2024 (0 in 5+ unit buildings).
Forward outlook
- Local home prices are declining (-3.0%/yr); year-one equity from $864 of loan paydown is wiped out by about $4k of value loss. Plan a longer hold.
- Canadian County population projected at +64% by 2050 — long-run rental-demand tailwind backs the buy-and-hold thesis.
Negotiation context
- It's been on market 20 days — a 2% lower offer ($123k) is reasonable based on typical stale-listing flexibility.
- 5 sale attempts since 6y ago with the ask held roughly flat each time — persistent listings suggest the price (not the market) is what's stuck; bring a comps-based counter.
- Current owner paid $62k; list at $125k implies a 100% gain — meaningful room to come down on a strong offer.
Risks & watch-outs
- Watch-outs: built in 1920 — expect roof / HVAC / electrical / plumbing capex.
- Climate carrying-cost: extreme-heat days projected 7→19/yr by 2055 (HVAC capex compounding) — expect insurance premiums to compound above CPI over the hold.
Questions for the listing agent
- Built in 1920 — when were the roof, HVAC, electrical panel, plumbing, and water heater last replaced?
- Is there a deadline driving the sale (1031 exchange, divorce, estate, relocation)? That informs how much negotiation room exists.
- Schools are F-rated, which usually means shorter tenancies and higher turnover. Who's the typical renter profile here, and what's been the actual vacancy rate?
- The area grade is low — what's the realistic commute time and amenity access for the typical tenant pool here? Any planned neighborhood developments (good or bad) we should know about?
- What's the average days-on-market for RENTAL listings here right now (not sales)? A rising rental-DOM trend means longer vacancies and softer asking-rent achievability than the comps imply.
- What's the recent tenant-quality profile in this submarket — average credit score on applications, eviction rate, late-payment / NSF rate, and stable-employment percentage? A property-management company in the area should have these aggregated.
- How much new for-sale + rental construction is in the pipeline within 1–3 miles? Heavy new supply typically softens prices + rents 12–24 months out; constrained supply supports both.
Investment metrics
- 1% rule
- 0.85% ✗
- Cap rate
- 6.96%
- Cash-on-cash
- 2.40%
- DSCR
- 1.11
- GRM
- 9.8
CMA / ARV
- ARV (on-the-fly)
- $121,878
- Comps found
- 12
Show comp detail 12 sales within ~0.75 mi
| Address | Dist | Beds/Ba | Sqft | Sold | Price | $/sf | Match |
|---|---|---|---|---|---|---|---|
| 818 E Watts St | 0.44mi | 2/1.0 | 1,024 (+2%) | 1mo | $125,000 | $122 | 74 |
| 314 S Roberts Ave | 0.39mi | 3/1.0 (+1) | 1,028 (+3%) | 2mo | $141,000 | $137 | 70 |
| 324 Hal Dr | 0.55mi | 2/1.0 | 1,000 (+0%) | 6mo | $118,000 | $118 | 69 |
| 1008 E Woodson St | 0.65mi | 3/1.0 (+1) | 999 (0%) | 1mo | $75,500 | $76 | 64 |
| 717 S Miles Ave | 0.37mi | 2/1.0 | 912 (-9%) | 8mo | $114,900 | $126 | 62 |
| 605 S Reno Ave | 0.58mi | 2/1.0 | 1,093 (+9%) | 1mo | $149,900 | $137 | 56 |
| 1012 S Ellison Ave | 0.58mi | 2/1.0 | 1,090 (+9%) | 2mo | $114,000 | $105 | 56 |
| 104 W Foreman St | 0.72mi | 3/1.0 (+1) | 1,032 (+3%) | 2mo | $45,000 | $44 | 54 |
| 208 N Foster Ave | 0.70mi | 2/1.0 | 873 (-13%) | 2mo | $79,000 | $90 | 44 |
| 420 N Barker Ave | 0.69mi | 3/1.0 (+1) | 860 (-14%) | 5mo | $79,000 | $92 | 36 |
| 312 N Miles Ave | 0.72mi | 2/2.0 | 865 (-13%) | 6mo | $155,000 | $179 | 35 |
| 320 N Miles Ave | 0.73mi | 2/2.0 | 865 (-13%) | 7mo | $155,000 | $179 | 33 |
Match score weights: distance 35% · size 25% · config 20% · recency 20%. Top-matched comps best support the ARV.
Projected returns pro-forma
-3.0% appreciation · 4.19% rent growth · sell at horizon
- IRR
- -11.3%
- Equity multiple
- 0.58×
- Total profit
- $-14,555
- Equity at exit
- $18,638
- IRR
- -0.7%
- Equity multiple
- 0.95×
- Total profit
- $-1,694
- Equity at exit
- $10,808
Cash invested: $35,000 (down + closing). Projections, not guarantees.
Landlord ↔ Tenant lean methodology
- Overall (STATE)
- 83 Strongly Landlord-Friendly
- State Oklahoma
- 83 Strongly Landlord-Friendly · R+20
- County
- — inherits STATE
- City
- — inherits STATE
ZIP-level market 73036
- Home prices YoY
- -3.3%
- Rents YoY
- 4.2%
- Active inventory
- 281
- Price-to-rent
- 9.8×
Monthly cashflow live
- Estimated rent
- $1,063 high interval (Pro) →
- Mortgage (P&I)
- −$656
- Tax from tax record
- −$62 /mo · $745/yr
- Insurance
- −$52
- HOA
- −$0
- Vacancy / Maint / Mgmt
- −$223
- Net cashflow
- $70
Break-even live
Sensitivity live
| Price | -10% $141 | -5% $105 | +0% $70 | +5% $35 | +10% $-1 |
|---|---|---|---|---|---|
| Rent | -10% $-14 | -5% $28 | +0% $70 | +5% $112 | +10% $154 |
| Rate | -1.0pp $133 | -0.5pp $102 | base $70 | +0.5pp $38 | +1.0pp $5 |
UW: 25.0% down · 7.5% · 30yr · 1.5% tax · 5.0% vac · 8.0% maint · 8.0% mgmt
Financing live
Cash to close
- Down payment
- $31,250
- Closing costs
- $3,750
- Reserves months
- —
- Total cash needed
- —
Loan-product check · same deal, 3 products live
Conventional
25% down · 7.5% · 30yr
- Down + closing
- —
- Monthly P&I
- —
- Monthly cashflow
- —
- DSCR
- —
- Eligible?
- —
Personal DTI + credit; lowest rate.
DSCR
20% down · 8.5% · 30yr
- Down + closing
- —
- Monthly P&I
- —
- Monthly cashflow
- —
- DSCR
- —
- Eligible?
- —
No personal income docs; deal must DSCR.
Hard money
10% down · 12.0% · 12mo
- Down + closing
- —
- Monthly P&I
- —
- Monthly cashflow
- —
- DSCR
- —
- Eligible?
- —
Short-term bridge; refi at stabilization.
Rent comps 5 comps
| Address | Beds | Baths | Sqft | Rent | $/sqft | DOM | Units | Dist |
|---|---|---|---|---|---|---|---|---|
| 607 N Evans Ave El Reno, OK | 2.0 | 1.0 | 1032 | $1,025 | $0.99 | 3d | 1 | 0.80mi |
| 1100 W Wade St Unit 218 El Reno, OK | 1.0 | 1.0 | 800 | $800 | $1.00 | 16d | 1 | 0.81mi |
| 1020 W Hayes St El Reno, OK | 2.0 | 2.0 | 865 | $1,250 | $1.45 | 3d | 1 | 0.84mi |
| 1518 W London St Apt 3 El Reno, OK | 2.0 | 1.0 | 750 | $795 | $1.06 | 25d | 1 | 1.15mi |
| 2001 S Country Club Rd El Reno, OK | 2.0 | 1.0 | 768 | $850 | $1.11 | 23d | 1 | 1.34mi |
Listing history 14 events
-
2026-06-21pricedays on market $125,000 Active 20 DOM
-
2026-06-18days on market $129,900 Active 17 DOM
-
2026-06-17days on market $129,900 Active 16 DOM
-
2026-06-16days on market $129,900 Active 15 DOM
-
2026-06-15days on market $129,900 Active 14 DOM
-
2026-06-13days on market $129,900 Active 12 DOM
-
2026-06-13days on market $129,900 Active 11 DOM
-
2026-06-09days on market $129,900 Active 8 DOM
-
2026-06-08days on market $129,900 Active 7 DOM
-
2026-06-07days on market $129,900 Active 6 DOM
-
2026-06-05days on market $129,900 Active 3 DOM
-
2026-06-03days on market $129,900 Active 2 DOM
-
2026-06-02remarks 683-char remark
-
2026-06-02$129,900 Active 1 DOM
ⓘ Source: listings_history table (triggers on properties + properties_extension) + one-shot
backfill from property_details.listing_events for pre-trigger history.
Tax reassessment forecast OK · Resets to sale price
- Current annual tax
- $745 · $62/mo
- Projected year-2 tax
- $1,125 · $94/mo
- Expected delta
- +$380/yr (+$32/mo · 51.0%)
ⓘ Screening estimate from a state-policy table — verify with the county assessor before closing.
Climate risk First Street
- Flood 1/10 Low FEMA zone X (unshaded) · 0% chance over 30 yrs
- Wildfire 1/10 Low
- Heat 5/10 Major 7 d/yr ≥107°F today · 19 d/yr by 30 yrs out
- Wind 2/10 Low 2% chance of damaging wind over 30 yrs
- Air quality 2/10 Low 1 unhealthy d/yr today · 2 by 30 yrs out
Nearby sold comps map
Loading sold comps map…
Walkable amenities ~0.75 mi
Loading nearby amenities…
Taxation est. · year 1
- Rental income
- $12,754
- − Mortgage interest
- −$7,002
- − Property taxes
- −$745
- − Insurance
- −$625
- − Repairs & maintenance
- −$1,020
- − Management
- −$1,020
- − Depreciation
- −$3,636
- Taxable loss
- −$1,295
- Est. tax savings @ 24.0%
- +$311
- After-tax cash flow
- $1,150/yr
For passive investors: Depreciation is non-cash, so a rental often shows a tax loss while cash-flowing — sheltering income. Rental losses are passive: they offset passive income freely, and up to $25,000/yr can offset ordinary (W-2) income if you actively participate and your MAGI is under $100k (phasing out to $0 by $150k); unused losses carry forward. On sale, claimed depreciation is recaptured at up to 25%, and gains may owe capital-gains tax (a 1031 exchange can defer both). Figures are a year-1 estimate at your 24.0% rate — not tax advice; consult a CPA.
Schools (NCES district)
- District
- El Reno
- NCES district ID
- 4010650
- Math proficiency
- 12% ▼ -15.00%
- Reading proficiency
- 15% ▼ -9.00%
- Median HH income
- $44,689
- Composite
- 12.01/100
- National rank
- #9664
- State rank
- #232 of 270 in OK
Livability — El Reno
- Score
- 67/100
- State rank
- #95
- US rank
- #10933
Category grades
Schools grade is shown separately in the Schools card above.
Census & demographics
- Census place
- El Reno, OK
- County
- Canadian County · 154,341 people
- City population
- 21,387
- Metro
- Oklahoma City, OK
- Population (ZIP)
- 21,387
- Household income
- $59,915
- Rent vs Own
- Severe rent burden
- 580.0
Population outlook (Canadian County) Hauer SSP2
- Today (2025)
- 174,062 people
- By 2030
- 195,170 · +12.1%
- By 2040
- 239,293 · +37.5%
- By 2050
- 285,457 · +64.0%
- By 2075
- 403,766 · +132.0%
- By 2100
- 498,766 · +186.5%
Race, ethnicity, and origin ACS 2023
- Neighborhood character
- Predominantly White (65%)
- Race & ethnicity
- White 65% Hispanic / Latino 17% Two or more races 8% Native American 8% Black 6%
- Hispanic origin (detail)
- Mexican 14%
- Common ancestry
- Slovak 2% Serbian 2% Romanian 1%
- Foreign-born
- 5% · Canada
- Languages at home
- 89% English-only · Spanish 10%
Political lean MEDSL · Canadian
- 2024 margin
- Solid R (+40.4) · D 28.8% · R 69.2% · Other 2.0%
- 2008→2024 swing
- +11.9pp toward D · 2008: -52.2pp · 2024: -40.4pp
- All cycles
- 2024: R+40.4 2020: R+43.3 2016: R+51.2 2012: R+54.4 2008: R+52.2
Not yet ingested
- Civics
- —
Market trends
- HPI YoY
- ▼ -11.37%
- Current HPI
- 334.5896
- Rent YoY
- ▲ 4.19%
- Metro
- Oklahoma City, OK
- State GDP YoY
- ▲ 1.55%
- F500 in state
- 6
Industry mix (Fortune 500 HQ in OK)
| Industry | F500 HQs | Revenue |
|---|---|---|
| Energy | 3 | $48B |
|
||
Price history
+1080.9% since first listed14 events — show timeline
- 2026-05-30 Listed $129,900 MLSOK
- 2022-08-26 Listing Removed — MLSOK
- 2022-08-17 Price Changed $107,500 MLSOK
- 2022-08-16 Relisted — MLSOK
- 2022-08-10 Pending — MLSOK
- 2022-08-08 Price Changed $110,000 MLSOK
- 2022-07-11 Listed $115,000 MLSOK
- 2021-04-12 Sold (MLS) $62,500 MLSOK
- 2021-04-01 Pending — MLSOK
- 2021-03-16 Price Changed $74,000 MLSOK
- 2021-03-07 Relisted — MLSOK
- 2021-02-10 Pending — MLSOK
- 2020-11-08 Listed $76,900 MLSOK
- 1998-01-06 Sold (Public Records) $11,000 Public Records
Property tax history
+4.6%/yrLatest (2025): $745 · +6.1% YoY. Source: county tax records.
Cash-flow waterfall
monthlySold comps — $/sqft
last 12 mo · ≤1 miLoading sold comps…