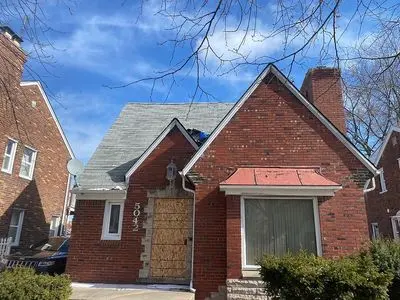
5042 Philip St · Detroit, MI
Flood risk 1/10 · Minimal
- FEMA flood zone
- X (unshaded)
- Chance of flooding over 30 yrs
- 0.0%
- Est. flood insurance / yr
- $473 – $860
Fire risk 1/10 · Minimal
- Est. fire insurance / yr
- $784 – $1,456
Heat risk 3/10 · Minor
- Hot days now (above 96°F)
- 7 days/yr
- Hot days in 30 yrs
- 15 days/yr
Wind risk 2/10 · Minimal
- Chance of severe wind over 30 yrs
- —
Air-quality risk 3/10 · Minor
- Unhealthy air days now
- 2 days/yr
- Unhealthy air days in 30 yrs
- 5 days/yr
Risk factors via First Street. Map © Google.
Why this score? — see what drove the D grade
The composite is a weighted blend of 9 inputs, each scored 0–100. Each bar is that input's sub-score; the figure is the points it added to the 100-point composite (weight × sub-score).
- Cash flow +15.0/30.0
- ARV discount +7.5/15.0
- 1% rule +5.0/10.0
- DSCR +5.0/10.0
- Livability +3.7/5.0
- Rent growth +2.7/5.0
- Condition / age +2.5/5.0
- Schools +1.3/10.0
- Appreciation +0.0/10.0
$30,000
🖨 Deal sheet 📄 Offer letter ✓ Due diligence
Listing remarks
This 1,600 sq ft bungalow offers strong potential with 3 bedrooms, 1.5 bathrooms, a finished basement, and a solid brick garage. The property recently experienced an electrical fire that was contained to the upper level, with additional minor damage resulting from suppression efforts, both of which are considered readily repairable. With the home already near livable condition, this presents an excellent opportunity for investors or buyers looking to add value with minimal rehab. Once restored, the property has an estimated after-repair value (ARV) of $130,000, making it a promising investment. For more information or to express interest, please call or text Josie at 313-673-3884.
Key facts
- Built 1936
Property features AI
Exterior
- Home design: Built in 1936
- Construction: Year built: 1936
- Exterior features: Located in the Chandler Park–Chalmers subdivision
Neighborhood map
What this means for you Summary
Snapshot
- This is a 3-bed/1.5-bath single-family listed at $30k.
Deal economics
- At list price, monthly cash flow is $887 ($11k/yr) — positive.
- The deal already cash-flows at list — no discount required.
- Meets the 1% rule at list price ($1k rent vs $30k).
- Cap rate 41.8% vs local median 10.2% in Detroit — top-decile yield for the area; either an underpriced asset or a hidden risk that comps aren't pricing in. Stress-test before assuming the spread holds.
Location & tenants
- Location reads 73/100 on livability (#218 in MI) — a middle-class / working-renter tenant base. Strengths: amenities A+, commute A+, cost of living A+; Watch: schools F, crime F, employment F.
- Detroit Public Schools Community District (urban): math 10% / reading 24% proficiency, ranked #499 of 540 in MI (top 92%) — low school quality limits family demand, transient renter base, plan for 1-2y turnover; 90% free/reduced lunch — lower-income household profile, screen leases tightly.
- Market conditions: Rents flat; 484 active listings in the ZIP; 30 comparable units currently listed for rent nearby; rentals at typical pace (median 20d on market — plan ~3-4 weeks tenant-placement turnaround); lower-income renter base — watch delinquency; 2,639 units permitted in Wayne County in 2024 (1,216 in 5+ unit buildings).
- This rent runs 38% of the median local income ($45k/yr) — at the standard rent-burdened threshold; future hikes will face affordability resistance.
Forward outlook
- Local home prices are declining (-3.0%/yr); year-one equity from $207 of loan paydown is wiped out by about $900 of value loss. Plan a longer hold.
- Wayne County population projected at -17% by 2050 — secular population decline; favor cash flow + early exit over multi-decade hold.
- At projected returns (-3.0% appreciation + 0.7% rent growth), your $8k cash investment doubles in ~1 year — after that, you're playing with house money.
Negotiation context
- Only 1 days on market — expect competitive offers; lowballing is unlikely to land.
Risks & watch-outs
- Watch-outs: property tax is 2.6% of price; built in 1936 — expect roof / HVAC / electrical / plumbing capex.
Questions for the listing agent
- Built in 1936 — when were the roof, HVAC, electrical panel, plumbing, and water heater last replaced?
- Property tax is high relative to price — has the assessment been appealed recently, and will the sale trigger a re-assessment?
- Is there a deadline driving the sale (1031 exchange, divorce, estate, relocation)? That informs how much negotiation room exists.
- Schools are F-rated, which usually means shorter tenancies and higher turnover. Who's the typical renter profile here, and what's been the actual vacancy rate?
- Crime grade is F in this area — have there been break-ins, vandalism, or insurance claims at this property in the last 3 years? What carrier currently insures it and at what premium?
- The area grade is low — what's the realistic commute time and amenity access for the typical tenant pool here? Any planned neighborhood developments (good or bad) we should know about?
- What's the average days-on-market for RENTAL listings here right now (not sales)? A rising rental-DOM trend means longer vacancies and softer asking-rent achievability than the comps imply.
- What's the recent tenant-quality profile in this submarket — average credit score on applications, eviction rate, late-payment / NSF rate, and stable-employment percentage? A property-management company in the area should have these aggregated.
- How much new for-sale + rental construction is in the pipeline within 1–3 miles? Heavy new supply typically softens prices + rents 12–24 months out; constrained supply supports both.
Investment metrics
- 1% rule
- 4.73% ✓
- Cap rate
- 41.79%
- Cash-on-cash
- 126.78%
- DSCR
- 6.64
- GRM
- 1.8
CMA / ARV
- ARV (on-the-fly)
- $129,120
- Comps found
- 12
Show comp detail 12 sales within ~0.75 mi
| Address | Dist | Beds/Ba | Sqft | Sold | Price | $/sf | Match |
|---|---|---|---|---|---|---|---|
| 5311 Philip St | 0.19mi | 2/1.0 (-1) | 1,648 (+2%) | 4mo | $75,000 | $46 | 77 |
| 10825 E Outer Dr | 0.43mi | 3/2.0 | 1,650 (+2%) | 10mo | $175,000 | $106 | 66 |
| 4830 Dickerson St | 0.59mi | 3/1.5 | 1,542 (-4%) | 2mo | $60,099 | $39 | 64 |
| 5790 Lakepointe St | 0.53mi | 3/1.5 | 1,565 (-3%) | 11mo | $162,500 | $104 | 61 |
| 5721 Somerset Ave | 0.61mi | 3/1.5 | 1,513 (-6%) | 3mo | $152,000 | $100 | 58 |
| 4395 Maryland St | 0.40mi | 3/1.5 | 1,840 (+14%) | 1mo | $169,000 | $92 | 57 |
| 5566 Somerset Ave | 0.59mi | 3/2.5 | 1,521 (-6%) | 3mo | $87,000 | $57 | 57 |
| 5035 Balfour Rd | 0.56mi | 3/1.0 | 1,734 (+7%) | 9mo | $46,500 | $27 | 52 |
| 4331 Balfour Rd | 0.68mi | 3/2.0 | 1,793 (+11%) | 1mo | $160,000 | $89 | 47 |
| 5794 Dickerson St | 0.72mi | 3/1.0 | 1,467 (-9%) | 4mo | $118,000 | $80 | 46 |
| 4810 Chatsworth St | 0.66mi | 4/2.0 (+1) | 1,704 (+6%) | 8mo | $130,000 | $76 | 46 |
| 5535 Balfour Rd | 0.61mi | 4/2.0 (+1) | 1,772 (+10%) | 7mo | $30,000 | $17 | 42 |
Match score weights: distance 35% · size 25% · config 20% · recency 20%. Top-matched comps best support the ARV.
Projected returns pro-forma
-3.0% appreciation · 0.73% rent growth · sell at horizon
- IRR
- —
- Equity multiple
- 6.78×
- Total profit
- $48,530
- Equity at exit
- $4,473
- IRR
- —
- Equity multiple
- 13.23×
- Total profit
- $102,765
- Equity at exit
- $2,594
Cash invested: $8,400 (down + closing). Projections, not guarantees.
Landlord ↔ Tenant lean methodology
- Overall (STATE)
- 62 Landlord-Friendly
- State Michigan
- 62 Landlord-Friendly · EVEN
- County
- — inherits STATE
- City
- — inherits STATE
ZIP-level market 48224
- Rents YoY
- 0.7%
- Active inventory
- 484
- Price-to-rent
- 1.8×
Monthly cashflow live
- Estimated rent
- $1,420 high interval (Pro) →
- Mortgage (P&I)
- −$157
- Tax from tax record
- −$64 /mo · $770/yr
- Insurance
- −$12
- HOA
- −$0
- Vacancy / Maint / Mgmt
- −$298
- Net cashflow
- $887
Break-even live
UW: 25.0% down · 7.5% · 30yr · 1.5% tax · 5.0% vac · 8.0% maint · 8.0% mgmt
Financing live
Cash to close
- Down payment
- $7,500
- Closing costs
- $900
- Reserves months
- —
- Total cash needed
- —
Loan-product check · same deal, 3 products live
Conventional
25% down · 7.5% · 30yr
- Down + closing
- —
- Monthly P&I
- —
- Monthly cashflow
- —
- DSCR
- —
- Eligible?
- —
Personal DTI + credit; lowest rate.
DSCR
20% down · 8.5% · 30yr
- Down + closing
- —
- Monthly P&I
- —
- Monthly cashflow
- —
- DSCR
- —
- Eligible?
- —
No personal income docs; deal must DSCR.
Hard money
10% down · 12.0% · 12mo
- Down + closing
- —
- Monthly P&I
- —
- Monthly cashflow
- —
- DSCR
- —
- Eligible?
- —
Short-term bridge; refi at stabilization.
Rent comps 30 comps
| Address | Beds | Baths | Sqft | Rent | $/sqft | DOM | Units | Dist |
|---|---|---|---|---|---|---|---|---|
| 5747 Lakepointe St Detroit, MI | 3.0 | 1.5 | 1316 | $1,473 | $1.12 | 43d | 1 | 0.48mi |
| 4251 Wayburn St Detroit, MI | 3.0 | 1.5 | 1326 | $1,650 | $1.24 | 43d | 1 | 0.50mi |
| 5751 Nottingham Rd Unit 5/21/26 Detroit, MI | 3.0 | 1.0 | 1100 | $1,250 | $1.14 | 14d | 1 | 0.57mi |
| 5966 Eastlawn St Unit NA Detroit, MI | 3.0 | 1.5 | 1366 | $1,500 | $1.10 | 24d | 1 | 0.60mi |
| 5791 Somerset Ave Detroit, MI | 3.0 | 2.0 | 1660 | $1,400 | $0.84 | 17d | 1 | 0.64mi |
| 9168 Wayburn St Detroit, MI | 3.0 | 1.0 | 1274 | $1,300 | $1.02 | 20d | 1 | 0.78mi |
| 5267 Haverhill St Detroit, MI | 3.0 | 1.5 | 1458 | $1,300 | $0.89 | 17d | 1 | 0.78mi |
| 5267 Haverhill St Detroit, MI | 3.0 | 1.5 | 1458 | $1,300 | $0.89 | 16d | 1 | 0.78mi |
| 5574 Buckingham Ave Detroit, MI | 3.0 | 1.0 | 1430 | $1,450 | $1.01 | 4d | 1 | 0.79mi |
| 9400 Lakepointe St Detroit, MI | 3.0 | 1.0 | 1300 | $1,150 | $0.88 | 4d | 1 | 0.82mi |
| 9409 Balfour Rd Detroit, MI | 3.0 | 1.0 | 1195 | $1,200 | $1.00 | 43d | 1 | 0.86mi |
| 4627 Bedford St Unit 1 Detroit, MI | 2.0 | 1.0 | 1050 | $945 | $0.90 | 19d | 1 | 0.92mi |
| 15857 Evanston St Detroit, MI | 3.0 | 1.5 | 1232 | $1,250 | $1.01 | 4d | 1 | 0.94mi |
| 5050 Three Mile Dr Detroit, MI | 2.0 | 1.0 | 2127 | $1,150 | $0.54 | 43d | 1 | 0.96mi |
| 3625 Chatsworth St Detroit, MI | 3.0 | 1.5 | 1182 | $1,295 | $1.10 | 24d | 1 | 0.98mi |
| 9755 Wayburn St Detroit, MI | 3.0 | 2.0 | 1498 | $1,400 | $0.93 | 3d | 1 | 1.01mi |
| 3651 Buckingham Ave Detroit, MI | 3.0 | 1.0 | 1320 | $1,300 | $0.98 | 17d | 1 | 1.03mi |
| 9984 Beaconsfield St Detroit, MI | 3.0 | 1.0 | 1222 | $1,575 | $1.29 | 43d | 1 | 1.04mi |
| 10141 Roxbury St Detroit, MI | 3.0 | 1.0 | 1115 | $1,000 | $0.90 | 43d | 1 | 1.06mi |
| 1334 Maryland St Grosse Pointe Park, MI | 2.0 | 1.0 | 1786 | $1,200 | $0.67 | 17d | 1 | 1.15mi |
| 13137 Elmdale St Detroit, MI | 3.0 | 1.0 | 1115 | $1,400 | $1.26 | 24d | 1 | 1.17mi |
| 10724 Whitehill St Detroit, MI | 3.0 | 3.0 | 1425 | $1,550 | $1.09 | 17d | 1 | 1.27mi |
| 3626 Courville St Detroit, MI | 3.0 | 1.0 | 1260 | $1,300 | $1.03 | 43d | 1 | 1.28mi |
| 1312 Somerset Ave Grosse Pointe Park, MI | 2.0 | 1.0 | 1200 | $1,400 | $1.17 | 16d | 1 | 1.28mi |
| 10813 Whitehill St Detroit, MI | 3.0 | 1.0 | 1392 | $1,350 | $0.97 | 17d | 1 | 1.32mi |
| 1236 Beaconsfield Ave Unit 1 Grosse Pointe Park, MI | 2.0 | 1.0 | 1100 | $1,600 | $1.45 | 24d | 1 | 1.33mi |
| 9635 Everts St Detroit, MI | 4.0 | 2.0 | 1450 | $1,650 | $1.14 | 43d | 1 | 1.34mi |
| 11018 Whitehill St Detroit, MI | 3.0 | 1.0 | 1146 | $1,450 | $1.27 | 10d | 1 | 1.41mi |
| 10404 Somerset Ave Detroit, MI | 3.0 | 1.0 | 1108 | $1,475 | $1.33 | 3d | 1 | 1.44mi |
| 10803 Roxbury St Detroit, MI | 3.0 | 1.0 | 1150 | $900 | $0.78 | 20d | 1 | 1.49mi |
Listing history 1 events
-
2026-05-26$30,000 Active
ⓘ Source: listings_history table (triggers on properties + properties_extension) + one-shot
backfill from property_details.listing_events for pre-trigger history.
Tax reassessment forecast MI · Partial reset (capped growth)
- Current annual tax
- $770 · $64/mo
- Projected year-2 tax
- $770 · $64/mo
- Expected delta
- $0/yr ($0/mo · 0.0%)
ⓘ Screening estimate from a state-policy table — verify with the county assessor before closing.
Climate risk First Street
- Flood 1/10 Low FEMA zone X (unshaded) · 0% chance over 30 yrs
- Wildfire 1/10 Low
- Heat 3/10 Moderate 7 d/yr ≥96°F today · 15 d/yr by 30 yrs out
- Wind 2/10 Low
- Air quality 3/10 Moderate 2 unhealthy d/yr today · 5 by 30 yrs out
Nearby sold comps map
Loading sold comps map…
Walkable amenities ~0.75 mi
Loading nearby amenities…
Taxation est. · year 1
- Rental income
- $17,035
- − Mortgage interest
- −$1,680
- − Property taxes
- −$770
- − Insurance
- −$150
- − Repairs & maintenance
- −$1,363
- − Management
- −$1,363
- − Depreciation
- −$873
- Taxable income
- $10,836
- Est. tax owed @ 24.0%
- −$2,601
- After-tax cash flow
- $8,049/yr
For passive investors: Depreciation is non-cash, so a rental often shows a tax loss while cash-flowing — sheltering income. Rental losses are passive: they offset passive income freely, and up to $25,000/yr can offset ordinary (W-2) income if you actively participate and your MAGI is under $100k (phasing out to $0 by $150k); unused losses carry forward. On sale, claimed depreciation is recaptured at up to 25%, and gains may owe capital-gains tax (a 1031 exchange can defer both). Figures are a year-1 estimate at your 24.0% rate — not tax advice; consult a CPA.
Schools (NCES district)
- District
- Detroit Public Schools Community District
- NCES district ID
- 2601103
- Math proficiency
- 10% ▼ -2.00%
- Reading proficiency
- 24% ▲ 6.00%
- Median HH income
- $25,815
- Composite
- 13.06/100
- National rank
- #9564
- State rank
- #499 of 540 in MI
Livability — Detroit
- Score
- 73/100
- State rank
- #218
- US rank
- #5427
Category grades
Schools grade is shown separately in the Schools card above.
Census & demographics
- Census place
- Detroit, MI
- County
- Wayne County · 1,562,939 people
- City population
- 572,865
- Metro
- Detroit-Warren-Dearborn, MI
- Population (ZIP)
- 39,668
- Household income
- $44,856
- Rent vs Own
- Severe rent burden
- 2515.0
Population outlook (Wayne County) Hauer SSP2
- Today (2025)
- 1,675,273 people
- By 2030
- 1,620,300 · -3.3%
- By 2040
- 1,502,341 · -10.3%
- By 2050
- 1,384,039 · -17.4%
- By 2075
- 1,124,592 · -32.9%
- By 2100
- 881,193 · -47.4%
Race, ethnicity, and origin ACS 2023
- Neighborhood character
- Predominantly Black (88%)
- Race & ethnicity
- Black 88% White 8% Two or more races 3% Hispanic / Latino 1%
- Common ancestry
- Iranian 1% Romanian 1% Lithuanian 1%
- Foreign-born
- 1%
- Languages at home
- 97% English-only · Spanish 2%
Political lean MEDSL · Wayne
- 2024 margin
- Strong D (+29.0) · D 62.7% · R 33.7% · Other 3.6%
- 2008→2024 swing
- -20.5pp toward R · 2008: 49.5pp · 2024: 29.0pp
- All cycles
- 2024: D+29.0 2020: D+38.1 2016: D+37.3 2012: D+46.9 2008: D+49.5
Not yet ingested
- Civics
- —
Market trends
- HPI YoY
- ▼ -226.38%
- Current HPI
- 161.886
- Rent YoY
- ▲ 0.73%
- Metro
- Detroit-Warren-Dearborn, MI
- State GDP YoY
- ▲ 1.37%
- F500 in state
- 28
Industry mix (Fortune 500 HQ in MI)
| Industry | F500 HQs | Revenue |
|---|---|---|
| Automotive Parts | 3 | $48B |
|
||
| Automotive | 2 | $372B |
|
||
| Chemicals | 1 | $45B |
|
||
| Automotive Retail | 1 | $29B |
|
||
| Healthcare / Medical Devices | 1 | $23B |
|
||
| Automotive Technology | 1 | $20B |
|
||
Price history
1 event — show timeline
- 2026-05-26 Listed $30,000 FSBO.com
Property tax history
-7.6%/yrLatest (2025): $770 · -54.6% YoY. Source: county tax records.
Cash-flow waterfall
monthlySold comps — $/sqft
last 12 mo · ≤1 miLoading sold comps…