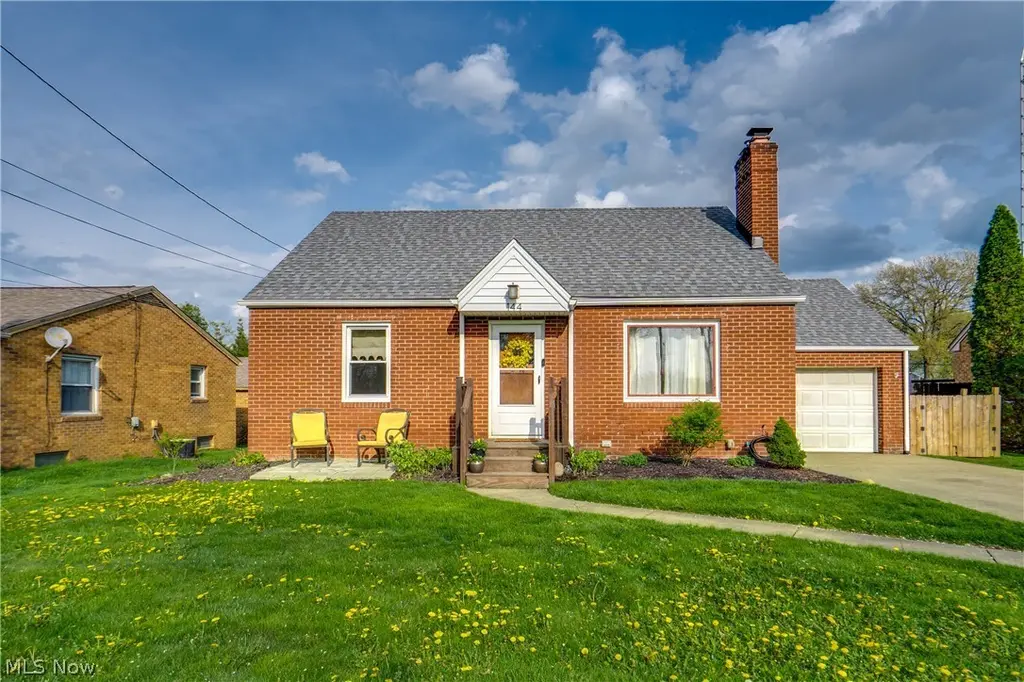
144 Perry Dr NW · Reedurban, OH
Flood risk 1/10 · Minimal
- FEMA flood zone
- X (unshaded)
- Chance of flooding over 30 yrs
- 0.0%
- Est. flood insurance / yr
- $473 – $860
Fire risk 1/10 · Minimal
- Est. fire insurance / yr
- $713 – $1,323
Heat risk 3/10 · Minor
- Hot days now (above 96°F)
- 7 days/yr
- Hot days in 30 yrs
- 17 days/yr
Wind risk 1/10 · Minimal
- Chance of severe wind over 30 yrs
- —
Air-quality risk 2/10 · Minimal
- Unhealthy air days now
- 0 days/yr
- Unhealthy air days in 30 yrs
- 1 days/yr
Risk factors via First Street. Map © Google.
Why this score? — see what drove the D grade
The composite is a weighted blend of 9 inputs, each scored 0–100. Each bar is that input's sub-score; the figure is the points it added to the 100-point composite (weight × sub-score).
- Cash flow +11.7/30.0
- ARV discount +7.5/15.0
- Schools +5.8/10.0
- Rent growth +4.2/5.0
- DSCR +3.4/10.0
- 1% rule +2.7/10.0
- Livability +2.5/5.0
- Condition / age +2.5/5.0
- Appreciation +0.0/10.0
$179,900
🖨 Deal sheet 📄 Offer letter ✓ Due diligence
Listing remarks MLS
Welcome to your new home at 144 Perry Dr NW in the Perry Local School District. This charming all brick bungalow has a huge backyard for summer parties and get togethers! Enter into the hardwood floors of the living room which features a stone surround on the gas fireplace! Kitchen is super quaint and has a glass cabinet to feature your cute things! The retro main bath is on the first floor along with two 1st floor bedrooms that also have new windows. Hardwood under carpet. The upstairs is currently used as a playroom but could also be so much more as there is a closet here as well. The lower level is partially finished, is waterproofed and has a lifetime warranty. The laundry area in the lower level has a shower and toilet along with the washer & dryer that are newer (washer has a 5 year warranty) and are staying with home. Updates: Supply lines and drain lines replaced 2019. New toilet in main level bath. Wi-Fi thermostat. Gas line replaced by dominion. There is a window a/c unit for
Key facts
- Cozy gas fireplace
- Walk-in closet
- Newer picture window
Tags
Neighborhood map
What this means for you Summary
Snapshot
- This is a 3-bed/1.5-bath single-family listed at $180k.
Deal economics
- At list price, monthly cash flow is $-52 ($-627/yr) — negative.
- To cash-flow at today's rent, offer at most $171k (5.1% below list).
- To meet the 1% rule (rent ≥ 1% of price), the offer needs to be $139k (22.8% below list).
- Recommended offer: $139k (22.8% below list) — sets the bar for 1% rule.
Location & tenants
- Location reads: area grade D — affects rentability + tenant quality, not the cash-flow math above.
- Perry Local (suburban): math 63% / reading 73% proficiency, ranked #173 of 656 in OH (top 26%) — acceptable for families but not a draw, mixed tenant base, ~2y average lease.
- Market conditions: Rents rising fast (+6.7%/yr); 119 active listings in the ZIP; 528 units permitted in Stark County in 2024 (84 in 5+ unit buildings).
Forward outlook
- Local home prices are declining (-3.0%/yr); year-one equity from $1k of loan paydown is wiped out by about $5k of value loss. Plan a longer hold.
- Stark County population projected to shrink 8% by 2050 — rents likely to lag national; underwrite the cash flow, not the appreciation.
Negotiation context
- Only 3 days on market — expect competitive offers; lowballing is unlikely to land.
- 3 sale attempts since 12y ago with the ask held roughly flat each time — persistent listings suggest the price (not the market) is what's stuck; bring a comps-based counter.
- Current owner paid $105k; list at $180k implies a 71% gain — meaningful room to come down on a strong offer.
Risks & watch-outs
- Watch-outs: built in 1950 — expect roof / HVAC / electrical / plumbing capex.
Questions for the listing agent
- What do current leases actually rent for vs. the listed asking? Can we see a recent rent roll and the last 12 months of T-12 income?
- Built in 1950 — when were the roof, HVAC, electrical panel, plumbing, and water heater last replaced?
- Is there a deadline driving the sale (1031 exchange, divorce, estate, relocation)? That informs how much negotiation room exists.
- The area grade is low — what's the realistic commute time and amenity access for the typical tenant pool here? Any planned neighborhood developments (good or bad) we should know about?
- What's the average days-on-market for RENTAL listings here right now (not sales)? A rising rental-DOM trend means longer vacancies and softer asking-rent achievability than the comps imply.
- What's the recent tenant-quality profile in this submarket — average credit score on applications, eviction rate, late-payment / NSF rate, and stable-employment percentage? A property-management company in the area should have these aggregated.
- How much new for-sale + rental construction is in the pipeline within 1–3 miles? Heavy new supply typically softens prices + rents 12–24 months out; constrained supply supports both.
Investment metrics
- 1% rule
- 0.77% ✗
- Cap rate
- 5.94%
- Cash-on-cash
- -1.25%
- DSCR
- 0.94
- GRM
- 10.8
CMA / ARV
No comps found within radius.
Projected returns pro-forma
-3.0% appreciation · 6.73% rent growth · sell at horizon
- IRR
- -14.6%
- Equity multiple
- 0.46×
- Total profit
- $-27,106
- Equity at exit
- $26,824
- IRR
- -1.0%
- Equity multiple
- 0.92×
- Total profit
- $-4,062
- Equity at exit
- $15,554
Cash invested: $50,372 (down + closing). Projections, not guarantees.
Landlord ↔ Tenant lean methodology
- Overall (STATE)
- 73 Landlord-Friendly
- State Ohio
- 73 Landlord-Friendly · R+6
- County
- — inherits STATE
- City
- — inherits STATE
ZIP-level market 44708
- Rents YoY
- 6.7%
- Active inventory
- 119
- Price-to-rent
- 10.8×
Monthly cashflow live
- Estimated rent
- $1,390 medium interval (Pro) →
- Mortgage (P&I)
- −$943
- Tax from tax record
- −$132 /mo · $1,580/yr
- Insurance
- −$75
- HOA
- −$0
- Vacancy / Maint / Mgmt
- −$292
- Net cashflow
- $-52
Break-even live
UW: 25.0% down · 7.5% · 30yr · 1.5% tax · 5.0% vac · 8.0% maint · 8.0% mgmt
Financing live
Cash to close
- Down payment
- $44,975
- Closing costs
- $5,397
- Reserves months
- —
- Total cash needed
- —
Loan-product check · same deal, 3 products live
Conventional
25% down · 7.5% · 30yr
- Down + closing
- —
- Monthly P&I
- —
- Monthly cashflow
- —
- DSCR
- —
- Eligible?
- —
Personal DTI + credit; lowest rate.
DSCR
20% down · 8.5% · 30yr
- Down + closing
- —
- Monthly P&I
- —
- Monthly cashflow
- —
- DSCR
- —
- Eligible?
- —
No personal income docs; deal must DSCR.
Hard money
10% down · 12.0% · 12mo
- Down + closing
- —
- Monthly P&I
- —
- Monthly cashflow
- —
- DSCR
- —
- Eligible?
- —
Short-term bridge; refi at stabilization.
Listing history 2 events
-
2026-06-08remarks 687-char remark
-
2026-06-08$179,900 Pending 3 DOM
ⓘ Source: listings_history table (triggers on properties + properties_extension) + one-shot
backfill from property_details.listing_events for pre-trigger history.
Tax reassessment forecast OH · Partial reset (capped growth)
- Current annual tax
- $1,580 · $132/mo
- Projected year-2 tax
- $2,193 · $183/mo
- Expected delta
- +$613/yr (+$51/mo · 38.8%)
ⓘ Screening estimate from a state-policy table — verify with the county assessor before closing.
Climate risk First Street
- Flood 1/10 Low FEMA zone X (unshaded) · 0% chance over 30 yrs
- Wildfire 1/10 Low
- Heat 3/10 Moderate 7 d/yr ≥96°F today · 17 d/yr by 30 yrs out
- Wind 1/10 Low
- Air quality 2/10 Low 0 unhealthy d/yr today · 1 by 30 yrs out
Nearby sold comps map
Loading sold comps map…
Walkable amenities ~0.75 mi
Loading nearby amenities…
Taxation est. · year 1
- Rental income
- $16,675
- − Mortgage interest
- −$10,077
- − Property taxes
- −$1,580
- − Insurance
- −$900
- − Repairs & maintenance
- −$1,334
- − Management
- −$1,334
- − Depreciation
- −$5,233
- Taxable loss
- −$3,783
- Est. tax savings @ 24.0%
- +$908
- After-tax cash flow
- $281/yr
For passive investors: Depreciation is non-cash, so a rental often shows a tax loss while cash-flowing — sheltering income. Rental losses are passive: they offset passive income freely, and up to $25,000/yr can offset ordinary (W-2) income if you actively participate and your MAGI is under $100k (phasing out to $0 by $150k); unused losses carry forward. On sale, claimed depreciation is recaptured at up to 25%, and gains may owe capital-gains tax (a 1031 exchange can defer both). Figures are a year-1 estimate at your 24.0% rate — not tax advice; consult a CPA.
Schools (NCES district)
- District
- Perry Local
- NCES district ID
- 3904992
- Math proficiency
- 63% ▼ -10.00%
- Reading proficiency
- 73% ▼ -4.00%
- Median HH income
- $51,700
- Composite
- 57.83/100
- National rank
- #1048
- State rank
- #173 of 656 in OH
Livability — Reedurban
No livability data for this city. (Only ~50 U.S. cities are tracked.)
Census & demographics
- Census place
- Reedurban, OH
- County
- Stark County · 272,865 people
- Metro
- Canton-Massillon, OH
- Population (ZIP)
- 24,285
- Household income
- $63,706
- Rent vs Own
- Severe rent burden
- 725.0
Population outlook (Stark County) Hauer SSP2
- Today (2025)
- 373,708 people
- By 2030
- 371,245 · -0.7%
- By 2040
- 361,331 · -3.3%
- By 2050
- 345,290 · -7.6%
- By 2075
- 302,669 · -19.0%
- By 2100
- 238,870 · -36.1%
Race, ethnicity, and origin ACS 2023
- Neighborhood character
- Predominantly White (80%)
- Race & ethnicity
- White 80% Black 8% Two or more races 8% Hispanic / Latino 4% Asian 3%
- Common ancestry
- Italian 8% Romanian 2% Slovak 2%
- Foreign-born
- 4% · Canada, South Korea, Vietnam
- Languages at home
- 95% English-only · Spanish 2% Other Indo-European 1% Tagalog/Filipino 1%
Political lean MEDSL · Stark
- 2024 margin
- Strong R (+21.9) · D 38.6% · R 60.5%
- 2008→2024 swing
- -27.4pp toward R · 2008: 5.5pp · 2024: -21.9pp
- All cycles
- 2024: R+21.9 2020: R+18.5 2016: R+17.4 2012: R+0.4 2008: D+5.5
Not yet ingested
- Civics
- —
Market trends
- HPI YoY
- ▼ -168.35%
- Current HPI
- 206.298
- Rent YoY
- ▲ 6.73%
- Metro
- Canton-Massillon, OH
- State GDP YoY
- ▲ 1.98%
- F500 in state
- 48
Industry mix (Fortune 500 HQ in OH)
| Industry | F500 HQs | Revenue |
|---|---|---|
| Insurance | 3 | $145B |
|
||
| Industrial Machinery | 3 | $49B |
|
||
| Financial Services | 3 | $24B |
|
||
| Consumer Goods | 2 | $93B |
|
||
| Aerospace / Defense | 2 | $47B |
|
||
| Utilities | 2 | $33B |
|
||
Price history
+125.2% since first listed10 events — show timeline
- 2026-04-19 Pending — MLSNOW
- 2026-04-16 Listed $179,900 MLSNOW
- 2020-07-01 Sold (Public Records) $105,000 Public Records
- 2020-06-30 Sold (MLS) $105,000 MLSNOW
- 2020-05-20 Pending — MLSNOW
- 2020-05-17 Listed $104,900 MLSNOW
- 2014-09-09 Sold (Public Records) $75,000 Public Records
- 2014-09-08 Sold (MLS) $75,000 MLSNOW
- 2014-07-27 Listing Removed — MLSNOW
- 2014-06-02 Listed $79,900 MLSNOW
Property tax history
+2.8%/yrLatest (2024): $1,580 · -10.8% YoY. Source: county tax records.
Cash-flow waterfall
monthlySold comps — $/sqft
last 12 mo · ≤1 miLoading sold comps…