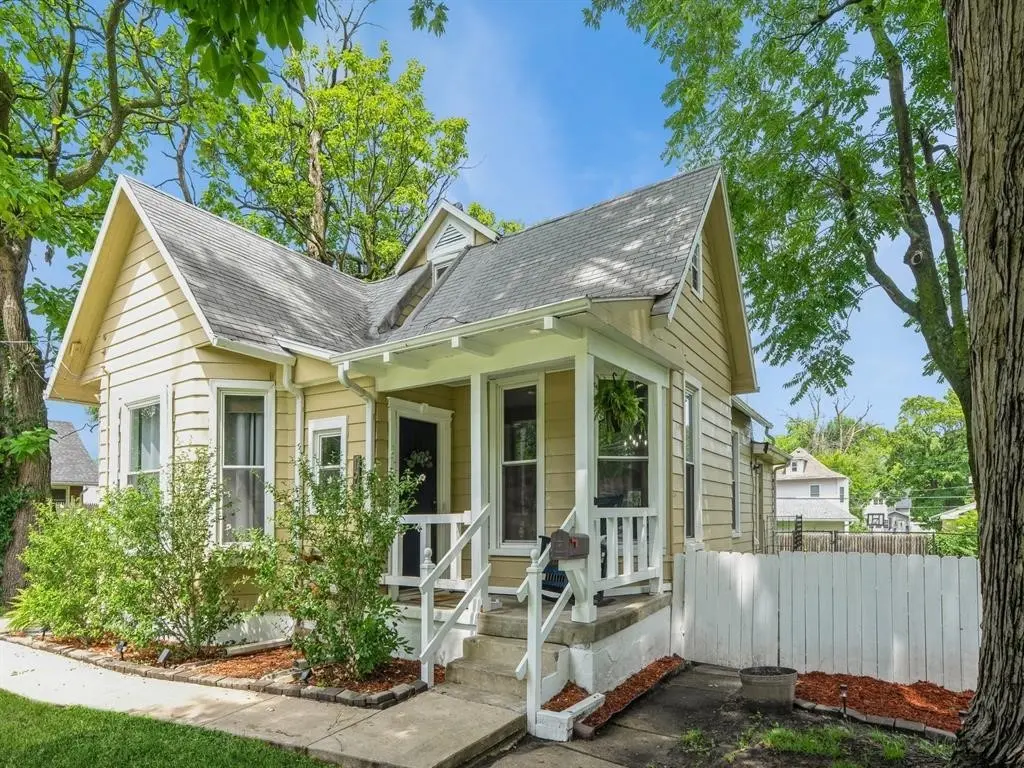
1903 Mondamin Ave · Des Moines, IA
Flood risk 1/10 · Minimal
- FEMA flood zone
- X (unshaded)
- Chance of flooding over 30 yrs
- 0.0%
- Est. flood insurance / yr
- $473 – $860
Fire risk 1/10 · Minimal
- Est. fire insurance / yr
- $902 – $1,676
Heat risk 3/10 · Minor
- Hot days now (above 103°F)
- 7 days/yr
- Hot days in 30 yrs
- 15 days/yr
Wind risk 2/10 · Minimal
- Chance of severe wind over 30 yrs
- —
Air-quality risk 2/10 · Minimal
- Unhealthy air days now
- 1 days/yr
- Unhealthy air days in 30 yrs
- 2 days/yr
Risk factors via First Street. Map © Google.
Why this score? — see what drove the D- grade
The composite is a weighted blend of 9 inputs, each scored 0–100. Each bar is that input's sub-score; the figure is the points it added to the 100-point composite (weight × sub-score).
- Appreciation +10.0/10.0
- Cash flow +8.1/30.0
- Rent growth +4.5/5.0
- Livability +4.0/5.0
- Schools +3.8/10.0
- Condition / age +2.5/5.0
- 1% rule +2.2/10.0
- DSCR +2.1/10.0
- ARV discount +2.1/15.0
$205,000
🖨 Deal sheet (PDF) 📄 Offer letter ✓ Due diligence
Listing remarks MLS
This newly remodeled property features : updated appliances, new interior and exterior paint, and new driveway. Main floor has a nice sized master bedroom with large windows. Second bedroom has extra storage space and can be used as a walk-in closet. Both bathrooms are on the first floor as well as a laundry area off to the side of the kitchen. This home does have a large finished attic area that can be used as another bedroom, office, or play area. Huge partially fenced-in backyard with a garden and shed. Close to King Elementary and easy access to the interstate. Property is being sold "as is. "
Key facts
- Updated appliances
- Extra storage space
- Finished attic area
Tags
Property features AI
Exterior
- Utilities: Public water; Public sewer
- Home design: Metal siding construction
- Construction: Brick/mortar foundation; Asphalt shingle roof; Metal siding
- Exterior features: Concrete road access; Zoned N5
Interior
- Kitchen: Dishwasher; Microwave; Refrigerator; Stove
- Bedrooms: 2 main-level bedrooms
- Flooring: Hardwood; Laminate
- Bathrooms: 2 full bathrooms
- Heating & cooling: Forced air heating (natural gas); Central air conditioning
- Interior features: Unfinished basement
- Laundry & utility: Washer; Dryer
Neighborhood map
What this means for you Summary
Snapshot
- This is a 3-bed/2.0-bath single-family listed at $205k.
Deal economics
- At list price, monthly cash flow is $-201 ($-2k/yr) — negative.
- To cash-flow at today's rent, offer at most $169k (17.3% below list).
- To meet the 1% rule (rent ≥ 1% of price), the offer needs to be $147k (28.1% below list).
- Recommended offer: $147k (28.1% below list) — sets the bar for 1% rule.
- Cap rate 5.1% vs local median 3.1% in Des Moines — top-decile yield for the area; either an underpriced asset or a hidden risk that comps aren't pricing in. Stress-test before assuming the spread holds.
Location & tenants
- Location reads 81/100 on livability (#63 in IA, #1,432 nationally) — a professional / high-income tenant draw. Strengths: commute A+, cost of living A+, housing A+; Watch: employment C-, crime F.
- Des Moines Independent Community School District (urban): math 43% / reading 46% proficiency, ranked #289 of 289 in IA (top 100%) — families likely to look elsewhere, expect single-tenant / working-renter base with shorter leases; 63% free/reduced lunch — lower-income household profile, screen leases tightly.
- Zoned schools: King Elementary School (math 17% / reading 22%, grade F, #616 of 616 statewide, top 100%, 267 students, 97% FRL); Meredith Middle School (math 40% / reading 40%, grade F, #239 of 246 statewide, top 97%, 664 students, 84% FRL); Hoover High School (math 46% / reading 55%, grade D+, #311 of 336 statewide, top 93%, 991 students, 78% FRL) — zoned schools average 86% FRL vs 63% district-wide (24 pts higher); higher-poverty schools than district average — tighter screening recommended.
- Market conditions: Rents rising fast (+8.2%/yr); 64 active listings in the ZIP; 17 comparable units currently listed for rent nearby; rentals lingering (median 46d on market — plan ~5-8 weeks vacancy on turnover, expect pricing pressure); 53% of comp listings sitting > 30 days — soft ceiling on asking rent; lower-income renter base — watch delinquency; 2,953 units permitted in Polk County in 2024 (540 in 5+ unit buildings).
- This rent runs 44% of the median local income ($40k/yr) — at the standard rent-burdened threshold; future hikes will face affordability resistance.
Forward outlook
- In year one you build about $22k of equity ($1k loan paydown + $20k appreciation (10.0% local appreciation)).
- Polk County population projected at +37% by 2050 — long-run rental-demand tailwind backs the buy-and-hold thesis.
- By year 2, paydown + projected appreciation supports a ~$35k cash-out refi (75% LTV) — recoverable capital for the next deal without selling this one.
Negotiation context
- Only 13 days on market — expect competitive offers; lowballing is unlikely to land.
- 4 sale attempts since 10y ago with the ask held roughly flat each time — persistent listings suggest the price (not the market) is what's stuck; bring a comps-based counter.
- Current owner paid $80k; list at $205k implies a 156% gain — meaningful room to come down on a strong offer.
Risks & watch-outs
- Watch-outs: built in 1895 — expect roof / HVAC / electrical / plumbing capex.
Questions for the listing agent
- What do current leases actually rent for vs. the listed asking? Can we see a recent rent roll and the last 12 months of T-12 income?
- Built in 1895 — when were the roof, HVAC, electrical panel, plumbing, and water heater last replaced?
- Is there a deadline driving the sale (1031 exchange, divorce, estate, relocation)? That informs how much negotiation room exists.
- Schools are D-rated, which usually means shorter tenancies and higher turnover. Who's the typical renter profile here, and what's been the actual vacancy rate?
- Crime grade is F in this area — have there been break-ins, vandalism, or insurance claims at this property in the last 3 years? What carrier currently insures it and at what premium?
- The area grade is low — what's the realistic commute time and amenity access for the typical tenant pool here? Any planned neighborhood developments (good or bad) we should know about?
- What's the average days-on-market for RENTAL listings here right now (not sales)? A rising rental-DOM trend means longer vacancies and softer asking-rent achievability than the comps imply.
- What's the recent tenant-quality profile in this submarket — average credit score on applications, eviction rate, late-payment / NSF rate, and stable-employment percentage? A property-management company in the area should have these aggregated.
- How much new for-sale + rental construction is in the pipeline within 1–3 miles? Heavy new supply typically softens prices + rents 12–24 months out; constrained supply supports both.
Investment metrics
- 1% rule
- 0.72% ✗
- Cap rate
- 5.11%
- Cash-on-cash
- -4.21%
- DSCR
- 0.81
- GRM
- 11.6
CMA / ARV
- ARV (on-the-fly)
- $183,105
- Comps found
- 12
Show comp detail 12 sales within ~0.75 mi
| Address | Dist | Beds/Ba | Sqft | Sold | Price | $/sf | Match |
|---|---|---|---|---|---|---|---|
| 1656 Martin Luther King Jr Pkwy | 0.10mi | 3/1.0 | 1,442 (-8%) | 4mo | $188,000 | $130 | 75 |
| 1534 18th St | 0.14mi | 4/2.5 (+1) | 1,440 (-8%) | 2mo | $200,000 | $139 | 72 |
| 1510 11th St | 0.58mi | 3/1.5 | 1,536 (-2%) | 0mo | $179,000 | $117 | 68 |
| 1526 Harrison Ave | 0.35mi | 4/2.0 (+1) | 1,456 (-7%) | 2mo | $230,000 | $158 | 66 |
| 1502 17th St | 0.23mi | 3/1.0 | 1,352 (-14%) | 0mo | $90,025 | $67 | 62 |
| 1347 Forest Ave | 0.46mi | 4/2.0 (+1) | 1,460 (-7%) | 4mo | $260,000 | $178 | 59 |
| 1513 Washington Ave | 0.26mi | 4/2.0 (+1) | 1,745 (+12%) | 7mo | $215,000 | $123 | 58 |
| 1303 22nd St | 0.51mi | 4/2.0 (+1) | 1,453 (-7%) | 4mo | $155,000 | $107 | 56 |
| 1925 Francis Ave | 0.39mi | 3/1.0 | 1,388 (-11%) | 5mo | $148,000 | $107 | 54 |
| 2126 University Ave | 0.62mi | 4/1.5 (+1) | 1,654 (+6%) | 6mo | $105,000 | $63 | 50 |
| 1505 University Ave | 0.63mi | 4/1.0 (+1) | 1,395 (-11%) | 5mo | $118,000 | $85 | 40 |
| 2009 10th St | 0.70mi | 4/1.5 (+1) | 1,376 (-12%) | 3mo | $55,000 | $40 | 37 |
Match score weights: distance 35% · size 25% · config 20% · recency 20%. Top-matched comps best support the ARV.
Projected returns pro-forma
10.0% appreciation · 8.0% rent growth · sell at horizon
- IRR
- 22.7%
- Equity multiple
- 2.86×
- Total profit
- $106,611
- Equity at exit
- $184,680
- IRR
- 21.5%
- Equity multiple
- 6.98×
- Total profit
- $343,310
- Equity at exit
- $398,270
Cash invested: $57,400 (down + closing). Projections, not guarantees.
Landlord ↔ Tenant lean methodology
- Overall (STATE)
- 83 Strongly Landlord-Friendly
- State Iowa
- 83 Strongly Landlord-Friendly · R+6
- County
- — inherits STATE
- City
- — inherits STATE
ZIP-level market 50314
- Home prices YoY
- 9.8%
- Rents YoY
- 8.2%
- Active inventory
- 64
- Price-to-rent
- 11.6×
Monthly cashflow live
- Estimated rent
- $1,474 high interval (Pro) →
- Mortgage (P&I)
- −$1,075
- Tax from tax record
- −$205 /mo · $2,462/yr
- Insurance
- −$85
- HOA
- −$0
- Vacancy / Maint / Mgmt
- −$310
- Net cashflow
- $-201
Break-even live
Sensitivity live
| Price | -10% $-85 | -5% $-143 | +0% $-201 | +5% $-259 | +10% $-317 |
|---|---|---|---|---|---|
| Rent | -10% $-318 | -5% $-259 | +0% $-201 | +5% $-143 | +10% $-85 |
| Rate | -1.0pp $-98 | -0.5pp $-149 | base $-201 | +0.5pp $-254 | +1.0pp $-308 |
UW: 25.0% down · 7.5% · 30yr · 1.5% tax · 5.0% vac · 8.0% maint · 8.0% mgmt
Financing live
Cash to close
- Down payment
- $51,250
- Closing costs
- $6,150
- Reserves months
- —
- Total cash needed
- —
Loan-product check · same deal, 3 products live
Conventional
25% down · 7.5% · 30yr
- Down + closing
- —
- Monthly P&I
- —
- Monthly cashflow
- —
- DSCR
- —
- Eligible?
- —
Personal DTI + credit; lowest rate.
DSCR
20% down · 8.5% · 30yr
- Down + closing
- —
- Monthly P&I
- —
- Monthly cashflow
- —
- DSCR
- —
- Eligible?
- —
No personal income docs; deal must DSCR.
Hard money
10% down · 12.0% · 12mo
- Down + closing
- —
- Monthly P&I
- —
- Monthly cashflow
- —
- DSCR
- —
- Eligible?
- —
Short-term bridge; refi at stabilization.
Rent comps 17 comps
| Address | Beds | Baths | Sqft | Rent | $/sqft | DOM | Units | Dist |
|---|---|---|---|---|---|---|---|---|
| 1637 23rd St Des Moines, IA | 4.0 | 2.0 | 1743 | $1,595 | $0.92 | 45d | 1 | 0.25mi |
| 1314 Harrison Ave Des Moines, IA | 3.0 | 1.0 | 1150 | $1,195 | $1.04 | 25d | 1 | 0.50mi |
| 2717 Meek Ave Des Moines, IA | 2.0 | 2.0 | 1128 | $1,550 | $1.37 | 16d | 1 | 0.60mi |
| 2501 24th St Apt 106 Des Moines, IA | 4.0 | 2.0 | 1175 | $1,245 | $1.06 | 45d | 1 | 0.61mi |
| 1171 21st St Unit 2 Des Moines, IA | 4.0 | 1.0 | 1210 | $1,300 | $1.07 | 45d | 1 | 0.63mi |
| 3103 Forest Ave Des Moines, IA | 1.0–2.0 | 1.0–1.5 | 900 | $1,550 | $1.72 | 16d | 1 | 0.94mi |
| 1717 Olive Ave Unit B6 Des Moines, IA | 2.0 | 2.0 | 1092 | $1,700 | $1.56 | 45d | 1 | 1.00mi |
| 1546 33rd St Des Moines, IA | 4.0 | 2.0 | 1540 | $1,850 | $1.20 | 16d | 1 | 1.01mi |
| 2940 Brattleboro Ave Unit 2 Des Moines, IA | 3.0 | 2.0 | 1250 | $1,300 | $1.04 | 16d | 1 | 1.07mi |
| 1345 Keosauqua Way Des Moines, IA | 2.0 | 2.5 | 1550 | $2,045 | $1.32 | 45d | 1 | 1.10mi |
| 1260 34th St Unit 401 Des Moines, IA | 3.0 | 2.0 | 1088 | $1,335 | $1.23 | 45d | 1 | 1.19mi |
| 2403 36th St Des Moines, IA | 3.0 | 2.0 | 1324 | $1,600 | $1.21 | 25d | 1 | 1.26mi |
| 1201 Center St Des Moines, IA | 2.0 | 2.5 | 2141 | $2,450 | $1.14 | 23d | 5 | 1.27mi |
| 1821 Woodland Ave Des Moines, IA | 2.0 | 2.0 | 1200 | $1,472 | $1.23 | 45d | 2 | 1.42mi |
| 641 19th St Unit WP 1 Des Moines, IA | 2.0 | 2.0 | 1200 | $1,550 | $1.29 | 45d | 1 | 1.43mi |
| 641 19th St Unit WP 5 Des Moines, IA | 2.0 | 2.0 | 1200 | $1,395 | $1.16 | 45d | 1 | 1.43mi |
| 2715 Douglas Ave Des Moines, IA | 3.0 | 2.0 | 1109 | $1,408 | $1.27 | 16d | 1 | 1.44mi |
Listing history 11 events
-
2026-06-21days on market $205,000 Active 13 DOM
-
2026-06-18days on market $205,000 Active 10 DOM
-
2026-06-17price $205,000 Active 9 DOM
-
2026-06-17days on market $215,000 Active 9 DOM
-
2026-06-16days on market $215,000 Active 8 DOM
-
2026-06-15days on market $215,000 Active 7 DOM
-
2026-06-14days on market $215,000 Active 5 DOM
-
2026-06-13days on market $215,000 Active 4 DOM
-
2026-06-10days on market $215,000 Active 2 DOM
-
2026-06-09remarks 597-char remark
-
2026-06-09$215,000 Active 1 DOM
ⓘ Source: listings_history table (triggers on properties + properties_extension) + one-shot
backfill from property_details.listing_events for pre-trigger history.
Tax reassessment forecast IA · Partial reset (capped growth)
- Current annual tax
- $2,462 · $205/mo
- Projected year-2 tax
- $2,840 · $237/mo
- Expected delta
- +$378/yr (+$32/mo · 15.4%)
ⓘ Screening estimate from a state-policy table — verify with the county assessor before closing.
Climate risk First Street
- Flood 1/10 Low FEMA zone X (unshaded) · 0% chance over 30 yrs
- Wildfire 1/10 Low
- Heat 3/10 Moderate 7 d/yr ≥103°F today · 15 d/yr by 30 yrs out
- Wind 2/10 Low
- Air quality 2/10 Low 1 unhealthy d/yr today · 2 by 30 yrs out
Nearby sold comps map
Loading sold comps map…
Walkable amenities ~0.75 mi
Loading nearby amenities…
Taxation est. · year 1
- Rental income
- $17,687
- − Mortgage interest
- −$11,483
- − Property taxes
- −$2,462
- − Insurance
- −$1,025
- − Repairs & maintenance
- −$1,415
- − Management
- −$1,415
- − Depreciation
- −$5,964
- Taxable loss
- −$6,077
- Est. tax savings @ 24.0%
- +$1,458
- After-tax cash flow
- $-956/yr
For passive investors: Depreciation is non-cash, so a rental often shows a tax loss while cash-flowing — sheltering income. Rental losses are passive: they offset passive income freely, and up to $25,000/yr can offset ordinary (W-2) income if you actively participate and your MAGI is under $100k (phasing out to $0 by $150k); unused losses carry forward. On sale, claimed depreciation is recaptured at up to 25%, and gains may owe capital-gains tax (a 1031 exchange can defer both). Figures are a year-1 estimate at your 24.0% rate — not tax advice; consult a CPA.
Schools (NCES district)
- District
- Des Moines Independent Community School District
- NCES district ID
- 1908970
- Math proficiency
- 43% ▼ -6.00%
- Reading proficiency
- 46% ▼ -1.00%
- Median HH income
- $45,905
- Composite
- 37.83/100
- National rank
- #4331
- State rank
- #289 of 289 in IA
Livability — Des Moines
- Score
- 81/100
- State rank
- #63
- US rank
- #1432
Category grades
Schools grade is shown separately in the Schools card above.
Census & demographics
- Census place
- Des Moines, IA
- County
- Polk County · 453,298 people
- City population
- 203,612
- Metro
- Des Moines-West Des Moines, IA
- Population (ZIP)
- 10,438
- Household income
- $39,950
- Rent vs Own
- Severe rent burden
- 903.0
Population outlook (Polk County) Hauer SSP2
- Today (2025)
- 548,042 people
- By 2030
- 588,557 · +7.4%
- By 2040
- 670,629 · +22.4%
- By 2050
- 752,830 · +37.4%
- By 2075
- 955,069 · +74.3%
- By 2100
- 1,115,436 · +103.5%
Race, ethnicity, and origin ACS 2023
- Neighborhood character
- Highly diverse neighborhood (Simpson 0.73)
- Race & ethnicity
- Black 37% White 29% Hispanic / Latino 20% Asian 12% Two or more races 10%
- Hispanic origin (detail)
- Mexican 13%
- Common ancestry
- Ukrainian 6% Iranian 2% Swiss 1%
- Foreign-born
- 26% · Canada, Vietnam, Philippines
- Languages at home
- 60% English-only · Spanish 16% Vietnamese 6% Other Asian/Pacific 4%
Political lean MEDSL · Polk
- 2024 margin
- D (+10.9) · D 54.8% · R 43.9% · Other 1.3%
- 2008→2024 swing
- -3.7pp toward R · 2008: 14.6pp · 2024: 10.9pp
- All cycles
- 2024: D+10.9 2020: D+15.2 2016: D+11.5 2012: D+14.2 2008: D+14.6
Not yet ingested
- Civics
- —
Market trends
- HPI YoY
- ▲ 30.18%
- Current HPI
- 338.8301
- Rent YoY
- ▲ 8.17%
- Metro
- Des Moines-West Des Moines, IA
- State GDP YoY
- ▲ 2.48%
- F500 in state
- 4
Industry mix (Fortune 500 HQ in IA)
| Industry | F500 HQs | Revenue |
|---|---|---|
| Financial Services | 1 | $16B |
|
||
| Retail / Convenience | 1 | $15B |
|
||
Price history
+145.7% since first listed6 events — show timeline
- 2026-06-08 Listed $215,000 DMMLS
- 2025-08-15 Relisted — DMMLS
- 2025-08-13 Pending — DMMLS
- 2025-08-07 Listed $205,000 DMMLS
- 2016-11-08 Sold (MLS) $80,000 DMMLS
- 2016-09-20 Listed $87,500 DMMLS
Property tax history
+5.6%/yrLatest (2025): $2,462 · +2.1% YoY. Source: county tax records.
Cash-flow waterfall
monthlySold comps — $/sqft
last 12 mo · ≤1 miLoading sold comps…