 Multi-family
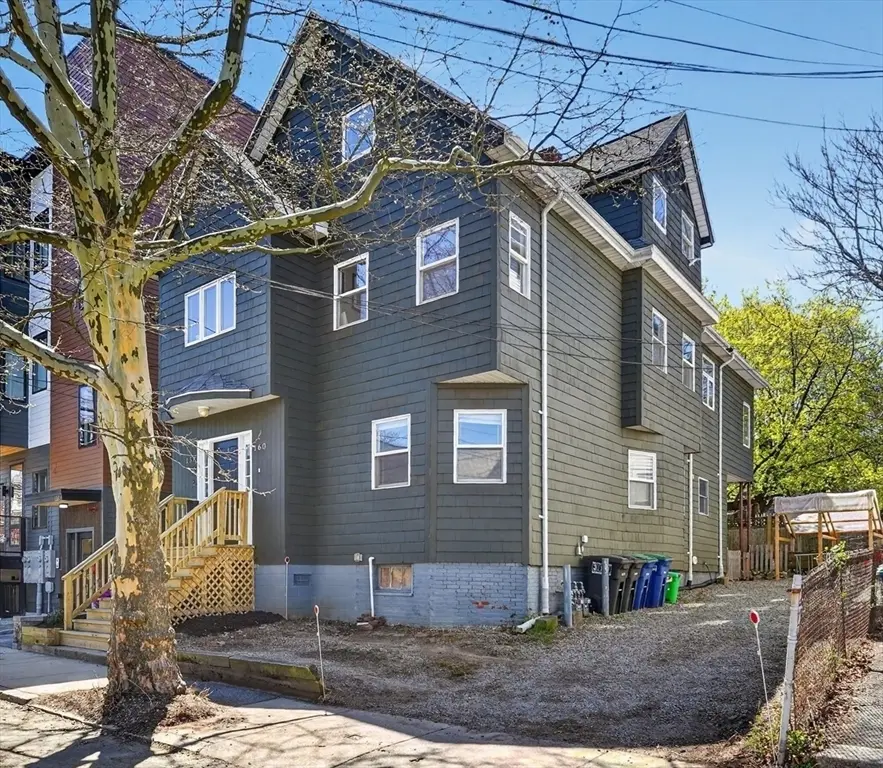
158 Albion St · Somerville, MA
Flood risk 4/10 · Minor
- FEMA flood zone
- X (unshaded)
- Chance of flooding over 30 yrs
- 0.22%
- Est. flood insurance / yr
- $473 – $860
Fire risk 1/10 · Minimal
- Est. fire insurance / yr
- $915 – $1,699
Heat risk 6/10 · Moderate
- Hot days now (above 96°F)
- 7 days/yr
- Hot days in 30 yrs
- 15 days/yr
Wind risk 6/10 · Moderate
- Chance of severe wind over 30 yrs
- 63.0%
Air-quality risk 3/10 · Minor
- Unhealthy air days now
- 3 days/yr
- Unhealthy air days in 30 yrs
- 3 days/yr
Risk factors via First Street. Map © Google.
Why this score? — see what drove the D grade
The composite is a weighted blend of 9 inputs, each scored 0–100. Each bar is that input's sub-score; the figure is the points it added to the 100-point composite (weight × sub-score).
- ARV discount +10.9/15.0
- Cash flow +8.1/30.0
- Appreciation +7.0/10.0
- Livability +4.2/5.0
- Rent growth +3.5/5.0
- Schools +3.2/10.0
- Condition / age +2.5/5.0
- DSCR +2.1/10.0
- 1% rule +2.0/10.0
$1,399,900
🖨 Deal sheet (PDF) 📄 Offer letter ✓ Due diligence
Multi-family units
County records classify this as Multi-Family (2-4 Unit). Listing-text estimate: 1 unit. estimate disagrees with records
Listing remarks
SPECIAL FINANCING STARTING AT 3.75% IN YR 1 with no points. LESS THAN A QUARTER MILE TO THE GREEN LINE. .. HALF MILE TO THE RED LINE! MASSIVE 13 ROOM WELL MAINTAINED TWO FAMILY has it all! Massive 3,300 sq ft of living area on 3 lvls with 7 total bdrms and three full bths. FIRST FLOOR has been renovated w/ in past 10 years and consists of 4 rms, 2 bdrms, 1 bath. .. SECOND FLOOR APARTMENT is bigger than most single family's with 11 rms, 5 bdrms and 2 full bths. Upstairs Kitchen has been renovated with a breakfast nook and double sliders onto a deck. The top floor has cathedral ceilings, skylights, and a family rm. BOTH UNITS HAVE LAUNDRY'S. Plenty of off street prkng, up to 4 cars. GREAT po
Key facts
- Off street parking
- Cathedral ceilings
- Skylights
Tags
Property features AI
Finance
- HOA & community: Not a senior community
Exterior
- Parking: 4 open parking spaces (4 total parking spaces)
- Utilities: Public water; Public sewer; Electric service with 220 volts and circuit breakers; Gas hookup for range
- Home design: Multi-family property; 3 stories; 3,317 total building area
- Construction: Frame construction; Stone and brick/mortar foundation; Shingle roof; Built (approximate year per public records)
- Exterior features: Porch; Deck
Interior
- Flooring: Wood flooring; Tile flooring
- Bathrooms: 3 full bathrooms
- Heating & cooling: 2 heating units
- Interior features: 13 total rooms; Full basement
- Laundry & utility: Washer hookup; Electric dryer hookup
Neighborhood map
What this means for you Summary
Snapshot
- This is a 5-bed/3.0-bath multifamily listed at $1.40M.
Deal economics
- At list price, monthly cash flow is $-1k ($-17k/yr) — negative.
- To cash-flow at today's rent, offer at most $1.15M (17.6% below list).
- To meet the 1% rule (rent ≥ 1% of price), the offer needs to be $974k (30.4% below list).
- Recommended offer: $974k (30.4% below list) — sets the bar for 1% rule.
- Cap rate 5.1% vs local median 2.2% in Somerville — top-decile yield for the area; either an underpriced asset or a hidden risk that comps aren't pricing in. Stress-test before assuming the spread holds.
Location & tenants
- Location reads 84/100 on livability (#18 in MA, #752 nationally) — a professional / high-income tenant draw. Strengths: amenities A+, commute A+, employment A+; Watch: cost of living F.
- Somerville (suburban): math 26% / reading 43% proficiency, ranked #223 of 302 in MA (top 74%) — families likely to look elsewhere, expect single-tenant / working-renter base with shorter leases.
- Zoned schools: E Somerville Community (math 15% / reading 35%, grade F, #716 of 938 statewide, top 77%, 729 students, 0% FRL); Next Wave Junior High (math 24% / reading 24%, 15 students, 0% FRL); Somerville High (math 43% / reading 58%, grade D+, #181 of 343 statewide, top 53%, 1,310 students, 0% FRL) — zoned schools average 0% FRL vs 56% district-wide (56 pts lower); this property's tenant base skews higher-income than the district average.
- Market conditions: Rents rising fast (+4.2%/yr); 52 active listings in the ZIP; 11 comparable units currently listed for rent nearby; rentals at typical pace (median 20d on market — plan ~3-4 weeks tenant-placement turnaround); high-income renter base; 3,670 units permitted in Middlesex County in 2024 (2,611 in 5+ unit buildings).
- At $9,737/mo this rent would consume 78% of the median local household income ($150k/yr) (locally 1177% of renters already pay >50% of income on rent) — very limited rent-growth headroom before tenants either downsize or default.
Forward outlook
- In year one you build about $64k of equity ($10k loan paydown + $55k appreciation (3.9% local appreciation)).
- Middlesex County population projected at +20% by 2050 — long-run rental-demand tailwind backs the buy-and-hold thesis.
- By year 2, paydown + projected appreciation supports a ~$104k cash-out refi (75% LTV) — recoverable capital for the next deal without selling this one.
Negotiation context
- It's been on market 41 days — a 3% lower offer ($1.36M) is reasonable based on typical stale-listing flexibility.
- Current owner paid $110k; list at $1.40M implies a 1173% gain — meaningful room to come down on a strong offer.
Risks & watch-outs
- Watch-outs: built in 1890 — expect roof / HVAC / electrical / plumbing capex.
- Climate carrying-cost: major wind risk, 63% chance of damaging wind over 30y; extreme-heat days projected 7→15/yr by 2055 (HVAC capex compounding) — expect insurance premiums to compound above CPI over the hold.
Questions for the listing agent
- What do current leases actually rent for vs. the listed asking? Can we see a recent rent roll and the last 12 months of T-12 income?
- It's been on market 41 days. Have you received any prior offers? Is the seller open to a 30% concession, seller financing, or rate buy-down credit?
- Built in 1890 — when were the roof, HVAC, electrical panel, plumbing, and water heater last replaced?
- Is there a deadline driving the sale (1031 exchange, divorce, estate, relocation)? That informs how much negotiation room exists.
- Schools are B-rated — typically a magnet for longer-tenancy family renters. What's the average tenant stay here, and is there a school-zone premium baked into asking?
- The area grade is low — what's the realistic commute time and amenity access for the typical tenant pool here? Any planned neighborhood developments (good or bad) we should know about?
- What's the average days-on-market for RENTAL listings here right now (not sales)? A rising rental-DOM trend means longer vacancies and softer asking-rent achievability than the comps imply.
- What's the recent tenant-quality profile in this submarket — average credit score on applications, eviction rate, late-payment / NSF rate, and stable-employment percentage? A property-management company in the area should have these aggregated.
- How much new apartment / multifamily construction is in the pipeline within 1–3 miles? Heavy new supply (>2% of stock underway) typically softens rents 12–24 months out; light construction supports rent growth.
Investment metrics
- 1% rule
- 0.70% ✗
- Cap rate
- 5.10%
- Cash-on-cash
- -4.27%
- DSCR
- 0.81
- GRM
- 12.0
CMA / ARV
- ARV (median comp)
- $1,514,402
- List price
- $1,399,900
- Delta
- -7.56%
- Verdict
- FAIR
- Comps
- 20 within 1.0 mi
Show comp detail 12 sales within ~0.75 mi
| Address | Dist | Beds/Ba | Sqft | Sold | Price | $/sf | Match |
|---|---|---|---|---|---|---|---|
| 23 Highland Rd | 0.23mi | 5/2.5 | 3,352 (+1%) | 4mo | $1,350,000 | $403 | 82 |
| 80 Hudson St | 0.24mi | 5/2.0 | 3,240 (-2%) | 3mo | $1,184,000 | $365 | 78 |
| 114 Cedar St | 0.09mi | 6/2.0 (+1) | 3,090 (-7%) | 7mo | $1,220,000 | $395 | 70 |
| 32 Richardson St | 0.33mi | 5/3.0 | 2,992 (-10%) | 2mo | $1,000,000 | $334 | 67 |
| 56 William St | 0.46mi | 5/4.0 | 3,300 (-0%) | 9mo | $1,368,000 | $415 | 66 |
| 15-15A Forest St | 0.60mi | 4/3.5 (-1) | 3,307 (-0%) | 6mo | $2,375,000 | $718 | 59 |
| 26 Warner St | 0.70mi | 5/2.0 | 3,277 (-1%) | 3mo | $1,100,000 | $336 | 59 |
| 10 Tennyson St | 0.52mi | 6/4.0 (+1) | 3,325 (+0%) | 10mo | $1,360,000 | $409 | 59 |
| 42 Belmont St | 0.43mi | 6/2.0 (+1) | 2,993 (-10%) | 2mo | $1,500,000 | $501 | 53 |
| 19 Willoughby St | 0.51mi | 6/3.5 (+1) | 3,706 (+12%) | 0mo | $1,558,000 | $420 | 49 |
| 39 Berkeley St | 0.62mi | 6/2.5 (+1) | 3,498 (+6%) | 9mo | $1,205,000 | $344 | 48 |
| 333 Highland Ave | 0.27mi | 6/4.0 (+1) | 3,752 (+13%) | 12mo | $1,830,000 | $488 | 47 |
Match score weights: distance 35% · size 25% · config 20% · recency 20%. Top-matched comps best support the ARV.
Projected returns pro-forma
3.9% appreciation · 4.15% rent growth · sell at horizon
- IRR
- 6.7%
- Equity multiple
- 1.41×
- Total profit
- $159,111
- Equity at exit
- $701,869
- IRR
- 9.5%
- Equity multiple
- 2.60×
- Total profit
- $627,009
- Equity at exit
- $1,141,705
Cash invested: $391,972 (down + closing). Projections, not guarantees.
Landlord ↔ Tenant lean methodology
- Overall (STATE)
- 20 Strongly Tenant-Friendly
- State Massachusetts
- 20 Strongly Tenant-Friendly · D+15
- County
- — inherits STATE
- City
- — inherits STATE
ZIP-level market 02144
- Home prices YoY
- 1.0%
- Rents YoY
- 4.2%
- Active inventory
- 52
- Price-to-rent
- 24.6×
Monthly cashflow live
- Estimated rent
- $9,737 high interval (Pro) →
- Mortgage (P&I)
- −$7,341
- Tax from tax record
- −$1,162 /mo · $13,939/yr
- Insurance
- −$583
- HOA
- −$0
- Vacancy / Maint / Mgmt
- −$2,045
- Net cashflow
- $-1,394
Break-even live
Sensitivity live
| Price | -10% $-601 | -5% $-998 | +0% $-1,394 | +5% $-1,790 | +10% $-2,186 |
|---|---|---|---|---|---|
| Rent | -10% $-2,163 | -5% $-1,778 | +0% $-1,394 | +5% $-1,009 | +10% $-625 |
| Rate | -1.0pp $-689 | -0.5pp $-1,038 | base $-1,394 | +0.5pp $-1,757 | +1.0pp $-2,126 |
2-unit breakdown (identical units grouped — click to expand)
| Units | Beds | Baths | Est. rent |
|---|---|---|---|
| 1× unit | 3 | 1 | $4,738 |
| 1× unit | 4 | 1 | $4,999 |
| Total (2 units) | $9,737 | ||
UW: 25.0% down · 7.5% · 30yr · 1.5% tax · 5.0% vac · 8.0% maint · 8.0% mgmt
Financing live
Cash to close
- Down payment
- $349,975
- Closing costs
- $41,997
- Reserves months
- —
- Total cash needed
- —
Loan-product check · same deal, 3 products live
Conventional
25% down · 7.5% · 30yr
- Down + closing
- —
- Monthly P&I
- —
- Monthly cashflow
- —
- DSCR
- —
- Eligible?
- —
Personal DTI + credit; lowest rate.
DSCR
20% down · 8.5% · 30yr
- Down + closing
- —
- Monthly P&I
- —
- Monthly cashflow
- —
- DSCR
- —
- Eligible?
- —
No personal income docs; deal must DSCR.
Hard money
10% down · 12.0% · 12mo
- Down + closing
- —
- Monthly P&I
- —
- Monthly cashflow
- —
- DSCR
- —
- Eligible?
- —
Short-term bridge; refi at stabilization.
Rent comps 11 comps
| Address | Beds | Baths | Sqft | Rent | $/sqft | DOM | Units | Dist |
|---|---|---|---|---|---|---|---|---|
| 455 Broadway Unit 2 Somerville, MA | 4.0 | 2.0 | 3067 | $5,200 | $1.70 | 26d | 1 | 0.54mi |
| 19 Creighton St Cambridge, MA | 5.0 | 4.0 | 2300 | $6,700 | $2.91 | 19d | 1 | 0.64mi |
| 40 Evergreen Ave #1 Somerville, MA | 4.0 | 3.5 | 2800 | $7,000 | $2.50 | 45d | 1 | 0.73mi |
| 40 Evergreen Ave Unit A Somerville, MA | 4.0 | 3.5 | 2800 | $7,000 | $2.50 | 26d | 1 | 0.73mi |
| 14 Linnaean St Cambridge, MA | 4.0 | 3.5 | 3150 | $8,500 | $2.70 | 0d | 1 | 0.80mi |
| 21 Avon St Unit 21 Cambridge, MA | 4.0 | 3.5 | 2966 | $11,250 | $3.79 | 19d | 1 | 0.96mi |
| 61 Huron Ave Cambridge, MA | 5.0 | 4.0 | 3890 | $16,500 | $4.24 | 3d | 1 | 1.06mi |
| 81 Flint St Unit 83 Somerville, MA | 5.0 | 3.0 | 2400 | $4,999 | $2.08 | 19d | 1 | 1.22mi |
| 15 Dimick St Somerville, MA | 4.0 | 2.0 | 2730 | $6,300 | $2.31 | 26d | 1 | 1.25mi |
| 8 Putnam Rd Unit 8 Somerville, MA | 4.0 | 1.5 | 2363 | $4,800 | $2.03 | 19d | 1 | 1.31mi |
| 16 Alston St #16 Somerville, MA | 4.0 | 3.0 | 2518 | $6,500 | $2.58 | 45d | 1 | 1.33mi |
Listing history 11 events
-
2026-06-09days on market $1,399,900 Active 41 DOM
-
2026-06-08days on market $1,399,900 Active 40 DOM
-
2026-06-07statusdays on market $1,399,900 Active 39 DOM
-
2026-06-04days on market $1,399,900 Price Changed 36 DOM
-
2026-06-03days on market $1,399,900 Price Changed 35 DOM
-
2026-06-02pricestatusdays on market $1,399,900 Price Changed 34 DOM
-
2026-06-01days on market $1,499,900 Active 33 DOM
-
2026-05-31statusdays on market $1,499,900 Active 32 DOM
-
2026-04-29$1,549,900 New 1000-char remark
-
1995-07-26soldstatus $110,000
-
1994-10-05soldstatus $115,000
ⓘ Source: listings_history table (triggers on properties + properties_extension) + one-shot
backfill from property_details.listing_events for pre-trigger history.
Tax reassessment forecast MA · Partial reset (capped growth)
- Current annual tax
- $13,939 · $1,162/mo
- Projected year-2 tax
- $15,579 · $1,298/mo
- Expected delta
- +$1,640/yr (+$137/mo · 11.8%)
ⓘ Screening estimate from a state-policy table — verify with the county assessor before closing.
Climate risk First Street
- Flood 4/10 Moderate FEMA zone X (unshaded) · 22% chance over 30 yrs
- Wildfire 1/10 Low
- Heat 6/10 Major 7 d/yr ≥96°F today · 15 d/yr by 30 yrs out
- Wind 6/10 Major 63% chance of damaging wind over 30 yrs
- Air quality 3/10 Moderate 3 unhealthy d/yr today · 3 by 30 yrs out
Nearby sold comps map
Loading sold comps map…
Walkable amenities ~0.75 mi
Loading nearby amenities…
Taxation est. · year 1
- Rental income
- $116,844
- − Mortgage interest
- −$78,416
- − Property taxes
- −$13,939
- − Insurance
- −$7,000
- − Repairs & maintenance
- −$9,348
- − Management
- −$9,348
- − Depreciation
- −$40,724
- Taxable loss
- −$41,930
- Est. tax savings @ 24.0%
- +$10,063
- After-tax cash flow
- $-6,663/yr
For passive investors: Depreciation is non-cash, so a rental often shows a tax loss while cash-flowing — sheltering income. Rental losses are passive: they offset passive income freely, and up to $25,000/yr can offset ordinary (W-2) income if you actively participate and your MAGI is under $100k (phasing out to $0 by $150k); unused losses carry forward. On sale, claimed depreciation is recaptured at up to 25%, and gains may owe capital-gains tax (a 1031 exchange can defer both). Figures are a year-1 estimate at your 24.0% rate — not tax advice; consult a CPA.
Schools (NCES district)
- District
- Somerville
- NCES district ID
- 2510890
- Math proficiency
- 26% ▼ -18.00%
- Reading proficiency
- 43% ▼ -6.00%
- Median HH income
- $71,304
- Composite
- 31.9/100
- National rank
- #5858
- State rank
- #223 of 302 in MA
Livability — Somerville
- Score
- 84/100
- State rank
- #18
- US rank
- #752
Category grades
Schools grade is shown separately in the Schools card above.
Census & demographics
- Census place
- Somerville, MA
- County
- Middlesex County · 1,437,704 people
- City population
- 78,456
- Metro
- Boston-Cambridge-Newton, MA-NH
- Population (ZIP)
- 25,448
- Household income
- $150,313
- Rent vs Own
- Severe rent burden
- 1177.0
Population outlook (Middlesex County) Hauer SSP2
- Today (2025)
- 1,740,269 people
- By 2030
- 1,817,187 · +4.4%
- By 2040
- 1,963,195 · +12.8%
- By 2050
- 2,087,461 · +20.0%
- By 2075
- 2,344,036 · +34.7%
- By 2100
- 2,383,776 · +37.0%
Race, ethnicity, and origin ACS 2023
- Neighborhood character
- Predominantly White (72%)
- Race & ethnicity
- White 72% Asian 11% Two or more races 10% Hispanic / Latino 8% Black 3%
- Hispanic origin (detail)
- Mexican 2% Puerto Rican 1%
- Common ancestry
- Russian 5% Romanian 4% Lithuanian 2%
- Foreign-born
- 17% · Canada, China, South Korea
- Languages at home
- 79% English-only · Other Indo-European 7% Spanish 4% Chinese 2%
Political lean MEDSL · Middlesex
- 2024 margin
- Solid D (+39.5) · D 68.5% · R 29.0% · Other 2.5%
- 2008→2024 swing
- +9.3pp toward D · 2008: 30.1pp · 2024: 39.5pp
- All cycles
- 2024: D+39.5 2020: D+45.2 2016: D+38.1 2012: D+26.9 2008: D+30.1
Not yet ingested
- Civics
- —
Market trends
- HPI YoY
- ▲ 3.90%
- Current HPI
- 389.6981
- Rent YoY
- ▲ 4.15%
- Metro
- Boston-Cambridge-Newton, MA-NH
- State GDP YoY
- ▲ 2.28%
- F500 in state
- 38
Industry mix (Fortune 500 HQ in MA)
| Industry | F500 HQs | Revenue |
|---|---|---|
| Technology | 3 | $17B |
|
||
| Insurance | 2 | $84B |
|
||
| Retail | 2 | $76B |
|
||
| Life Sciences | 1 | $43B |
|
||
| Energy Technology | 1 | $31B |
|
||
| Aerospace / Defense | 1 | $18B |
|
||
Price history
-4.3% since first listed2 events — show timeline
- 1995-07-26 Sold (Public Records) $110,000 Public Records
- 1994-10-05 Sold (Public Records) $115,000 Public Records
Property tax history
+4.9%/yrLatest (2025): $13,939 · +4.7% YoY. Source: county tax records.
Cash-flow waterfall
monthlySold comps — $/sqft
last 12 mo · ≤1 miLoading sold comps…