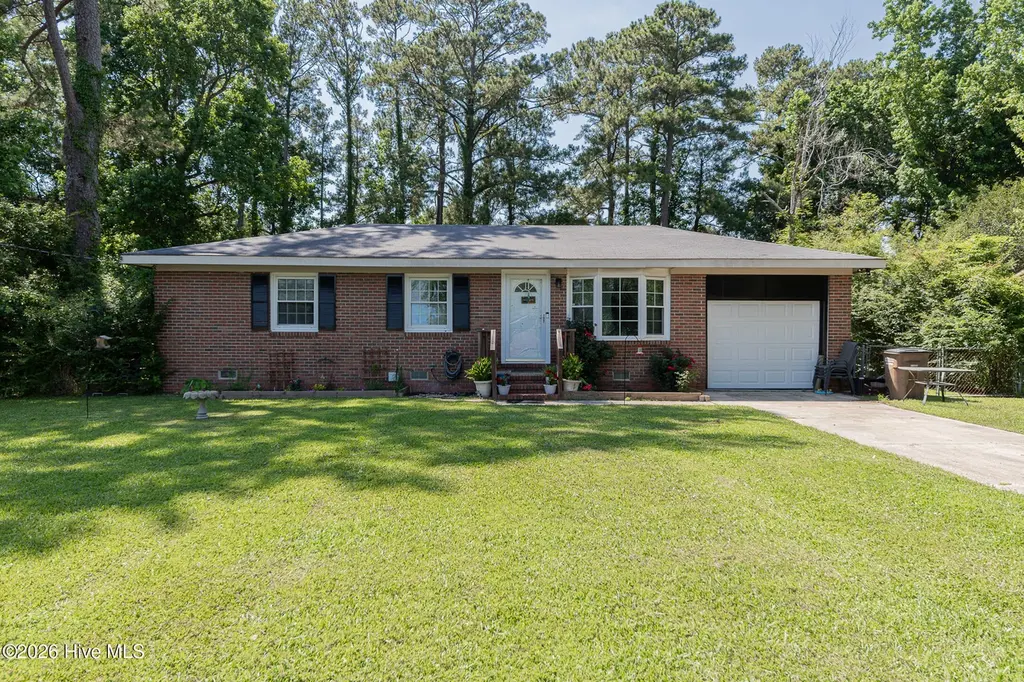
35 Victoria Rd · Piney Green, NC
Flood risk 1/10 · Minimal
- FEMA flood zone
- X (unshaded)
- Chance of flooding over 30 yrs
- 0.0%
- Est. flood insurance / yr
- $507 – $1,088
Fire risk 3/10 · Minor
- Est. fire insurance / yr
- $906 – $1,684
Heat risk 8/10 · Major
- Hot days now (above 106°F)
- 7 days/yr
- Hot days in 30 yrs
- 18 days/yr
Wind risk 8/10 · Major
- Chance of severe wind over 30 yrs
- 99.0%
Air-quality risk 2/10 · Minimal
- Unhealthy air days now
- 1 days/yr
- Unhealthy air days in 30 yrs
- 3 days/yr
Risk factors via First Street. Map © Google.
Why this score? — see what drove the F grade
The composite is a weighted blend of 9 inputs, each scored 0–100. Each bar is that input's sub-score; the figure is the points it added to the 100-point composite (weight × sub-score).
- Cash flow +13.1/30.0
- DSCR +3.9/10.0
- Schools +3.9/10.0
- Rent growth +3.5/5.0
- Livability +3.0/5.0
- 1% rule +2.5/10.0
- Condition / age +2.5/5.0
- ARV discount +0.0/15.0
- Appreciation +0.0/10.0
$229,501
🖨 Deal sheet (PDF) 📄 Offer letter ✓ Due diligence
Listing remarks MLS
* * * SELLER OFFERING $5,000 USE AS YOU CHOOSE * * * Welcome to your dream home! This recently updated 3-bedroom, 2-bath residence offers the perfect blend of modern amenities and classic charm. The kitchen boasts new appliances, complemented by sleek countertops and flooring that lend a contemporary touch to this space. Step into the living room to admire the refinished original hardwood floors, beautifully restored to their former glory. Soft, plush new carpeting flows throughout the rest of the home, creating a warm and inviting atmosphere. The master bathroom features a brand-new shower, while the hall bathroom showcases a meticulously refinished tub. Enjoy the convenience of a single-family garage and the freedom from HOA fees and city taxes. This home is truly a gem, ready for you to move in and make lasting memories. Don't miss the opportunity to call this delightful property yours!
Key facts
- Spacious backyard
- Single car garage
- Ready to move in
Tags
Property features AI
Finance
- Other: Zoning: R-10
- HOA & community: No association amenities
Exterior
- Parking: Attached 1-car garage; Paved parking; 1 parking space total
- Utilities: Public water; Septic tank sewer; Water service available
- Home design: Single-family residence; One story (entry level 1)
- Construction: Brick and frame construction; Shingle roof; Built on a crawl space
- Exterior features: Patio; Chain link fencing; Has a view; Road frontage on city street and state road; Lot dimensions approximately 90 x 180 x 91 x 181
Interior
- Bedrooms: 5 total rooms (bedroom count not explicitly provided)
- Bathrooms: 2 full bathrooms
- Heating & cooling: Central air conditioning; Electric heating with heat pump
- Interior features: Ceiling fan(s); Window coverings; Crawl space basement
Neighborhood map
What this means for you Summary
Snapshot
- This is a 3-bed/1.5-bath single-family listed at $230k.
Deal economics
- At list price, monthly cash flow is $-8 ($-96/yr) — negative.
- To cash-flow at today's rent, offer at most $228k (0.6% below list).
- To meet the 1% rule (rent ≥ 1% of price), the offer needs to be $171k (25.4% below list).
- Recommended offer: $171k (25.4% below list) — sets the bar for 1% rule.
- Cap rate 6.3% vs local median 3.6% in Piney Green — top-decile yield for the area; either an underpriced asset or a hidden risk that comps aren't pricing in. Stress-test before assuming the spread holds.
Location & tenants
- Location reads 60/100 on livability (#524 in NC) — a middle-class / working-renter tenant base. Strengths: cost of living A+, housing A+; Watch: crime D+, employment D+, amenities F.
- Onslow County Schools (other): math 42% / reading 49% proficiency, ranked #84 of 178 in NC (top 47%) — families likely to look elsewhere, expect single-tenant / working-renter base with shorter leases.
- Zoned schools: Morton Elementary (math 53% / reading 48%, grade D+, #403 of 1,410 statewide, top 29%, 682 students, 58% FRL); Hunters Creek Middle (math 32% / reading 44%, grade F, #251 of 475 statewide, top 54%, 922 students, 55% FRL); White Oak High (math 57% / reading 54%, grade C, #265 of 535 statewide, top 50%, 1,207 students, 49% FRL) — zoned schools average 54% FRL vs 37% district-wide (17 pts higher); higher-poverty schools than district average — tighter screening recommended.
- Market conditions: Rents rising (+3.9%/yr); 604 active listings in the ZIP; 4 comparable units currently listed for rent nearby; rentals at typical pace (median 22d on market — plan ~3-4 weeks tenant-placement turnaround); 1,246 units permitted in Onslow County in 2024 (0 in 5+ unit buildings).
- This rent runs 32% of the median local income ($64k/yr) — at the standard rent-burdened threshold; future hikes will face affordability resistance.
Forward outlook
- Local home prices are declining (-3.0%/yr); year-one equity from $2k of loan paydown is wiped out by about $7k of value loss. Plan a longer hold.
Negotiation context
- Only 7 days on market — expect competitive offers; lowballing is unlikely to land.
- 7 sale attempts since 13y ago with the ask held roughly flat each time — persistent listings suggest the price (not the market) is what's stuck; bring a comps-based counter.
- Current owner paid $198k; 16% above their basis — modest negotiation headroom, anchor on the comps not their cost.
Risks & watch-outs
- Climate carrying-cost: severe wind risk, 99% chance of damaging wind over 30y; extreme-heat days projected 7→18/yr by 2055 (HVAC capex compounding) — expect insurance premiums to compound above CPI over the hold.
Questions for the listing agent
- What do current leases actually rent for vs. the listed asking? Can we see a recent rent roll and the last 12 months of T-12 income?
- Built in 1979 — when were the roof, HVAC, electrical panel, plumbing, and water heater last replaced?
- Is there a deadline driving the sale (1031 exchange, divorce, estate, relocation)? That informs how much negotiation room exists.
- Schools are F-rated, which usually means shorter tenancies and higher turnover. Who's the typical renter profile here, and what's been the actual vacancy rate?
- Crime grade is D in this area — have there been break-ins, vandalism, or insurance claims at this property in the last 3 years? What carrier currently insures it and at what premium?
- The area grade is low — what's the realistic commute time and amenity access for the typical tenant pool here? Any planned neighborhood developments (good or bad) we should know about?
- What's the average days-on-market for RENTAL listings here right now (not sales)? A rising rental-DOM trend means longer vacancies and softer asking-rent achievability than the comps imply.
- What's the recent tenant-quality profile in this submarket — average credit score on applications, eviction rate, late-payment / NSF rate, and stable-employment percentage? A property-management company in the area should have these aggregated.
- How much new for-sale + rental construction is in the pipeline within 1–3 miles? Heavy new supply typically softens prices + rents 12–24 months out; constrained supply supports both.
Investment metrics
- 1% rule
- 0.75% ✗
- Cap rate
- 6.25%
- Cash-on-cash
- -0.15%
- DSCR
- 0.99
- GRM
- 11.2
CMA / ARV
- ARV (on-the-fly)
- $182,450
- Comps found
- 12
Show comp detail 12 sales within ~0.75 mi
| Address | Dist | Beds/Ba | Sqft | Sold | Price | $/sf | Match |
|---|---|---|---|---|---|---|---|
| 7 Princeton Dr | 0.28mi | 3/1.5 | 1,030 (+0%) | 9mo | $181,891 | $177 | 79 |
| 5 Oxford Dr | 0.20mi | 3/1.5 | 1,040 (+2%) | 12mo | $203,000 | $195 | 78 |
| 310 Sterling Rd | 0.50mi | 3/1.5 | 1,026 (+0%) | 3mo | $160,000 | $156 | 74 |
| 117 Sheffield Rd | 0.50mi | 3/2.0 | 1,025 (0%) | 2mo | $214,900 | $210 | 73 |
| 15 Oxford Dr | 0.27mi | 3/1.0 | 1,130 (+10%) | 2mo | $122,999 | $109 | 66 |
| 1027 Yukon Ct | 0.56mi | 3/1.5 | 1,044 (+2%) | 8mo | $213,000 | $204 | 64 |
| 103 Carolina Dr | 0.53mi | 3/1.5 | 1,025 (0%) | 17mo | $208,000 | $203 | 61 |
| 114 Oxford Dr | 0.47mi | 3/1.0 | 1,096 (+7%) | 19mo | $100,000 | $91 | 49 |
| 408 Sterling Rd | 0.65mi | 3/1.5 | 1,170 (+14%) | 4mo | $205,000 | $175 | 42 |
| 1032 Birchwood Ln | 0.54mi | 3/2.0 | 1,151 (+12%) | 13mo | $230,000 | $200 | 41 |
| 1037 Yukon Ct | 0.62mi | 2/1.0 (-1) | 902 (-12%) | 5mo | $137,500 | $152 | 40 |
| 605 Duke Ct | 0.74mi | 3/1.5 | 1,178 (+15%) | 16mo | $210,000 | $178 | 27 |
Match score weights: distance 35% · size 25% · config 20% · recency 20%. Top-matched comps best support the ARV.
Projected returns pro-forma
-3.0% appreciation · 3.86% rent growth · sell at horizon
- IRR
- -15.8%
- Equity multiple
- 0.43×
- Total profit
- $-36,317
- Equity at exit
- $34,219
- IRR
- -6.2%
- Equity multiple
- 0.59×
- Total profit
- $-26,498
- Equity at exit
- $19,843
Cash invested: $64,260 (down + closing). Projections, not guarantees.
Landlord ↔ Tenant lean methodology
- Overall (STATE)
- 85 Strongly Landlord-Friendly
- State North Carolina
- 85 Strongly Landlord-Friendly · R+3
- County
- — inherits STATE
- City
- — inherits STATE
ZIP-level market 28546
- Home prices YoY
- -19.3%
- Rents YoY
- 3.9%
- Active inventory
- 604
- Price-to-rent
- 11.2×
Monthly cashflow live
- Estimated rent
- $1,712 medium interval (Pro) →
- Mortgage (P&I)
- −$1,204
- Tax from tax record
- −$61 /mo · $736/yr
- Insurance
- −$96
- HOA
- −$0
- Vacancy / Maint / Mgmt
- −$360
- Net cashflow
- $-8
Break-even live
Sensitivity live
| Price | -10% $122 | -5% $57 | +0% $-8 | +5% $-73 | +10% $-138 |
|---|---|---|---|---|---|
| Rent | -10% $-143 | -5% $-76 | +0% $-8 | +5% $60 | +10% $127 |
| Rate | -1.0pp $108 | -0.5pp $50 | base $-8 | +0.5pp $-67 | +1.0pp $-128 |
UW: 25.0% down · 7.5% · 30yr · 1.5% tax · 5.0% vac · 8.0% maint · 8.0% mgmt
Financing live
Cash to close
- Down payment
- $57,375
- Closing costs
- $6,885
- Reserves months
- —
- Total cash needed
- —
Loan-product check · same deal, 3 products live
Conventional
25% down · 7.5% · 30yr
- Down + closing
- —
- Monthly P&I
- —
- Monthly cashflow
- —
- DSCR
- —
- Eligible?
- —
Personal DTI + credit; lowest rate.
DSCR
20% down · 8.5% · 30yr
- Down + closing
- —
- Monthly P&I
- —
- Monthly cashflow
- —
- DSCR
- —
- Eligible?
- —
No personal income docs; deal must DSCR.
Hard money
10% down · 12.0% · 12mo
- Down + closing
- —
- Monthly P&I
- —
- Monthly cashflow
- —
- DSCR
- —
- Eligible?
- —
Short-term bridge; refi at stabilization.
Rent comps 4 comps
| Address | Beds | Baths | Sqft | Rent | $/sqft | DOM | Units | Dist |
|---|---|---|---|---|---|---|---|---|
| 122 Basswood Ct Jacksonville, NC | 3.0 | 1.0 | 1104 | $1,400 | $1.27 | 22d | 1 | 0.93mi |
| 108 White Stone Ct Jacksonville, NC | 4.0 | 2.0 | 1460 | $2,150 | $1.47 | 22d | 1 | 1.00mi |
| 110 Sycamore Dr Jacksonville, NC | 3.0 | 2.0 | 1433 | $1,750 | $1.22 | 22d | 1 | 1.14mi |
| 236 White Oak Blvd Jacksonville, NC | 3.0 | 2.0 | 1275 | $1,650 | $1.29 | 22d | 1 | 1.46mi |
Listing history 7 events
-
2026-06-19days on market $229,501 Active 7 DOM
-
2026-06-18days on market $229,501 Active 6 DOM
-
2026-06-17days on market $229,501 Active 5 DOM
-
2026-06-16days on market $229,501 Active 4 DOM
-
2026-06-15days on market $229,501 Active 3 DOM
-
2026-06-13remarks 656-char remark
-
2026-06-13$229,501 Active 1 DOM
ⓘ Source: listings_history table (triggers on properties + properties_extension) + one-shot
backfill from property_details.listing_events for pre-trigger history.
Tax reassessment forecast NC · Resets to sale price
- Current annual tax
- $736 · $61/mo
- Projected year-2 tax
- $1,882 · $157/mo
- Expected delta
- +$1,146/yr (+$95/mo · 155.7%)
ⓘ Screening estimate from a state-policy table — verify with the county assessor before closing.
Climate risk First Street
- Flood 1/10 Low FEMA zone X (unshaded) · 0% chance over 30 yrs
- Wildfire 3/10 Moderate
- Heat 8/10 Severe 7 d/yr ≥106°F today · 18 d/yr by 30 yrs out
- Wind 8/10 Severe 99% chance of damaging wind over 30 yrs
- Air quality 2/10 Low 1 unhealthy d/yr today · 3 by 30 yrs out
Nearby sold comps map
Loading sold comps map…
Walkable amenities ~0.75 mi
Loading nearby amenities…
Taxation est. · year 1
- Rental income
- $20,544
- − Mortgage interest
- −$12,856
- − Property taxes
- −$736
- − Insurance
- −$1,148
- − Repairs & maintenance
- −$1,644
- − Management
- −$1,644
- − Depreciation
- −$6,676
- Taxable loss
- −$4,158
- Est. tax savings @ 24.0%
- +$998
- After-tax cash flow
- $902/yr
For passive investors: Depreciation is non-cash, so a rental often shows a tax loss while cash-flowing — sheltering income. Rental losses are passive: they offset passive income freely, and up to $25,000/yr can offset ordinary (W-2) income if you actively participate and your MAGI is under $100k (phasing out to $0 by $150k); unused losses carry forward. On sale, claimed depreciation is recaptured at up to 25%, and gains may owe capital-gains tax (a 1031 exchange can defer both). Figures are a year-1 estimate at your 24.0% rate — not tax advice; consult a CPA.
Schools (NCES district)
- District
- Onslow County Schools
- NCES district ID
- 3703450
- Math proficiency
- 42% ▲ 6.00%
- Reading proficiency
- 49% ▲ 5.00%
- Median HH income
- $46,076
- Composite
- 38.66/100
- National rank
- #4148
- State rank
- #84 of 178 in NC
Livability — Piney Green
- Score
- 60/100
- State rank
- #524
- US rank
- #19401
Category grades
Schools grade is shown separately in the Schools card above.
Census & demographics
- Census place
- Piney Green, NC
- County
- Onslow County · 164,453 people
- Metro
- Jacksonville, NC
- Population (ZIP)
- 47,256
- Household income
- $63,561
- Rent vs Own
- Severe rent burden
- 1830.0
Population outlook (Onslow County) Hauer SSP2
- Today (2025)
- 189,789 people
- By 2030
- 194,463 · +2.5%
- By 2040
- 193,629 · +2.0%
- By 2050
- 193,248 · +1.8%
- By 2075
- 196,995 · +3.8%
- By 2100
- 201,513 · +6.2%
Race, ethnicity, and origin ACS 2023
- Neighborhood character
- Diverse neighborhood (Simpson 0.62)
- Race & ethnicity
- White 57% Black 18% Hispanic / Latino 16% Two or more races 13% Asian 2%
- Hispanic origin (detail)
- Mexican 5% Puerto Rican 5% Dominican 1%
- Common ancestry
- Romanian 1% Serbian 1% Slovak 1%
- Foreign-born
- 5% · Canada, South Korea
- Languages at home
- 89% English-only · Spanish 8% German/W. Germanic 1% Tagalog/Filipino 1%
Political lean MEDSL · Onslow
- 2024 margin
- Solid R (+35.9) · D 31.5% · R 67.5% · Other 1.0%
- 2008→2024 swing
- -14.5pp toward R · 2008: -21.5pp · 2024: -35.9pp
- All cycles
- 2024: R+35.9 2020: R+30.2 2016: R+34.6 2012: R+27.0 2008: R+21.5
Not yet ingested
- Civics
- —
Market trends
- HPI YoY
- ▼ -50.75%
- Current HPI
- 211.9993
- Rent YoY
- ▲ 3.86%
- Metro
- Jacksonville, NC
- State GDP YoY
- ▲ 3.28%
- F500 in state
- 26
Industry mix (Fortune 500 HQ in NC)
| Industry | F500 HQs | Revenue |
|---|---|---|
| Financial Services | 2 | $213B |
|
||
| Retail | 2 | $95B |
|
||
| Industrial Conglomerate | 1 | $38B |
|
||
| Metals / Steel | 1 | $35B |
|
||
| Utilities | 1 | $30B |
|
||
| Industrial Machinery | 1 | $19B |
|
||
Price history
+110.6% since first listed22 events — show timeline
- 2026-06-12 Listed $229,501 Hive MLS
- 2023-08-30 Sold (Public Records) $198,500 Public Records
- 2023-08-30 Sold (MLS) $198,500 Hive MLS
- 2023-07-20 Pending — Hive MLS
- 2023-07-17 Price Changed $205,000 Hive MLS
- 2023-06-30 Listed $207,000 Hive MLS
- 2023-04-25 Sold (MLS) $124,500 Hive MLS
- 2023-03-29 Pending — Hive MLS
- 2023-03-24 Pending — Hive MLS
- 2023-03-21 Relisted — Hive MLS
- 2023-03-13 Pending — Hive MLS
- 2023-03-07 Listed $99,500 Hive MLS
- 2019-02-28 Sold (Public Records) $114,500 Public Records
- 2019-02-28 Sold (MLS) $114,500 Hive MLS
- 2019-01-04 Listed $119,999 Hive MLS
- 2014-04-30 Listing Removed — Hive MLS
- 2013-08-23 Listed $119,900 Hive MLS
- 2013-05-28 Listing Removed — Hive MLS
- 2013-01-15 Listed $125,500 Hive MLS
- 2008-05-02 Sold (Public Records) $119,000 Public Records
- 2008-05-02 Sold (Public Records) $119,000 Public Records
- 2007-06-29 Sold (Public Records) $109,000 Public Records
Property tax history
+1.2%/yrLatest (2025): $736 · +0.0% YoY. Source: county tax records.
Cash-flow waterfall
monthlySold comps — $/sqft
last 12 mo · ≤1 miLoading sold comps…