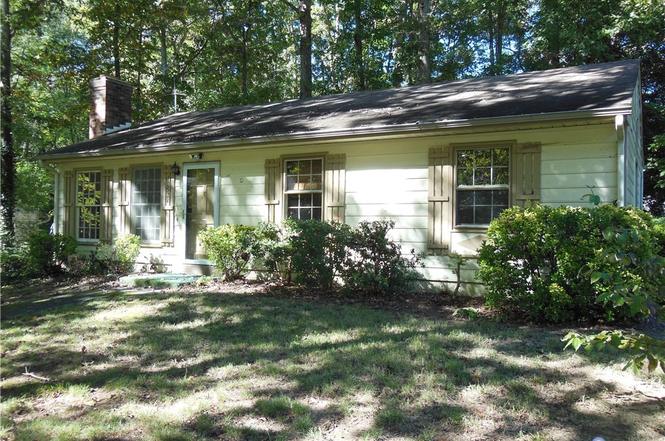
10524 Sunne Ct · Rockwood, VA
Flood risk 1/10 · Minimal
- FEMA flood zone
- X (unshaded)
- Chance of flooding over 30 yrs
- 0.0%
- Est. flood insurance / yr
- $507 – $1,088
Fire risk 2/10 · Minimal
- Est. fire insurance / yr
- $666 – $1,236
Heat risk 7/10 · Major
- Hot days now (above 105°F)
- 7 days/yr
- Hot days in 30 yrs
- 15 days/yr
Wind risk 6/10 · Moderate
- Chance of severe wind over 30 yrs
- 27.0%
Air-quality risk 2/10 · Minimal
- Unhealthy air days now
- 0 days/yr
- Unhealthy air days in 30 yrs
- 1 days/yr
Risk factors via First Street. Map © Google.
Why this score? — see what drove the C grade
The composite is a weighted blend of 9 inputs, each scored 0–100. Each bar is that input's sub-score; the figure is the points it added to the 100-point composite (weight × sub-score).
- Cash flow +16.8/30.0
- ARV discount +15.0/15.0
- DSCR +5.2/10.0
- Schools +5.2/10.0
- 1% rule +3.9/10.0
- Livability +3.9/5.0
- Rent growth +3.1/5.0
- Condition / age +2.5/5.0
- Appreciation +0.0/10.0
$234,900
🖨 Deal sheet 📄 Offer letter ✓ Due diligence
Listing remarks
Nice Price Adjustment to $234,900!!! It's never too late to own Real Estate. With some handy work and updating, you can turn this Ranch-style into a fantastic Starter Home for your family. Your Living Room is right at the entrance where you will greet and entertain your guests. The Eat-In Kitchen has loads of space and washer and dryer hook-ups. There are 3 Bedrooms and a Hall Bath with a Vanity and Tub. Nice wooded lot provides plenty of shade. This home is selling As Is. Schedule your tour today
Key facts
- Wooded lot
- Ranch-style
- Eat-in kitchen
Tags
Neighborhood map
What this means for you Summary
Snapshot
- This is a 3-bed/1.0-bath single-family listed at $235k.
Deal economics
- At list price, monthly cash flow is $149 ($2k/yr) — positive.
- The deal already cash-flows at list — no discount required.
- To meet the 1% rule (rent ≥ 1% of price), the offer needs to be $209k (10.8% below list).
- Recommended offer: $207k (12.0% below list) — sets the bar for market timing.
- Cap rate 7.1% vs local median 4.2% in Rockwood — top-decile yield for the area; either an underpriced asset or a hidden risk that comps aren't pricing in. Stress-test before assuming the spread holds.
Location & tenants
- Location reads 77/100 on livability (#86 in VA, #2,803 nationally) — a middle-class / working-renter tenant base. Strengths: housing A+, health & safety A+, schools A; Watch: amenities F, commute F.
- Chesterfield County Public School District (suburban): math 52% / reading 64% proficiency, ranked #57 of 131 in VA (top 44%) — acceptable for families but not a draw, mixed tenant base, ~2y average lease.
- Market conditions: Rents rising (+2.6%/yr); 363 active listings in the ZIP; 2 comparable units currently listed for rent nearby; high-income renter base; 2,307 units permitted in Chesterfield County in 2024 (462 in 5+ unit buildings).
Forward outlook
- Local home prices are declining (-3.0%/yr); year-one equity from $2k of loan paydown is wiped out by about $7k of value loss. Plan a longer hold.
- Chesterfield County population projected at +20% by 2050 — long-run rental-demand tailwind backs the buy-and-hold thesis.
Negotiation context
- It's been on market 147 days — a 12% lower offer ($207k) is reasonable based on typical stale-listing flexibility.
- Current owner paid $38k; list at $235k implies a 512% gain — meaningful room to come down on a strong offer.
Risks & watch-outs
- Climate carrying-cost: major wind risk, 27% chance of damaging wind over 30y; extreme-heat days projected 7→15/yr by 2055 (HVAC capex compounding) — expect insurance premiums to compound above CPI over the hold.
Questions for the listing agent
- It's been on market 147 days. Have you received any prior offers? Is the seller open to a 12% concession, seller financing, or rate buy-down credit?
- Built in 1979 — when were the roof, HVAC, electrical panel, plumbing, and water heater last replaced?
- Why hasn't it sold? Are there any deal-killer items the seller is aware of (foundation, flood, title, zoning, code violations)?
- Is there a deadline driving the sale (1031 exchange, divorce, estate, relocation)? That informs how much negotiation room exists.
- Schools are A-rated — typically a magnet for longer-tenancy family renters. What's the average tenant stay here, and is there a school-zone premium baked into asking?
- What's the average days-on-market for RENTAL listings here right now (not sales)? A rising rental-DOM trend means longer vacancies and softer asking-rent achievability than the comps imply.
- What's the recent tenant-quality profile in this submarket — average credit score on applications, eviction rate, late-payment / NSF rate, and stable-employment percentage? A property-management company in the area should have these aggregated.
- How much new for-sale + rental construction is in the pipeline within 1–3 miles? Heavy new supply typically softens prices + rents 12–24 months out; constrained supply supports both.
Investment metrics
- 1% rule
- 0.89% ✗
- Cap rate
- 7.05%
- Cash-on-cash
- 2.72%
- DSCR
- 1.12
- GRM
- 9.3
CMA / ARV
- ARV (on-the-fly)
- $291,200
- Comps found
- 12
Show comp detail 12 sales within ~0.75 mi
| Address | Dist | Beds/Ba | Sqft | Sold | Price | $/sf | Match |
|---|---|---|---|---|---|---|---|
| 10507 Sarata Ln | 0.09mi | 3/1.0 | 1,040 (0%) | 2mo | $297,500 | $286 | 94 |
| 5430 Solaris Dr | 0.13mi | 3/1.0 | 1,040 (0%) | 5mo | $296,500 | $285 | 90 |
| 5212 Rollingway Rd | 0.24mi | 3/1.0 | 1,040 (0%) | 5mo | $275,000 | $264 | 85 |
| 5112 Rollingway Rd | 0.33mi | 3/1.0 | 1,040 (0%) | 0mo | $291,000 | $280 | 84 |
| 5124 Rollingway Rd | 0.29mi | 3/1.0 | 1,040 (0%) | 4mo | $210,000 | $202 | 83 |
| 5213 Oakforest Dr | 0.27mi | 3/1.0 | 1,040 (0%) | 7mo | $290,000 | $279 | 82 |
| 10908 August Ct | 0.52mi | 3/1.0 | 1,040 (0%) | 1mo | $279,990 | $269 | 75 |
| 10905 August Ct | 0.48mi | 3/1.0 | 1,040 (0%) | 12mo | $245,000 | $236 | 67 |
| 5012 Alberta Rd | 0.57mi | 3/1.5 | 1,006 (-3%) | 1mo | $270,000 | $268 | 65 |
| 5041 Oakforest Dr | 0.47mi | 3/2.0 | 1,104 (+6%) | 11mo | $320,000 | $290 | 54 |
| 5037 Alberta Rd | 0.51mi | 3/1.0 | 960 (-8%) | 11mo | $281,000 | $293 | 54 |
| 10303 W Alberta Ct | 0.68mi | 3/1.0 | 960 (-8%) | 2mo | $285,000 | $297 | 54 |
Match score weights: distance 35% · size 25% · config 20% · recency 20%. Top-matched comps best support the ARV.
Projected returns pro-forma
-3.0% appreciation · 2.58% rent growth · sell at horizon
- IRR
- -12.5%
- Equity multiple
- 0.55×
- Total profit
- $-29,507
- Equity at exit
- $35,024
- IRR
- -4.0%
- Equity multiple
- 0.74×
- Total profit
- $-17,241
- Equity at exit
- $20,310
Cash invested: $65,772 (down + closing). Projections, not guarantees.
Landlord ↔ Tenant lean methodology
- Overall (STATE)
- 55 Moderately Landlord-Leaning
- State Virginia
- 55 Moderately Landlord-Leaning · D+2
- County
- — inherits STATE
- City
- — inherits STATE
ZIP-level market 23832
- Rents YoY
- 2.6%
- Active inventory
- 363
- Price-to-rent
- 9.3×
Monthly cashflow live
- Estimated rent
- $2,095 medium interval (Pro) →
- Mortgage (P&I)
- −$1,232
- Tax from tax record
- −$176 /mo · $2,117/yr
- Insurance
- −$98
- HOA
- −$0
- Vacancy / Maint / Mgmt
- −$440
- Net cashflow
- $149
Break-even live
UW: 25.0% down · 7.5% · 30yr · 1.5% tax · 5.0% vac · 8.0% maint · 8.0% mgmt
Financing live
Cash to close
- Down payment
- $58,725
- Closing costs
- $7,047
- Reserves months
- —
- Total cash needed
- —
Loan-product check · same deal, 3 products live
Conventional
25% down · 7.5% · 30yr
- Down + closing
- —
- Monthly P&I
- —
- Monthly cashflow
- —
- DSCR
- —
- Eligible?
- —
Personal DTI + credit; lowest rate.
DSCR
20% down · 8.5% · 30yr
- Down + closing
- —
- Monthly P&I
- —
- Monthly cashflow
- —
- DSCR
- —
- Eligible?
- —
No personal income docs; deal must DSCR.
Hard money
10% down · 12.0% · 12mo
- Down + closing
- —
- Monthly P&I
- —
- Monthly cashflow
- —
- DSCR
- —
- Eligible?
- —
Short-term bridge; refi at stabilization.
Rent comps 2 comps
| Address | Beds | Baths | Sqft | Rent | $/sqft | DOM | Units | Dist |
|---|---|---|---|---|---|---|---|---|
| 9906 Family Ln Chesterfield, VA | 3.0 | 1.0 | 1274 | $1,888 | $1.48 | 43d | 1 | 0.19mi |
| 4613 Bridgewood Rd Midlothian, VA | 3.0 | 1.0 | 1056 | $1,995 | $1.89 | 1d | 1 | 1.37mi |
Listing history 4 events
-
2026-03-14status Pending
-
2026-01-22price $234,900
-
2025-10-17$264,900 Active
-
1980-04-04soldstatus $38,385
ⓘ Source: listings_history table (triggers on properties + properties_extension) + one-shot
backfill from property_details.listing_events for pre-trigger history.
Tax reassessment forecast VA · Resets to sale price
- Current annual tax
- $2,117 · $176/mo
- Projected year-2 tax
- $2,117 · $176/mo
- Expected delta
- $0/yr ($0/mo · 0.0%)
ⓘ Screening estimate from a state-policy table — verify with the county assessor before closing.
Climate risk First Street
- Flood 1/10 Low FEMA zone X (unshaded) · 0% chance over 30 yrs
- Wildfire 2/10 Low
- Heat 7/10 Severe 7 d/yr ≥105°F today · 15 d/yr by 30 yrs out
- Wind 6/10 Major 27% chance of damaging wind over 30 yrs
- Air quality 2/10 Low 0 unhealthy d/yr today · 1 by 30 yrs out
Nearby sold comps map
Loading sold comps map…
Walkable amenities ~0.75 mi
Loading nearby amenities…
Taxation est. · year 1
- Rental income
- $25,139
- − Mortgage interest
- −$13,158
- − Property taxes
- −$2,117
- − Insurance
- −$1,174
- − Repairs & maintenance
- −$2,011
- − Management
- −$2,011
- − Depreciation
- −$6,833
- Taxable loss
- −$2,167
- Est. tax savings @ 24.0%
- +$520
- After-tax cash flow
- $2,306/yr
For passive investors: Depreciation is non-cash, so a rental often shows a tax loss while cash-flowing — sheltering income. Rental losses are passive: they offset passive income freely, and up to $25,000/yr can offset ordinary (W-2) income if you actively participate and your MAGI is under $100k (phasing out to $0 by $150k); unused losses carry forward. On sale, claimed depreciation is recaptured at up to 25%, and gains may owe capital-gains tax (a 1031 exchange can defer both). Figures are a year-1 estimate at your 24.0% rate — not tax advice; consult a CPA.
Schools (NCES district)
- District
- Chesterfield County Public School District
- NCES district ID
- 5100840
- Math proficiency
- 52% ▼ -30.00%
- Reading proficiency
- 64% ▼ -15.00%
- Median HH income
- $72,821
- Composite
- 51.56/100
- National rank
- #1712
- State rank
- #57 of 131 in VA
Livability — Rockwood
- Score
- 77/100
- State rank
- #86
- US rank
- #2803
Category grades
Schools grade is shown separately in the Schools card above.
Census & demographics
- County
- Chesterfield County · 406,988 people
- Metro
- Richmond, VA
- Population (ZIP)
- 41,442
- Household income
- $111,684
- Rent vs Own
- Severe rent burden
- 363.0
Population outlook (Chesterfield County) Hauer SSP2
- Today (2025)
- 377,190 people
- By 2030
- 395,710 · +4.9%
- By 2040
- 427,694 · +13.4%
- By 2050
- 452,706 · +20.0%
- By 2075
- 505,533 · +34.0%
- By 2100
- 521,282 · +38.2%
Race, ethnicity, and origin ACS 2023
- Neighborhood character
- Diverse neighborhood (Simpson 0.62)
- Race & ethnicity
- White 55% Black 25% Hispanic / Latino 10% Two or more races 9% Asian 4%
- Hispanic origin (detail)
- Mexican 2% Puerto Rican 1%
- Common ancestry
- Italian 2% Slovak 2% Romanian 2%
- Foreign-born
- 10% · Canada, Vietnam, South Korea
- Languages at home
- 84% English-only · Spanish 10% Other Indo-European 1% Tagalog/Filipino 1%
Political lean MEDSL · Chesterfield
- 2024 margin
- Lean D (+9.0) · D 53.8% · R 44.8% · Other 1.4%
- 2008→2024 swing
- +16.4pp toward D · 2008: -7.5pp · 2024: 9.0pp
- All cycles
- 2024: D+9.0 2020: D+6.7 2016: R+2.2 2012: R+7.1 2008: R+7.5
Not yet ingested
- Civics
- —
Market trends
- HPI YoY
- ▼ -262.03%
- Current HPI
- 267.8038
- Rent YoY
- ▲ 2.58%
- Metro
- Richmond, VA
- State GDP YoY
- ▲ 2.40%
- F500 in state
- 50
Industry mix (Fortune 500 HQ in VA)
| Industry | F500 HQs | Revenue |
|---|---|---|
| Aerospace / Defense | 4 | $236B |
|
||
| Technology / Defense | 3 | $32B |
|
||
| Financial Services | 2 | $176B |
|
||
| Utilities | 2 | $27B |
|
||
| Insurance | 2 | $25B |
|
||
| Technology | 2 | $15B |
|
||
Price history
+512.0% since first listed4 events — show timeline
- 2026-03-14 Pending — CVRMLS
- 2026-01-22 Price Changed $234,900 CVRMLS
- 2025-10-17 Listed $264,900 CVRMLS
- 1980-04-04 Sold (Public Records) $38,385 Public Records
Property tax history
+15.6%/yrLatest (2025): $2,117 · +8.8% YoY. Source: county tax records.
Cash-flow waterfall
monthlySold comps — $/sqft
last 12 mo · ≤1 miLoading sold comps…