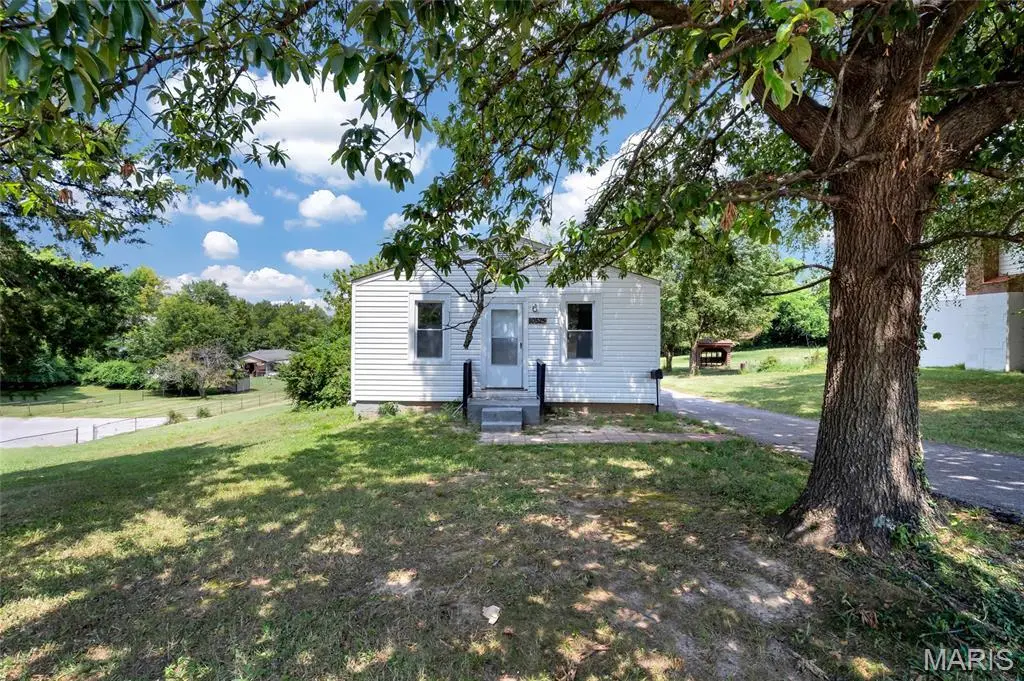
10525 Hobday Ave · St. Ann, MO
Flood risk 1/10 · Minimal
- FEMA flood zone
- X (unshaded)
- Chance of flooding over 30 yrs
- 0.0%
- Est. flood insurance / yr
- $473 – $860
Fire risk 1/10 · Minimal
- Est. fire insurance / yr
- $1,054 – $1,958
Heat risk 4/10 · Minor
- Hot days now (above 106°F)
- 7 days/yr
- Hot days in 30 yrs
- 20 days/yr
Wind risk 2/10 · Minimal
- Chance of severe wind over 30 yrs
- 1.0%
Air-quality risk 2/10 · Minimal
- Unhealthy air days now
- 1 days/yr
- Unhealthy air days in 30 yrs
- 3 days/yr
Risk factors via First Street. Map © Google.
Why this score? — see what drove the C+ grade
The composite is a weighted blend of 9 inputs, each scored 0–100. Each bar is that input's sub-score; the figure is the points it added to the 100-point composite (weight × sub-score).
- Cash flow +24.3/30.0
- ARV discount +15.0/15.0
- DSCR +7.8/10.0
- 1% rule +6.4/10.0
- Rent growth +3.5/5.0
- Livability +2.5/5.0
- Condition / age +2.5/5.0
- Schools +1.7/10.0
- Appreciation +0.0/10.0
$104,900
🖨 Deal sheet 📄 Offer letter ✓ Due diligence
Listing remarks
Welcome to 10525 Hobday in St. Ann! This lovely 1-bedroom, 1-bathroom home offers a cozy and functional layout perfect for a first-time buyer, downsizer, or investor. Inside, you’ll find a comfortable living space with a kitchen, dining area, and an unfinished basement with laundry hookup—ideal for extra storage or future finishing. Step outside to enjoy the spacious lot, complete with a mature shade tree in the front yard, creating a welcoming curb appeal and a great space for outdoor relaxation. Conveniently located near shopping, dining, parks, and highways, this home blends comfort and accessibility. Don’t miss your chance to make this affordable gem your own! Home bei
Key facts
- Mature shade tree
- Unfinished basement
- Spacious lot
Tags
Property features AI
Exterior
- Parking: Driveway and off-street parking
- Utilities: Public water; Public sewer; Electric service (other)
- Home design: Single-family residence; One level; House
- Construction: Vinyl siding
- Exterior features: Asphalt road frontage on a city street; Lot approximately 0.4568 acres; Frontage about 100 feet; Lot features: other
Interior
- Kitchen: Kitchen on the main level
- Bedrooms: 1 bedroom on the main level
- Bathrooms: 1 full bathroom on the main level
- Heating & cooling: Electric forced-air heating; Central air conditioning (electric)
- Interior features: Basement with walk-out access; Basement is full and unfinished; Smoke detector(s) installed
- Laundry & utility: Laundry located in the basement
Neighborhood map
What this means for you Summary
Snapshot
- This is a 1-bed/1.0-bath single-family listed at $105k.
Deal economics
- At list price, monthly cash flow is $211 ($3k/yr) — positive.
- The deal already cash-flows at list — no discount required.
- Meets the 1% rule at list price ($1k rent vs $105k).
- Cap rate 8.7% vs local median 6.5% in St. Ann — top-decile yield for the area; either an underpriced asset or a hidden risk that comps aren't pricing in. Stress-test before assuming the spread holds.
Location & tenants
- Location reads: area grade C — affects rentability + tenant quality, not the cash-flow math above.
- Ritenour (suburban): math 13% / reading 27% proficiency, ranked #304 of 324 in MO (top 94%) — low school quality limits family demand, transient renter base, plan for 1-2y turnover; 66% free/reduced lunch — lower-income household profile, screen leases tightly.
- Zoned schools: Buder Elem. (math 17% / reading 22%, grade F, #941 of 1,115 statewide, top 86%, 406 students, 99% FRL); Ritenour Sr. High (math 9% / reading 36%, grade F, #455 of 521 statewide, top 88%, 1,873 students, 100% FRL) — zoned schools average 100% FRL vs 66% district-wide (34 pts higher); higher-poverty schools than district average — tighter screening recommended.
- Market conditions: Rents rising fast (+4.1%/yr); 61 active listings in the ZIP; 18 comparable units currently listed for rent nearby; rentals lingering (median 44d on market — plan ~5-8 weeks vacancy on turnover, expect pricing pressure); 50% of comp listings sitting > 30 days — soft ceiling on asking rent; 920 units permitted in St. Louis County in 2024 (250 in 5+ unit buildings).
Forward outlook
- Local home prices are declining (-3.0%/yr); year-one equity from $725 of loan paydown is wiped out by about $3k of value loss. Plan a longer hold.
Negotiation context
- Only 14 days on market — expect competitive offers; lowballing is unlikely to land.
- 5 sale attempts since 3y ago with the ask held roughly flat each time — persistent listings suggest the price (not the market) is what's stuck; bring a comps-based counter.
Risks & watch-outs
- Watch-outs: built in 1925 — expect roof / HVAC / electrical / plumbing capex.
Questions for the listing agent
- Built in 1925 — when were the roof, HVAC, electrical panel, plumbing, and water heater last replaced?
- Is there a deadline driving the sale (1031 exchange, divorce, estate, relocation)? That informs how much negotiation room exists.
- What's the average days-on-market for RENTAL listings here right now (not sales)? A rising rental-DOM trend means longer vacancies and softer asking-rent achievability than the comps imply.
- What's the recent tenant-quality profile in this submarket — average credit score on applications, eviction rate, late-payment / NSF rate, and stable-employment percentage? A property-management company in the area should have these aggregated.
- How much new for-sale + rental construction is in the pipeline within 1–3 miles? Heavy new supply typically softens prices + rents 12–24 months out; constrained supply supports both.
Investment metrics
- 1% rule
- 1.14% ✓
- Cap rate
- 8.71%
- Cash-on-cash
- 8.62%
- DSCR
- 1.38
- GRM
- 7.3
CMA / ARV
- ARV (on-the-fly)
- $150,528
- Comps found
- 12
Show comp detail 12 sales within ~0.75 mi
| Address | Dist | Beds/Ba | Sqft | Sold | Price | $/sf | Match |
|---|---|---|---|---|---|---|---|
| 3134 O Hare Dr | 0.15mi | 2/1.0 (+1) | 784 (+2%) | 6mo | $154,900 | $198 | 79 |
| 10262 Breckenridge Rd | 0.34mi | 2/1.0 (+1) | 792 (+3%) | 2mo | $99,900 | $126 | 72 |
| 10512 Saint Francis Ln | 0.38mi | 2/1.0 (+1) | 792 (+3%) | 1mo | $149,900 | $189 | 71 |
| 10651 Thorpe Ave | 0.60mi | 2/1.0 (+1) | 768 (0%) | 1mo | $124,900 | $163 | 66 |
| 10300 Breckenridge Rd | 0.29mi | 2/1.0 (+1) | 816 (+6%) | 7mo | $155,000 | $190 | 65 |
| 3113 Pearl Harbor Dr | 0.31mi | 2/1.5 (+1) | 807 (+5%) | 7mo | $169,900 | $211 | 64 |
| 3438 Ashby Rd | 0.50mi | 2/1.0 (+1) | 816 (+6%) | 1mo | $159,900 | $196 | 60 |
| 10764 Saint Dismas Ct | 0.51mi | 2/1.5 (+1) | 792 (+3%) | 6mo | $115,000 | $145 | 59 |
| 3446 Saint Clovis Ln | 0.54mi | 2/1.0 (+1) | 816 (+6%) | 8mo | $160,000 | $196 | 53 |
| 10563 Decker Ave | 0.48mi | 2/2.0 (+1) | 700 (-9%) | 3mo | $155,000 | $221 | 52 |
| 3529 Saint Joachim Ln | 0.72mi | 2/1.0 (+1) | 682 (-11%) | 6mo | $109,900 | $161 | 38 |
| 10107 Saint Katherine Ln | 0.64mi | 2/1.0 (+1) | 864 (+12%) | 8mo | $169,900 | $197 | 38 |
Match score weights: distance 35% · size 25% · config 20% · recency 20%. Top-matched comps best support the ARV.
Projected returns pro-forma
-3.0% appreciation · 4.14% rent growth · sell at horizon
- IRR
- -1.9%
- Equity multiple
- 0.93×
- Total profit
- $-2,135
- Equity at exit
- $15,641
- IRR
- 9.0%
- Equity multiple
- 1.73×
- Total profit
- $21,406
- Equity at exit
- $9,070
Cash invested: $29,372 (down + closing). Projections, not guarantees.
Landlord ↔ Tenant lean methodology
- Overall (STATE)
- 81 Strongly Landlord-Friendly
- State Missouri
- 81 Strongly Landlord-Friendly · R+10
- County
- — inherits STATE
- City
- — inherits STATE
ZIP-level market 63074
- Rents YoY
- 4.1%
- Active inventory
- 61
- Price-to-rent
- 7.3×
Monthly cashflow live
- Estimated rent
- $1,200 high interval (Pro) →
- Mortgage (P&I)
- −$550
- Tax from tax record
- −$143 /mo · $1,720/yr
- Insurance
- −$44
- HOA
- −$0
- Vacancy / Maint / Mgmt
- −$252
- Net cashflow
- $211
Break-even live
UW: 25.0% down · 7.5% · 30yr · 1.5% tax · 5.0% vac · 8.0% maint · 8.0% mgmt
Financing live
Cash to close
- Down payment
- $26,225
- Closing costs
- $3,147
- Reserves months
- —
- Total cash needed
- —
Loan-product check · same deal, 3 products live
Conventional
25% down · 7.5% · 30yr
- Down + closing
- —
- Monthly P&I
- —
- Monthly cashflow
- —
- DSCR
- —
- Eligible?
- —
Personal DTI + credit; lowest rate.
DSCR
20% down · 8.5% · 30yr
- Down + closing
- —
- Monthly P&I
- —
- Monthly cashflow
- —
- DSCR
- —
- Eligible?
- —
No personal income docs; deal must DSCR.
Hard money
10% down · 12.0% · 12mo
- Down + closing
- —
- Monthly P&I
- —
- Monthly cashflow
- —
- DSCR
- —
- Eligible?
- —
Short-term bridge; refi at stabilization.
Rent comps 18 comps
| Address | Beds | Baths | Sqft | Rent | $/sqft | DOM | Units | Dist |
|---|---|---|---|---|---|---|---|---|
| 10205 Saint Daniel Ln Saint Ann, MO | 2.0 | 1.0 | 792 | $1,450 | $1.83 | 43d | 1 | 0.45mi |
| 10214 Saint Anthony Ln Saint Ann, MO | 2.0 | 1.0 | 734 | $1,200 | $1.63 | 43d | 1 | 0.59mi |
| 3529 Saint Joachim Ln Saint Ann, MO | 2.0 | 1.0 | 900 | $1,450 | $1.61 | 23d | 1 | 0.74mi |
| 3529 Saint Joachim Ln Unit NA St Ann, MO | 2.0 | 1.0 | 900 | $1,450 | $1.61 | 20d | 1 | 0.74mi |
| 11120 Graben Dr St Ann, MO | 1.0–2.0 | 1.0–1.5 | 850 | $1,050 | $1.24 | 1d | 14 | 0.96mi |
| 9618 De Porres Ln Saint Louis, MO | 2.0 | 1.0 | 875 | $1,200 | $1.37 | 43d | 1 | 1.04mi |
| 3219 Royalton Ave Saint Louis, MO | 2.0 | 1.0 | 792 | $1,095 | $1.38 | 21d | 1 | 1.06mi |
| 3209 Royalton Ave Saint Louis, MO | 2.0 | 1.0 | 805 | $1,150 | $1.43 | 43d | 1 | 1.07mi |
| 10069 Livingston Ave St Ann, MO | 2.0 | 1.0 | 875 | $1,100 | $1.26 | 23d | 1 | 1.25mi |
| 9535 Baltimore Ave Saint Louis, MO | 2.0 | 1.0 | 800 | $1,145 | $1.43 | 23d | 1 | 1.32mi |
| 9675 Muriel Ave Unit 9733 Overland, MO | 2.0 | 1.5 | 830 | $1,200 | $1.45 | 2d | 1 | 1.32mi |
| 9675 Muriel Ave Unit 9627 Overland, MO | 2.0 | 1.5 | 830 | $1,200 | $1.45 | 43d | 1 | 1.32mi |
| 2732 Annapolis Ave Saint Louis, MO | 2.0 | 1.0 | 768 | $1,250 | $1.63 | 43d | 1 | 1.38mi |
| 3961 Jane Ave Unit 3963 St Ann, MO | 2.0 | 1.0 | 750 | $1,195 | $1.59 | 14d | 1 | 1.39mi |
| 3208 Dix Ave Saint Louis, MO | 2.0 | 1.0 | 656 | $1,235 | $1.88 | 10d | 1 | 1.42mi |
| 10788 Tropic Dr Saint Ann, MO | 2.0 | 1.0 | 828 | $1,260 | $1.52 | 43d | 1 | 1.43mi |
| 10742 Tropic Dr Unit VACANT St Ann, MO | 2.0 | 1.0 | 800 | $1,200 | $1.50 | 43d | 1 | 1.43mi |
| 3648 Edmundson Rd Unit 1 St. Louis, MO | 2.0 | 1.0 | 900 | $995 | $1.11 | 43d | 1 | 1.50mi |
Listing history 9 events
-
2026-06-18days on market $104,900 Active 14 DOM
-
2026-06-17days on market $104,900 Active 13 DOM
-
2026-06-16days on market $104,900 Active 12 DOM
-
2026-06-15days on market $104,900 Active 11 DOM
-
2026-06-13days on market $104,900 Active 9 DOM
-
2026-06-09days on market $104,900 Active 5 DOM
-
2026-06-08days on market $104,900 Active 4 DOM
-
2026-06-07remarks 681-char remark
-
2026-06-07$104,900 Active 3 DOM
ⓘ Source: listings_history table (triggers on properties + properties_extension) + one-shot
backfill from property_details.listing_events for pre-trigger history.
Tax reassessment forecast MO · Resets to sale price
- Current annual tax
- $1,720 · $143/mo
- Projected year-2 tax
- $1,720 · $143/mo
- Expected delta
- $0/yr ($0/mo · 0.0%)
ⓘ Screening estimate from a state-policy table — verify with the county assessor before closing.
Climate risk First Street
- Flood 1/10 Low FEMA zone X (unshaded) · 0% chance over 30 yrs
- Wildfire 1/10 Low
- Heat 4/10 Moderate 7 d/yr ≥106°F today · 20 d/yr by 30 yrs out
- Wind 2/10 Low 100% chance of damaging wind over 30 yrs
- Air quality 2/10 Low 1 unhealthy d/yr today · 3 by 30 yrs out
Nearby sold comps map
Loading sold comps map…
Walkable amenities ~0.75 mi
Loading nearby amenities…
Taxation est. · year 1
- Rental income
- $14,404
- − Mortgage interest
- −$5,876
- − Property taxes
- −$1,720
- − Insurance
- −$524
- − Repairs & maintenance
- −$1,152
- − Management
- −$1,152
- − Depreciation
- −$3,052
- Taxable income
- $927
- Est. tax owed @ 24.0%
- −$222
- After-tax cash flow
- $2,311/yr
For passive investors: Depreciation is non-cash, so a rental often shows a tax loss while cash-flowing — sheltering income. Rental losses are passive: they offset passive income freely, and up to $25,000/yr can offset ordinary (W-2) income if you actively participate and your MAGI is under $100k (phasing out to $0 by $150k); unused losses carry forward. On sale, claimed depreciation is recaptured at up to 25%, and gains may owe capital-gains tax (a 1031 exchange can defer both). Figures are a year-1 estimate at your 24.0% rate — not tax advice; consult a CPA.
Schools (NCES district)
- District
- Ritenour
- NCES district ID
- 2926640
- Math proficiency
- 13% ▼ -14.00%
- Reading proficiency
- 27% ▼ -7.00%
- Median HH income
- $41,410
- Composite
- 17.04/100
- National rank
- #9125
- State rank
- #304 of 324 in MO
Livability — St. Ann
No livability data for this city. (Only ~50 U.S. cities are tracked.)
Census & demographics
- Census place
- St. Ann, MO
- County
- Saint Louis County · 888,823 people
- City population
- 16,237
- Metro
- St. Louis, MO-IL
- Population (ZIP)
- 15,793
- Household income
- $51,610
- Rent vs Own
- Severe rent burden
- 782.0
Population outlook (St. Louis County) Hauer SSP2
- Today (2025)
- 1,025,227 people
- By 2030
- 1,028,023 · +0.3%
- By 2040
- 1,020,940 · -0.4%
- By 2050
- 1,007,280 · -1.8%
- By 2075
- 987,277 · -3.7%
- By 2100
- 921,984 · -10.1%
Race, ethnicity, and origin ACS 2023
- Neighborhood character
- Diverse neighborhood (Simpson 0.65)
- Race & ethnicity
- White 50% Black 27% Hispanic / Latino 19% Two or more races 5% Asian 2%
- Hispanic origin (detail)
- Mexican 16%
- Common ancestry
- Lithuanian 2% Italian 1% Romanian 1%
- Foreign-born
- 13% · Canada, China
- Languages at home
- 80% English-only · Spanish 17% Chinese 1% German/W. Germanic 1%
Political lean MEDSL · St. Louis
- 2024 margin
- Strong D (+23.4) · D 60.8% · R 37.4% · Other 1.7%
- 2008→2024 swing
- +3.5pp toward D · 2008: 19.9pp · 2024: 23.4pp
- All cycles
- 2024: D+23.4 2020: D+24.0 2016: D+16.2 2012: D+13.7 2008: D+19.9
Not yet ingested
- Civics
- —
Market trends
- HPI YoY
- ▼ -242.89%
- Current HPI
- 210.6588
- Rent YoY
- ▲ 4.14%
- Metro
- St. Louis, MO-IL
- State GDP YoY
- ▲ 1.84%
- F500 in state
- 20
Industry mix (Fortune 500 HQ in MO)
| Industry | F500 HQs | Revenue |
|---|---|---|
| Healthcare | 1 | $163B |
|
||
| Insurance | 1 | $21B |
|
||
| Industrial Technology | 1 | $17B |
|
||
| Retail | 1 | $16B |
|
||
| Industrial Distribution | 1 | $10B |
|
||
| Utilities | 1 | $9B |
|
||
Price history
+101.7% since first listed17 events — show timeline
- 2026-06-04 Listed $104,900 MARIS as Distributed by MLS Grid
- 2025-12-30 Price Changed $104,900 MARIS as Distributed by MLS Grid
- 2025-10-21 Price Changed $110,000 MARIS as Distributed by MLS Grid
- 2025-09-12 Price Changed $120,000 MARIS as Distributed by MLS Grid
- 2025-08-19 Listed $130,000 MARIS as Distributed by MLS Grid
- 2024-11-23 Delisted — MARIS as Distributed by MLS Grid
- 2024-09-23 Listed $125,000 MARIS as Distributed by MLS Grid
- 2024-04-16 Delisted — MARIS as Distributed by MLS Grid
- 2024-04-10 Price Changed $115,000 MARIS as Distributed by MLS Grid
- 2024-03-11 Price Changed $125,000 MARIS as Distributed by MLS Grid
- 2024-03-01 Listed $135,000 MARIS as Distributed by MLS Grid
- 2024-02-29 Price Changed $135,000 MARIS as Distributed by MLS Grid
- 2024-02-29 Coming Soon — MARIS as Distributed by MLS Grid
- 2023-10-23 Pending — MARIS as Distributed by MLS Grid
- 2023-10-20 Sold (MLS) — MARIS as Distributed by MLS Grid
- 2023-09-29 Contingent — MARIS as Distributed by MLS Grid
- 2023-09-13 Listed $52,000 MARIS as Distributed by MLS Grid
Property tax history
+1.7%/yrLatest (2022): $1,720 · +0.2% YoY. Source: county tax records.
Cash-flow waterfall
monthlySold comps — $/sqft
last 12 mo · ≤1 miLoading sold comps…