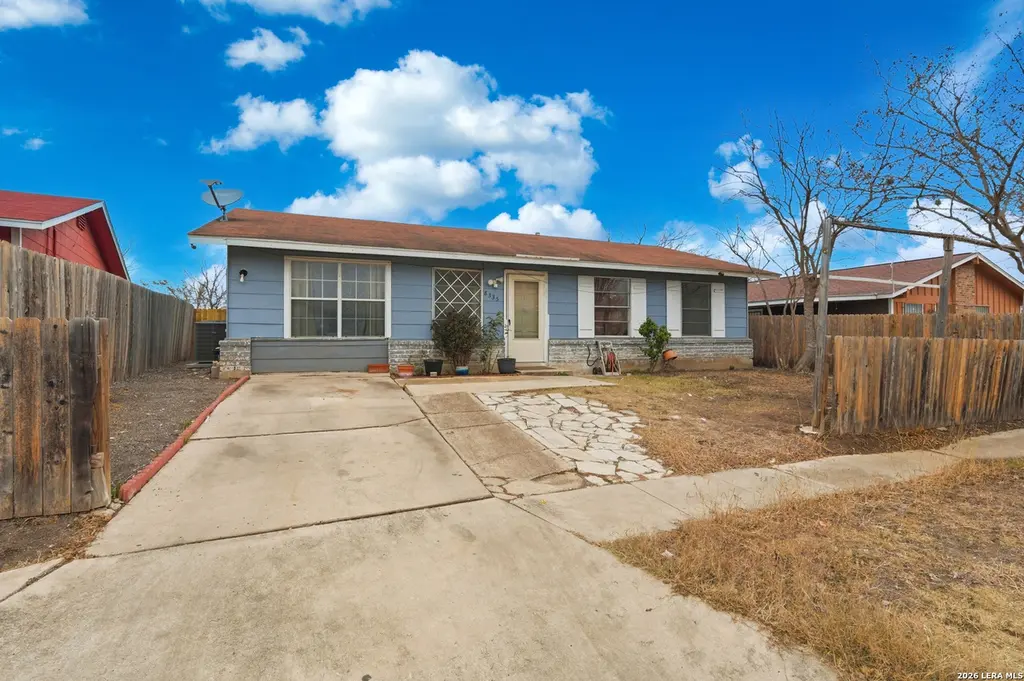
8335 Swift Eagle Dr · San Antonio, TX
Flood risk 1/10 · Minimal
- FEMA flood zone
- X (unshaded)
- Chance of flooding over 30 yrs
- 0.0%
- Est. flood insurance / yr
- $507 – $1,088
Fire risk 3/10 · Minor
- Est. fire insurance / yr
- $1,222 – $2,270
Heat risk 8/10 · Major
- Hot days now (above 109°F)
- 7 days/yr
- Hot days in 30 yrs
- 22 days/yr
Wind risk 8/10 · Major
- Chance of severe wind over 30 yrs
- 80.0%
Air-quality risk 2/10 · Minimal
- Unhealthy air days now
- 0 days/yr
- Unhealthy air days in 30 yrs
- 1 days/yr
Risk factors via First Street. Map © Google.
Why this score? — see what drove the D grade
The composite is a weighted blend of 9 inputs, each scored 0–100. Each bar is that input's sub-score; the figure is the points it added to the 100-point composite (weight × sub-score).
- Cash flow +14.7/30.0
- ARV discount +8.3/15.0
- 1% rule +5.2/10.0
- DSCR +4.5/10.0
- Livability +4.0/5.0
- Condition / age +2.5/5.0
- Rent growth +2.2/5.0
- Schools +2.2/10.0
- Appreciation +0.0/10.0
$155,000
🖨 Deal sheet (PDF) 📄 Offer letter ✓ Due diligence
Listing remarks MLS
Welcome to 8335 Swift Eagle, a well-located 3-bedroom, 1.5-bath home offering a functional layout and comfortable living spaces. Step outside to enjoy the covered back patio-perfect for relaxing or entertaining year-round. Conveniently situated near major highways, shopping, dining, and everyday essentials, with quick access to Lackland AFB. No HOA. Schedule your showing today!
Key facts
- Covered back patio
- 6,577 sq ft lot
- Built 1965
Tags
Neighborhood map
What this means for you Summary
Snapshot
- This is a 3-bed/1.5-bath single-family listed at $155k.
Deal economics
- At list price, monthly cash flow is $40 ($474/yr) — positive.
- The deal already cash-flows at list — no discount required.
- Meets the 1% rule at list price ($2k rent vs $155k).
- Recommended offer: $136k (12.0% below list) — sets the bar for market timing.
- Cap rate 6.6% vs local median 3.8% in San Antonio — top-decile yield for the area; either an underpriced asset or a hidden risk that comps aren't pricing in. Stress-test before assuming the spread holds.
Location & tenants
- Location reads 80/100 on livability (#31 in TX, #1,616 nationally) — a professional / high-income tenant draw. Strengths: amenities A+, commute A+, cost of living A+; Watch: crime F.
- Southwest ISD (rural): math 21% / reading 31% proficiency, ranked #701 of 826 in TX (top 85%) — low school quality limits family demand, transient renter base, plan for 1-2y turnover; 75% free/reduced lunch — lower-income household profile, screen leases tightly.
- Zoned schools: Indian Creek El (math 17% / reading 22%, grade F, #3,583 of 4,322 statewide, top 86%, 442 students, 95% FRL); Sharon Christa Mcauliffe Middle (math 12% / reading 24%, grade F, #1,491 of 1,662 statewide, top 91%, 677 students, 92% FRL); Southwest H S (math 17% / reading 39%, grade F, #1,170 of 1,632 statewide, top 72%, 2,152 students, 72% FRL).
- Market conditions: Rents soft (-1.3%/yr); 92 active listings in the ZIP; 34 comparable units currently listed for rent nearby; rentals at typical pace (median 17d on market — plan ~3-4 weeks tenant-placement turnaround); 8,308 units permitted in Bexar County in 2024 (2,506 in 5+ unit buildings).
- This rent runs 37% of the median local income ($51k/yr) — at the standard rent-burdened threshold; future hikes will face affordability resistance.
Forward outlook
- Local home prices are declining (-3.0%/yr); year-one equity from $1k of loan paydown is wiped out by about $5k of value loss. Plan a longer hold.
- Bexar County population projected at +50% by 2050 — long-run rental-demand tailwind backs the buy-and-hold thesis.
Negotiation context
- It's been on market 138 days — a 12% lower offer ($136k) is reasonable based on typical stale-listing flexibility.
- 6 sale attempts since 11y ago with the ask held roughly flat each time — persistent listings suggest the price (not the market) is what's stuck; bring a comps-based counter.
Risks & watch-outs
- Watch-outs: property tax is 2.5% of price.
- Climate carrying-cost: severe wind risk, 80% chance of damaging wind over 30y; extreme-heat days projected 7→22/yr by 2055 (HVAC capex compounding) — expect insurance premiums to compound above CPI over the hold.
Questions for the listing agent
- It's been on market 138 days. Have you received any prior offers? Is the seller open to a 12% concession, seller financing, or rate buy-down credit?
- Built in 1965 — when were the roof, HVAC, electrical panel, plumbing, and water heater last replaced?
- Property tax is high relative to price — has the assessment been appealed recently, and will the sale trigger a re-assessment?
- Why hasn't it sold? Are there any deal-killer items the seller is aware of (foundation, flood, title, zoning, code violations)?
- Is there a deadline driving the sale (1031 exchange, divorce, estate, relocation)? That informs how much negotiation room exists.
- Crime grade is F in this area — have there been break-ins, vandalism, or insurance claims at this property in the last 3 years? What carrier currently insures it and at what premium?
- The area grade is low — what's the realistic commute time and amenity access for the typical tenant pool here? Any planned neighborhood developments (good or bad) we should know about?
- What's the average days-on-market for RENTAL listings here right now (not sales)? A rising rental-DOM trend means longer vacancies and softer asking-rent achievability than the comps imply.
- What's the recent tenant-quality profile in this submarket — average credit score on applications, eviction rate, late-payment / NSF rate, and stable-employment percentage? A property-management company in the area should have these aggregated.
- How much new for-sale + rental construction is in the pipeline within 1–3 miles? Heavy new supply typically softens prices + rents 12–24 months out; constrained supply supports both.
Investment metrics
- 1% rule
- 1.02% ✓
- Cap rate
- 6.60%
- Cash-on-cash
- 1.09%
- DSCR
- 1.05
- GRM
- 8.2
CMA / ARV
- ARV (median comp)
- $157,860
- List price
- $155,000
- Delta
- -1.81%
- Verdict
- FAIR
- Comps
- 20 within 1.0 mi
Show comp detail 12 sales within ~0.75 mi
| Address | Dist | Beds/Ba | Sqft | Sold | Price | $/sf | Match |
|---|---|---|---|---|---|---|---|
| 8519 Rain Dance | 0.40mi | 3/1.0 | 1,173 (-0%) | 2mo | $165,000 | $141 | 77 |
| 5530 Prairie Flower | 0.33mi | 3/1.0 | 1,320 (+12%) | 2mo | $104,900 | $79 | 60 |
| 5643 Vista Pont | 0.74mi | 3/2.0 | 1,226 (+4%) | 0mo | $215,000 | $175 | 56 |
| 7502 Apple Vly | 0.70mi | 4/1.0 (+1) | 1,178 (+0%) | 7mo | $122,000 | $104 | 54 |
| 8756 Seven Seas | 0.71mi | 3/2.0 | 1,220 (+4%) | 7mo | $175,000 | $143 | 53 |
| 5762 Sunset Pt | 0.73mi | 3/2.0 | 1,226 (+4%) | 5mo | $223,750 | $183 | 53 |
| 5718 Sunset Pt | 0.71mi | 3/2.0 | 1,226 (+4%) | 7mo | $210,000 | $171 | 52 |
| 8603 Standing Rock St | 0.71mi | 4/2.0 (+1) | 1,260 (+7%) | 1mo | $170,000 | $135 | 47 |
| 5910 Fairgreen | 0.50mi | 2/2.0 (-1) | 1,024 (-13%) | 4mo | $99,950 | $98 | 45 |
| 8757 Port Of Call | 0.75mi | 3/1.0 | 1,048 (-11%) | 1mo | $145,000 | $138 | 44 |
| 6034 Pine Vly | 0.62mi | 3/1.0 | 1,008 (-14%) | 7mo | $137,000 | $136 | 40 |
| 8762 Port Of Call | 0.74mi | 3/2.0 | 1,345 (+14%) | 7mo | $198,500 | $148 | 34 |
Match score weights: distance 35% · size 25% · config 20% · recency 20%. Top-matched comps best support the ARV.
Projected returns pro-forma
-3.0% appreciation · 0.0% rent growth · sell at horizon
- IRR
- -18.3%
- Equity multiple
- 0.38×
- Total profit
- $-27,106
- Equity at exit
- $23,111
- IRR
- -19.2%
- Equity multiple
- 0.13×
- Total profit
- $-37,756
- Equity at exit
- $13,402
Cash invested: $43,400 (down + closing). Projections, not guarantees.
Landlord ↔ Tenant lean methodology
- Overall (STATE)
- 87 Strongly Landlord-Friendly
- State Texas
- 87 Strongly Landlord-Friendly · R+5
- County
- — inherits STATE
- City
- — inherits STATE
ZIP-level market 78242
- Home prices YoY
- -17.6%
- Rents YoY
- -1.3%
- Active inventory
- 92
- Price-to-rent
- 8.2×
Monthly cashflow live
- Estimated rent
- $1,573 high interval (Pro) →
- Mortgage (P&I)
- −$813
- Tax from tax record
- −$326 /mo · $3,913/yr
- Insurance
- −$65
- HOA
- −$0
- Vacancy / Maint / Mgmt
- −$330
- Net cashflow
- $40
Break-even live
Sensitivity live
| Price | -10% $127 | -5% $83 | +0% $40 | +5% $-4 | +10% $-48 |
|---|---|---|---|---|---|
| Rent | -10% $-85 | -5% $-23 | +0% $40 | +5% $102 | +10% $164 |
| Rate | -1.0pp $118 | -0.5pp $79 | base $40 | +0.5pp $-1 | +1.0pp $-42 |
UW: 25.0% down · 7.5% · 30yr · 1.5% tax · 5.0% vac · 8.0% maint · 8.0% mgmt
Financing live
Cash to close
- Down payment
- $38,750
- Closing costs
- $4,650
- Reserves months
- —
- Total cash needed
- —
Loan-product check · same deal, 3 products live
Conventional
25% down · 7.5% · 30yr
- Down + closing
- —
- Monthly P&I
- —
- Monthly cashflow
- —
- DSCR
- —
- Eligible?
- —
Personal DTI + credit; lowest rate.
DSCR
20% down · 8.5% · 30yr
- Down + closing
- —
- Monthly P&I
- —
- Monthly cashflow
- —
- DSCR
- —
- Eligible?
- —
No personal income docs; deal must DSCR.
Hard money
10% down · 12.0% · 12mo
- Down + closing
- —
- Monthly P&I
- —
- Monthly cashflow
- —
- DSCR
- —
- Eligible?
- —
Short-term bridge; refi at stabilization.
Rent comps 34 comps
| Address | Beds | Baths | Sqft | Rent | $/sqft | DOM | Units | Dist |
|---|---|---|---|---|---|---|---|---|
| 5523 Indian Desert St San Antonio, TX | 4.0 | 1.5 | 1192 | $1,325 | $1.11 | 19d | 1 | 0.29mi |
| 5507 Prairie Flower Dr San Antonio, TX | 3.0 | 2.0 | 1172 | $2,000 | $1.71 | 12d | 1 | 0.35mi |
| 5427 Indian Desert St San Antonio, TX | 3.0 | 2.0 | 888 | $1,195 | $1.35 | 24d | 1 | 0.36mi |
| 5542 Snow Fox St San Antonio, TX | 4.0 | 1.5 | 1280 | $1,900 | $1.48 | 45d | 1 | 0.45mi |
| 8905 Seacliff St San Antonio, TX | 3.0 | 2.5 | 1230 | $1,250 | $1.02 | 18d | 1 | 0.61mi |
| 5415 Ray Ellison Blvd San Antonio, TX | 1.0–2.0 | 1.0–2.0 | 878 | $1,240 | $1.41 | 6d | 24 | 0.66mi |
| 8619 Standing Rock St San Antonio, TX | 4.0 | 2.0 | 1176 | $1,420 | $1.21 | 6d | 1 | 0.73mi |
| 8722 Tesoro Hls San Antonio, TX | 3.0 | 1.5 | 1170 | $1,475 | $1.26 | 13d | 1 | 0.76mi |
| 7515 Holm Rd San Antonio, TX | 1.0–3.0 | 1.0–2.0 | 886 | $1,404 | $1.58 | 5d | 31 | 0.76mi |
| 5611 Elm Valley Dr San Antonio, TX | 3.0 | 2.0 | 1445 | $1,700 | $1.18 | 45d | 1 | 0.81mi |
| 9228 Balboa Port Dr San Antonio, TX | 3.0 | 2.0 | 1064 | $1,500 | $1.41 | 45d | 1 | 0.87mi |
| 5331 Beryl Cv San Antonio, TX | 3.0 | 2.0 | 1301 | $2,000 | $1.54 | 6d | 1 | 0.92mi |
| 6214 Slate Valley Dr San Antonio, TX | 3.0 | 1.0 | 920 | $1,050 | $1.14 | 0d | 1 | 0.98mi |
| 5806 Machaela Trce San Antonio, TX | 3.0 | 2.0 | 1322 | $1,497 | $1.13 | 0d | 1 | 0.99mi |
| 5810 Machaela Trce San Antonio, TX | 3.0 | 2.0 | 1444 | $1,800 | $1.25 | 0d | 1 | 0.99mi |
| 6943 Emerald Vly San Antonio, TX | 3.0 | 2.0 | 1341 | $1,650 | $1.23 | 16d | 1 | 1.01mi |
| 8715 Yellow Knife St San Antonio, TX | 3.0 | 2.0 | 900 | $1,125 | $1.25 | 26d | 1 | 1.03mi |
| 6243 Indian Valley Dr San Antonio, TX | 3.0 | 1.0 | 975 | $1,400 | $1.44 | 6d | 1 | 1.04mi |
| 7319 Walnut Valley Dr San Antonio, TX | 3.0 | 2.0 | 1152 | $1,900 | $1.65 | 14d | 1 | 1.09mi |
| 5510 Seahorse Dr San Antonio, TX | 3.0 | 1.5 | 1060 | $1,395 | $1.32 | 6d | 1 | 1.12mi |
| 5927 Mohave Vly San Antonio, TX | 3.0 | 2.0 | 1464 | $1,750 | $1.20 | 26d | 1 | 1.14mi |
| 8671 SW Loop 410 San Antonio, TX | 2.0–3.0 | 2.0 | 1024 | $1,405 | $1.37 | 18d | 7 | 1.19mi |
| 6619 Freedom Hls San Antonio, TX | 4.0 | 2.5 | 1410 | $1,900 | $1.35 | 4d | 1 | 1.24mi |
| 5938 Autumn Palms San Antonio, TX | 3.0 | 2.0 | 1350 | $2,400 | $1.78 | 0d | 1 | 1.25mi |
| 6627 Freedom Rnch San Antonio, TX | 3.0 | 2.0 | 1400 | $1,750 | $1.25 | 26d | 1 | 1.26mi |
| 7411 Hazel Cv San Antonio, TX | 3.0 | 2.0 | 1287 | $1,450 | $1.13 | 18d | 1 | 1.29mi |
| 6106 Cedar Valley Dr San Antonio, TX | 3.0 | 1.0 | 984 | $1,375 | $1.40 | 6d | 1 | 1.31mi |
| 6230 Hazel Valley St San Antonio, TX | 3.0 | 2.0 | 1344 | $1,650 | $1.23 | 24d | 1 | 1.32mi |
| 5619 Stonybrook Dr San Antonio, TX | 3.0 | 1.0 | 888 | $1,425 | $1.60 | 45d | 1 | 1.32mi |
| 9130 Excellence Dr San Antonio, TX | 1.0–4.0 | 1.0–2.0 | 990 | $1,374 | $1.39 | 18d | 1 | 1.33mi |
| 5547 Stonybrook Dr San Antonio, TX | 3.0 | 2.0 | 1014 | $1,395 | $1.38 | 0d | 1 | 1.33mi |
| 326 Whitewood Dr San Antonio, TX | 2.0 | 1.0 | 668 | $1,216 | $1.82 | 3d | 8 | 1.40mi |
| 6010 Ray Ellison Blvd San Antonio, TX | 1.0–3.0 | 1.0–2.0 | 974 | $1,418 | $1.46 | 45d | 1 | 1.43mi |
| 6802 Cougar Cv San Antonio, TX | 3.0 | 2.0 | 1251 | $1,550 | $1.24 | 45d | 1 | 1.50mi |
Listing history 37 events
-
2026-06-21days on market $155,000 Active 138 DOM
-
2026-06-18days on market $155,000 Active 135 DOM
-
2026-06-17days on market $155,000 Active 134 DOM
-
2026-06-16days on market $155,000 Active 133 DOM
-
2026-06-15days on market $155,000 Active 132 DOM
-
2026-06-13days on market $155,000 Active 130 DOM
-
2026-06-09days on market $155,000 Active 126 DOM
-
2026-06-08days on market $155,000 Active 125 DOM
-
2026-06-07days on market $155,000 Active 124 DOM
-
2026-06-04days on market $155,000 Active 121 DOM
-
2026-06-03days on market $155,000 Active 120 DOM
-
2026-06-02days on market $155,000 Active 119 DOM
-
2026-06-01days on market $155,000 Active 118 DOM
-
2026-05-31days on market $155,000 Active 117 DOM
-
2026-02-04price $155,000 380-char remark
Show marketing remark (380 chars)
Welcome to 8335 Swift Eagle, a well-located 3-bedroom, 1.5-bath home offering a functional layout and comfortable living spaces. Step outside to enjoy the covered back patio-perfect for relaxing or entertaining year-round. Conveniently situated near major highways, shopping, dining, and everyday essentials, with quick access to Lackland AFB. No HOA. Schedule your showing today!
-
2026-02-03$159,999 New 380-char remark
Show marketing remark (380 chars)
Welcome to 8335 Swift Eagle, a well-located 3-bedroom, 1.5-bath home offering a functional layout and comfortable living spaces. Step outside to enjoy the covered back patio-perfect for relaxing or entertaining year-round. Conveniently situated near major highways, shopping, dining, and everyday essentials, with quick access to Lackland AFB. No HOA. Schedule your showing today!
-
2025-12-31historical
-
2025-07-07status Back on Market
-
2025-05-31historical
-
2024-10-28status Back on Market
-
2024-09-30historical Active Option
-
2024-09-30historical
-
2024-08-29price $160,000
-
2024-06-04price $170,000
-
2024-04-30$180,000 New
-
2017-06-21soldstatus
-
2017-06-19soldstatus Sold
-
2017-05-25status Pending
-
2017-05-18historical Active Option
-
2017-05-14$83,500 New
-
2016-02-23soldstatus Sold
-
2016-02-05soldstatus
-
2016-01-12status Pending
-
2015-12-16historical Active Option
-
2015-10-16price $75,000
-
2015-08-08$83,500 New
-
1984-07-01soldstatus
ⓘ Source: listings_history table (triggers on properties + properties_extension) + one-shot
backfill from property_details.listing_events for pre-trigger history.
Tax reassessment forecast TX · Resets to sale price
- Current annual tax
- $3,913 · $326/mo
- Projected year-2 tax
- $3,913 · $326/mo
- Expected delta
- $0/yr ($0/mo · 0.0%)
ⓘ Screening estimate from a state-policy table — verify with the county assessor before closing.
Climate risk First Street
- Flood 1/10 Low FEMA zone X (unshaded) · 0% chance over 30 yrs
- Wildfire 3/10 Moderate
- Heat 8/10 Severe 7 d/yr ≥109°F today · 22 d/yr by 30 yrs out
- Wind 8/10 Severe 80% chance of damaging wind over 30 yrs
- Air quality 2/10 Low 0 unhealthy d/yr today · 1 by 30 yrs out
Nearby sold comps map
Loading sold comps map…
Walkable amenities ~0.75 mi
Loading nearby amenities…
Taxation est. · year 1
- Rental income
- $18,881
- − Mortgage interest
- −$8,682
- − Property taxes
- −$3,913
- − Insurance
- −$775
- − Repairs & maintenance
- −$1,510
- − Management
- −$1,510
- − Depreciation
- −$4,509
- Taxable loss
- −$2,019
- Est. tax savings @ 24.0%
- +$485
- After-tax cash flow
- $959/yr
For passive investors: Depreciation is non-cash, so a rental often shows a tax loss while cash-flowing — sheltering income. Rental losses are passive: they offset passive income freely, and up to $25,000/yr can offset ordinary (W-2) income if you actively participate and your MAGI is under $100k (phasing out to $0 by $150k); unused losses carry forward. On sale, claimed depreciation is recaptured at up to 25%, and gains may owe capital-gains tax (a 1031 exchange can defer both). Figures are a year-1 estimate at your 24.0% rate — not tax advice; consult a CPA.
Schools (NCES district)
- District
- Southwest ISD
- NCES district ID
- 4840950
- Math proficiency
- 21% ▼ -21.00%
- Reading proficiency
- 31% ▼ -5.00%
- Median HH income
- $43,362
- Composite
- 22.22/100
- National rank
- #8153
- State rank
- #701 of 826 in TX
Livability — San Antonio
- Score
- 80/100
- State rank
- #31
- US rank
- #1616
Category grades
Schools grade is shown separately in the Schools card above.
Census & demographics
- Census place
- San Antonio, TX
- County
- Bexar County · 1,990,555 people
- City population
- 1,806,925
- Metro
- San Antonio-New Braunfels, TX
- Population (ZIP)
- 36,168
- Household income
- $50,644
- Rent vs Own
- Severe rent burden
- 1778.0
Population outlook (Bexar County) Hauer SSP2
- Today (2025)
- 2,336,851 people
- By 2030
- 2,560,728 · +9.6%
- By 2040
- 3,020,569 · +29.3%
- By 2050
- 3,493,522 · +49.5%
- By 2075
- 4,668,459 · +99.8%
- By 2100
- 5,533,242 · +136.8%
Race, ethnicity, and origin ACS 2023
- Neighborhood character
- Predominantly Hispanic (86%)
- Race & ethnicity
- Hispanic / Latino 86% Two or more races 25% White 8% Black 3% Native American 2%
- Hispanic origin (detail)
- Mexican 67%
- Common ancestry
- Romanian 1% Italian 1%
- Foreign-born
- 20% · Canada
- Languages at home
- 43% English-only · Spanish 55%
Political lean MEDSL · Bexar
- 2024 margin
- Lean D (+9.8) · D 54.3% · R 44.6% · Other 1.1%
- 2008→2024 swing
- +4.2pp toward D · 2008: 5.6pp · 2024: 9.8pp
- All cycles
- 2024: D+9.8 2020: D+18.2 2016: D+13.5 2012: D+4.6 2008: D+5.6
Not yet ingested
- Civics
- —
Market trends
- HPI YoY
- ▼ -55.63%
- Current HPI
- 259.9788
- Rent YoY
- ▼ -1.32%
- Metro
- San Antonio-New Braunfels, TX
- State GDP YoY
- ▲ 3.95%
- F500 in state
- 110
Industry mix (Fortune 500 HQ in TX)
| Industry | F500 HQs | Revenue |
|---|---|---|
| Energy | 16 | $1,198B |
|
||
| Technology | 5 | $198B |
|
||
| Engineering / Construction | 4 | $72B |
|
||
| Energy Services | 3 | $60B |
|
||
| Utilities | 3 | $41B |
|
||
| Healthcare | 2 | $330B |
|
||
Price history
+85.6% since first listed23 events — show timeline
- 2026-02-04 Price Changed $155,000 LERA
- 2026-02-03 Listed $159,999 LERA
- 2025-12-31 Listing Removed — LERA
- 2025-07-07 Relisted — LERA
- 2025-05-31 Listing Removed — LERA
- 2024-10-28 Relisted — LERA
- 2024-09-30 Contingent — LERA
- 2024-09-30 Listing Removed — LERA
- 2024-08-29 Price Changed $160,000 LERA
- 2024-06-04 Price Changed $170,000 LERA
- 2024-04-30 Listed $180,000 LERA
- 2017-06-21 Sold (Public Records) — Public Records
- 2017-06-19 Sold (MLS) — LERA
- 2017-05-25 Pending — LERA
- 2017-05-18 Contingent — LERA
- 2017-05-14 Listed $83,500 LERA
- 2016-02-23 Sold (MLS) — LERA
- 2016-02-05 Sold (Public Records) — Public Records
- 2016-01-12 Pending — LERA
- 2015-12-16 Contingent — LERA
- 2015-10-16 Price Changed $75,000 LERA
- 2015-08-08 Listed $83,500 LERA
- 1984-07-01 Sold (Public Records) — Public Records
Property tax history
+9.8%/yrLatest (2025): $3,913 · -0.0% YoY. Source: county tax records.
Cash-flow waterfall
monthlySold comps — $/sqft
last 12 mo · ≤1 miLoading sold comps…