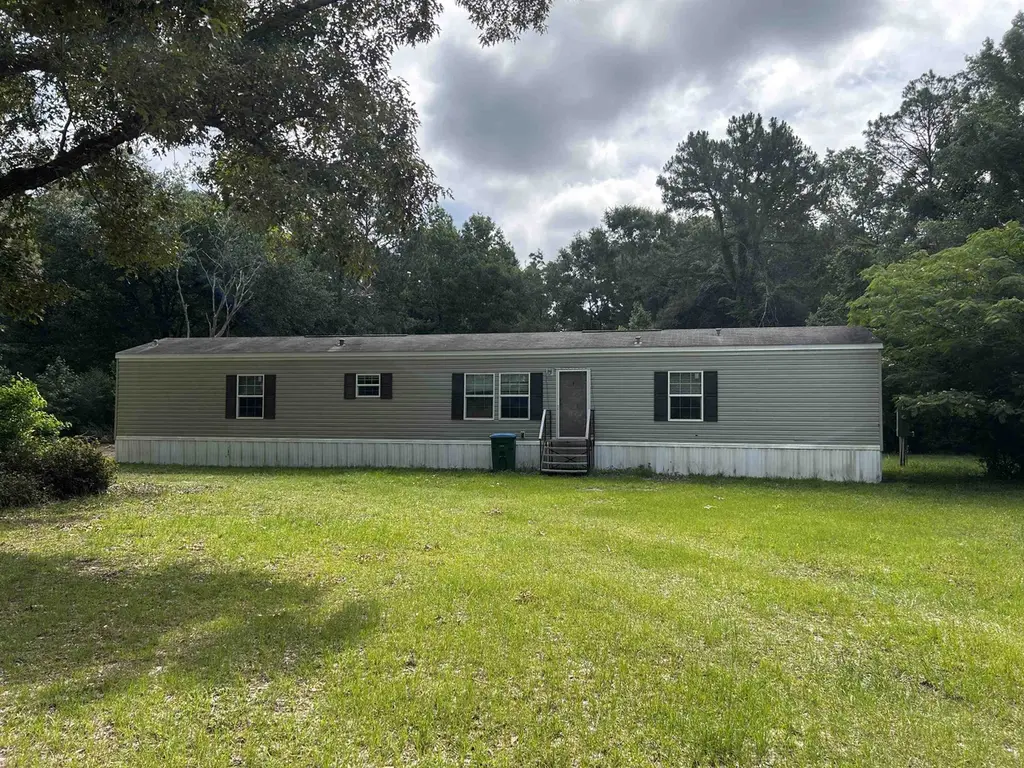
19 Centipede Dr · Crawfordville, FL
Flood risk 1/10 · Minimal
- FEMA flood zone
- X (unshaded)
- Chance of flooding over 30 yrs
- 0.0%
- Est. flood insurance / yr
- $507 – $1,088
Fire risk 6/10 · Moderate
- Est. fire insurance / yr
- $947 – $1,759
Heat risk 9/10 · Severe
- Hot days now (above 109°F)
- 7 days/yr
- Hot days in 30 yrs
- 20 days/yr
Wind risk 9/10 · Severe
- Chance of severe wind over 30 yrs
- 99.0%
Air-quality risk 4/10 · Minor
- Unhealthy air days now
- 4 days/yr
- Unhealthy air days in 30 yrs
- 4 days/yr
Risk factors via First Street. Map © Google.
Why this score? — see what drove the C- grade
The composite is a weighted blend of 9 inputs, each scored 0–100. Each bar is that input's sub-score; the figure is the points it added to the 100-point composite (weight × sub-score).
- Cash flow +17.6/30.0
- ARV discount +7.5/15.0
- DSCR +5.5/10.0
- Schools +4.8/10.0
- 1% rule +4.2/10.0
- Livability +3.9/5.0
- Rent growth +3.3/5.0
- Appreciation +2.7/10.0
- Condition / age +2.5/5.0
$189,000
🖨 Deal sheet 📄 Offer letter ✓ Due diligence
Listing remarks MLS
Split plan home on over 1 acre. Newer kitchen countertops in island kitchen. Home features tile showers and storage shed. All kitchen appliances included. Fireplace in family room. Double vanity and garden tub in masterbath. Don't wait. .. see it today.
Key facts
- Modern construction
- 1.62 acre lot
- Parking
Tags
Property features AI
Finance
- Other: Property listed for sale
- HOA & community: Association fee: $150
Exterior
- Parking: Driveway
- Utilities: Septic tank
- Home design: Single-story; Single wide mobile home
- Construction: Vinyl siding
- Exterior features: Deck; Public maintained road
Interior
- Kitchen: Refrigerator; Range; Oven; Microwave; Dishwasher
- Bedrooms: Bedroom 2 (11x8); Bedroom 3 (9x15)
- Flooring: Plank; Vinyl
- Bathrooms: 2 full bathrooms
- Heating & cooling: Central heating (electric); Central air (electric)
- Interior features: Split bedrooms; Walk-in closet(s)
- Laundry & utility: Washer; Dryer
Neighborhood map
What this means for you Summary
Snapshot
- This is a 3-bed/2.0-bath manufactured listed at $189k.
Deal economics
- At list price, monthly cash flow is $150 ($2k/yr) — positive.
- The deal already cash-flows at list — no discount required.
- To meet the 1% rule (rent ≥ 1% of price), the offer needs to be $174k (7.8% below list).
- Recommended offer: $174k (7.8% below list) — sets the bar for 1% rule.
- Cap rate 7.2% vs local median 4.3% in Crawfordville — top-decile yield for the area; either an underpriced asset or a hidden risk that comps aren't pricing in. Stress-test before assuming the spread holds.
Location & tenants
- Location reads 77/100 on livability (#187 in FL, #2,943 nationally) — a middle-class / working-renter tenant base. Strengths: crime A+, cost of living A+, housing A+; Watch: amenities F, commute F.
- Wakulla (rural): math 56% / reading 56% proficiency, ranked #18 of 73 in FL (top 25%) — acceptable for families but not a draw, mixed tenant base, ~2y average lease.
- Market conditions: Rents rising (+3.2%/yr); 346 active listings in the ZIP; solid renter incomes; 468 units permitted in Wakulla County in 2024 (0 in 5+ unit buildings).
Forward outlook
- Local home prices are declining (-3.0%/yr); year-one equity from $1k of loan paydown is wiped out by about $6k of value loss. Plan a longer hold.
Negotiation context
- It's been on market 29 days — a 2% lower offer ($186k) is reasonable based on typical stale-listing flexibility.
- 3 sale attempts since 16y ago with the ask held roughly flat each time — persistent listings suggest the price (not the market) is what's stuck; bring a comps-based counter.
- Current owner paid $43k; list at $189k implies a 340% gain — meaningful room to come down on a strong offer.
Risks & watch-outs
- Climate carrying-cost: severe wind risk, 99% chance of damaging wind over 30y; major wildfire risk; extreme-heat days projected 7→20/yr by 2055 (HVAC capex compounding) — expect insurance premiums to compound above CPI over the hold.
Questions for the listing agent
- What does the HOA fee cover, when was the last increase, and are there any pending special assessments or reserve-fund shortfalls?
- Is there a deadline driving the sale (1031 exchange, divorce, estate, relocation)? That informs how much negotiation room exists.
- Schools are B-rated — typically a magnet for longer-tenancy family renters. What's the average tenant stay here, and is there a school-zone premium baked into asking?
- What's the average days-on-market for RENTAL listings here right now (not sales)? A rising rental-DOM trend means longer vacancies and softer asking-rent achievability than the comps imply.
- What's the recent tenant-quality profile in this submarket — average credit score on applications, eviction rate, late-payment / NSF rate, and stable-employment percentage? A property-management company in the area should have these aggregated.
- How much new for-sale + rental construction is in the pipeline within 1–3 miles? Heavy new supply typically softens prices + rents 12–24 months out; constrained supply supports both.
Investment metrics
- 1% rule
- 0.92% ✗
- Cap rate
- 7.25%
- Cash-on-cash
- 3.41%
- DSCR
- 1.15
- GRM
- 9.0
CMA / ARV
No comps found within radius.
Projected returns pro-forma
-3.0% appreciation · 3.18% rent growth · sell at horizon
- IRR
- -10.8%
- Equity multiple
- 0.61×
- Total profit
- $-20,756
- Equity at exit
- $28,181
- IRR
- -1.2%
- Equity multiple
- 0.91×
- Total profit
- $-4,531
- Equity at exit
- $16,341
Cash invested: $52,920 (down + closing). Projections, not guarantees.
Landlord ↔ Tenant lean methodology
- Overall (STATE)
- 87 Strongly Landlord-Friendly
- State Florida
- 87 Strongly Landlord-Friendly · R+3
- County
- — inherits STATE
- City
- — inherits STATE
ZIP-level market 32327
- Home prices YoY
- -1.5%
- Rents YoY
- 3.2%
- Active inventory
- 346
- Price-to-rent
- 9.0×
Monthly cashflow live
- Estimated rent
- $1,743 medium interval (Pro) →
- Mortgage (P&I)
- −$991
- Tax from tax record
- −$144 /mo · $1,727/yr
- Insurance
- −$79
- HOA
- −$13
- Vacancy / Maint / Mgmt
- −$366
- Net cashflow
- $150
Break-even live
UW: 25.0% down · 7.5% · 30yr · 1.5% tax · 5.0% vac · 8.0% maint · 8.0% mgmt
Financing live
Cash to close
- Down payment
- $47,250
- Closing costs
- $5,670
- Reserves months
- —
- Total cash needed
- —
Loan-product check · same deal, 3 products live
Conventional
25% down · 7.5% · 30yr
- Down + closing
- —
- Monthly P&I
- —
- Monthly cashflow
- —
- DSCR
- —
- Eligible?
- —
Personal DTI + credit; lowest rate.
DSCR
20% down · 8.5% · 30yr
- Down + closing
- —
- Monthly P&I
- —
- Monthly cashflow
- —
- DSCR
- —
- Eligible?
- —
No personal income docs; deal must DSCR.
Hard money
10% down · 12.0% · 12mo
- Down + closing
- —
- Monthly P&I
- —
- Monthly cashflow
- —
- DSCR
- —
- Eligible?
- —
Short-term bridge; refi at stabilization.
HOA detail
- Monthly dues
- $13 · $156/yr
Listing history 22 events
-
2026-06-18days on market $189,000 Active 29 DOM
-
2026-06-17days on market $189,000 Active 28 DOM
-
2026-06-16days on market $189,000 Active 27 DOM
-
2026-06-15days on market $189,000 Active 26 DOM
-
2026-06-14days on market $189,000 Active 24 DOM
-
2026-06-10days on market $189,000 Active 21 DOM
-
2026-06-09days on market $189,000 Active 20 DOM
-
2026-06-08days on market $189,000 Active 19 DOM
-
2026-06-07days on market $189,000 Active 18 DOM
-
2026-06-05days on market $189,000 Active 15 DOM
-
2026-06-03days on market $189,000 Active 14 DOM
-
2026-06-02days on market $189,000 Active 13 DOM
-
2026-06-01days on market $189,000 Active 12 DOM
-
2026-05-31days on market $189,000 Active 11 DOM
-
2026-05-30days on market $189,000 Active 10 DOM
-
2026-05-20$189,000 Active
-
2011-04-18soldstatus $43,000 253-char remark
Show marketing remark (253 chars)
Split plan home on over 1 acre. Newer kitchen countertops in island kitchen. Home features tile showers and storage shed. All kitchen appliances included. Fireplace in family room. Double vanity and garden tub in masterbath. Don't wait. .. see it today.
-
2011-02-05$43,400 253-char remark
Show marketing remark (253 chars)
Split plan home on over 1 acre. Newer kitchen countertops in island kitchen. Home features tile showers and storage shed. All kitchen appliances included. Fireplace in family room. Double vanity and garden tub in masterbath. Don't wait. .. see it today.
-
2010-11-04historical
-
2010-04-23$63,200
-
2005-11-18soldstatus $125,000
-
2004-04-14soldstatus $51,900
ⓘ Source: listings_history table (triggers on properties + properties_extension) + one-shot
backfill from property_details.listing_events for pre-trigger history.
Tax reassessment forecast FL · Resets to sale price
- Current annual tax
- $1,727 · $144/mo
- Projected year-2 tax
- $1,727 · $144/mo
- Expected delta
- $0/yr ($0/mo · -0.0%)
ⓘ Screening estimate from a state-policy table — verify with the county assessor before closing.
Climate risk First Street
- Flood 1/10 Low FEMA zone X (unshaded) · 0% chance over 30 yrs
- Wildfire 6/10 Major
- Heat 9/10 Extreme 7 d/yr ≥109°F today · 20 d/yr by 30 yrs out
- Wind 9/10 Extreme 99% chance of damaging wind over 30 yrs
- Air quality 4/10 Moderate 4 unhealthy d/yr today · 4 by 30 yrs out
Nearby sold comps map
Loading sold comps map…
Walkable amenities ~0.75 mi
Loading nearby amenities…
Taxation est. · year 1
- Rental income
- $20,919
- − Mortgage interest
- −$10,587
- − Property taxes
- −$1,727
- − Insurance
- −$945
- − Repairs & maintenance
- −$1,674
- − Management
- −$1,674
- − HOA
- −$156
- − Depreciation
- −$5,498
- Taxable loss
- −$1,341
- Est. tax savings @ 24.0%
- +$322
- After-tax cash flow
- $2,126/yr
For passive investors: Depreciation is non-cash, so a rental often shows a tax loss while cash-flowing — sheltering income. Rental losses are passive: they offset passive income freely, and up to $25,000/yr can offset ordinary (W-2) income if you actively participate and your MAGI is under $100k (phasing out to $0 by $150k); unused losses carry forward. On sale, claimed depreciation is recaptured at up to 25%, and gains may owe capital-gains tax (a 1031 exchange can defer both). Figures are a year-1 estimate at your 24.0% rate — not tax advice; consult a CPA.
Schools (NCES district)
- District
- Wakulla
- NCES district ID
- 1201950
- Math proficiency
- 56% ▼ -7.00%
- Reading proficiency
- 56% ▼ -5.00%
- Median HH income
- $53,740
- Composite
- 48.12/100
- National rank
- #2183
- State rank
- #18 of 73 in FL
Livability — Crawfordville
- Score
- 77/100
- State rank
- #187
- US rank
- #2943
Category grades
Schools grade is shown separately in the Schools card above.
Census & demographics
- County
- Wakulla County · 31,445 people
- City population
- 31,445
- Metro
- Tallahassee, FL
- Population (ZIP)
- 31,445
- Household income
- $84,138
- Rent vs Own
- Severe rent burden
- 360.0
Population outlook (Wakulla County) Hauer SSP2
- Today (2025)
- 32,809 people
- By 2030
- 33,165 · +1.1%
- By 2040
- 33,245 · +1.3%
- By 2050
- 32,539 · -0.8%
- By 2075
- 29,676 · -9.5%
- By 2100
- 22,931 · -30.1%
Race, ethnicity, and origin ACS 2023
- Neighborhood character
- Predominantly White (75%)
- Race & ethnicity
- White 75% Black 15% Two or more races 6% Hispanic / Latino 5%
- Hispanic origin (detail)
- Mexican 1% Puerto Rican 1%
- Common ancestry
- Italian 5% Slovak 2% Serbian 2%
- Foreign-born
- 3% · Canada
- Languages at home
- 94% English-only · Spanish 3% Other Indo-European 1%
Political lean MEDSL · Wakulla
- 2024 margin
- Solid R (+44.4) · D 27.4% · R 71.8%
- 2008→2024 swing
- -19.5pp toward R · 2008: -24.8pp · 2024: -44.4pp
- All cycles
- 2024: R+44.4 2020: R+40.9 2016: R+40.1 2012: R+28.1 2008: R+24.8
Not yet ingested
- Civics
- —
Market trends
- HPI YoY
- ▼ -4.59%
- Current HPI
- 302.1883
- Rent YoY
- ▲ 3.18%
- Metro
- Tallahassee, FL
- State GDP YoY
- ▲ 3.28%
- F500 in state
- 36
Industry mix (Fortune 500 HQ in FL)
| Industry | F500 HQs | Revenue |
|---|---|---|
| Industrial Technology | 2 | $29B |
|
||
| Insurance | 2 | $17B |
|
||
| Retail | 1 | $60B |
|
||
| Technology Distribution | 1 | $58B |
|
||
| Homebuilding | 1 | $35B |
|
||
| Technology Manufacturing | 1 | $35B |
|
||
Price history
+264.2% since first listed7 events — show timeline
- 2026-05-20 Listed $189,000 CATRS
- 2011-04-18 Sold (MLS) $43,000 CATRS
- 2011-02-05 Listed $43,400 CATRS
- 2010-11-04 Listing Removed — CATRS
- 2010-04-23 Listed $63,200 CATRS
- 2005-11-18 Sold (Public Records) $125,000 Public Records
- 2004-04-14 Sold (Public Records) $51,900 Public Records
Property tax history
+14.8%/yrLatest (2025): $1,727 · +3.3% YoY. Source: county tax records.
Cash-flow waterfall
monthlySold comps — $/sqft
last 12 mo · ≤1 miLoading sold comps…