 🌊 Lakefront
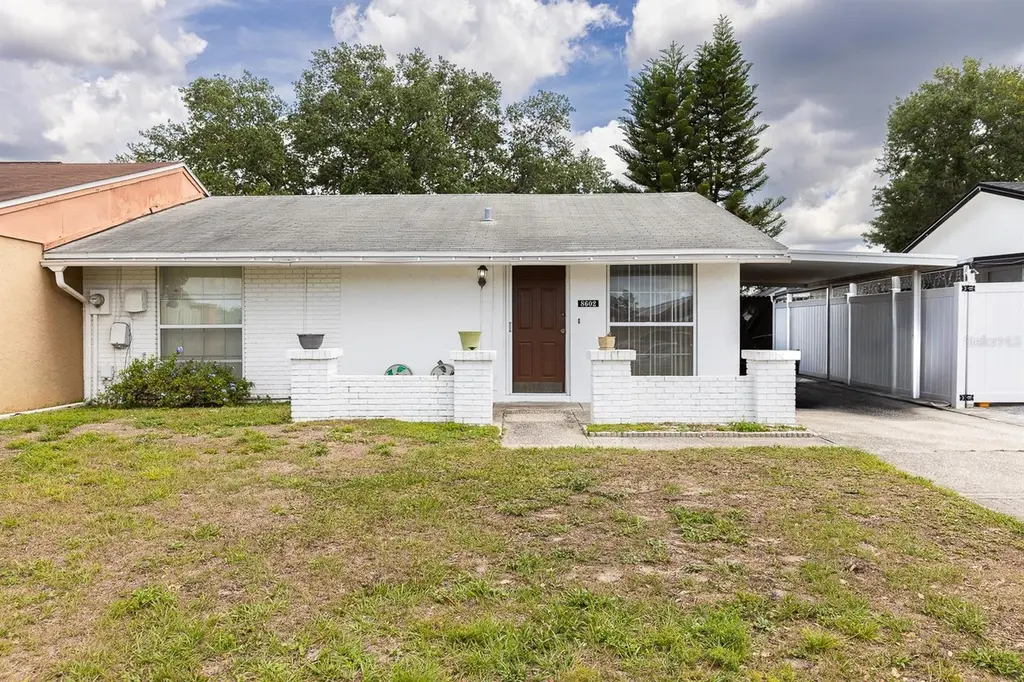
8602 Briar Grove Cir · Town 'n' Country, FL
Flood risk 6/10 · Moderate
- FEMA flood zone
- X (unshaded)
- Chance of flooding over 30 yrs
- 0.53%
- Est. flood insurance / yr
- $507 – $1,088
Fire risk 1/10 · Minimal
- Est. fire insurance / yr
- $947 – $1,759
Heat risk 10/10 · Severe
- Hot days now (above 107°F)
- 7 days/yr
- Hot days in 30 yrs
- 28 days/yr
Wind risk 9/10 · Severe
- Chance of severe wind over 30 yrs
- 99.0%
Air-quality risk 3/10 · Minor
- Unhealthy air days now
- 2 days/yr
- Unhealthy air days in 30 yrs
- 4 days/yr
Risk factors via First Street. Map © Google.
Why this score? — see what drove the C grade
The composite is a weighted blend of 9 inputs, each scored 0–100. Each bar is that input's sub-score; the figure is the points it added to the 100-point composite (weight × sub-score).
- Cash flow +24.4/30.0
- DSCR +7.9/10.0
- ARV discount +7.5/15.0
- 1% rule +5.2/10.0
- Schools +4.2/10.0
- Livability +2.5/5.0
- Condition / age +2.5/5.0
- Rent growth +1.3/5.0
- Appreciation +0.0/10.0
$199,900
🖨 Deal sheet 📄 Offer letter ✓ Due diligence
Listing remarks
Under contract-accepting backup offers. Opportunity awaits in the heart of Town N’ Country! This 2-bedroom, 1-bath home offers solid potential for investors, handymen, do-it-yourselfers, or buyers looking to make it their own. Featuring no HOA or CDD fees and no backyard neighbors for added privacy. Conveniently located near shopping, dining, and major roadways. With a little TLC, this could be a great place to call home or a strong investment. Roof 2008 A/C 2016.
Key facts
- No cdd fees
- No hoa
- 3,434 sq ft lot
Tags
Property features AI
Finance
- Other: Zoned PD
- HOA & community: No HOA; Community sidewalks
Exterior
- Parking: Carport (1 space)
- Utilities: Public water; Public sewer; Electricity connected; Cable available; Broadband/high-speed internet available
- Home design: Residential villa; One story; Faces south; Homestead exempt
- Construction: Block construction; Shingle roof; Block foundation; Built on a 0.08-acre lot; Asphalt road access
- Exterior features: Patio (screened); Rain gutters; Sidewalks; Shed(s)
Interior
- Kitchen: Microwave; Range; Refrigerator
- Bedrooms: 2 bedrooms
- Flooring: Laminate flooring; Tile flooring
- Bathrooms: 1 full bathroom
- Heating & cooling: Central heating; Central air conditioning
- Interior features: Cathedral ceilings; Blinds
- Laundry & utility: Dedicated laundry room
Neighborhood map
What this means for you Summary
Snapshot
- This is a 3-bed/1.0-bath townhouse listed at $200k.
Deal economics
- At list price, monthly cash flow is $404 ($5k/yr) — positive.
- The deal already cash-flows at list — no discount required.
- Meets the 1% rule at list price ($2k rent vs $200k).
Location & tenants
- Location reads: area grade C — affects rentability + tenant quality, not the cash-flow math above.
- Hillsborough (suburban): math 47% / reading 50% proficiency, ranked #41 of 73 in FL (top 56%) — families likely to look elsewhere, expect single-tenant / working-renter base with shorter leases.
- Market conditions: Rents falling (-4.6%/yr); 328 active listings in the ZIP; 10 comparable units currently listed for rent nearby; rentals leasing fast (median 3d on market — plan ~1-2 weeks tenant-placement turnaround); 9,053 units permitted in Hillsborough County in 2024 (4,555 in 5+ unit buildings).
- This rent runs 35% of the median local income ($69k/yr) — at the standard rent-burdened threshold; future hikes will face affordability resistance.
Forward outlook
- Local home prices are declining (-3.0%/yr); year-one equity from $1k of loan paydown is wiped out by about $6k of value loss. Plan a longer hold.
- Hillsborough County population projected at +37% by 2050 — long-run rental-demand tailwind backs the buy-and-hold thesis.
Negotiation context
- Only 2 days on market — expect competitive offers; lowballing is unlikely to land.
- Current owner paid $30k; list at $200k implies a 566% gain — meaningful room to come down on a strong offer.
Risks & watch-outs
- Climate carrying-cost: major flood risk; severe wind risk, 99% chance of damaging wind over 30y; extreme-heat days projected 7→28/yr by 2055 (HVAC capex compounding) — expect insurance premiums to compound above CPI over the hold.
Questions for the listing agent
- Built in 1976 — when were the roof, HVAC, electrical panel, plumbing, and water heater last replaced?
- Is there a deadline driving the sale (1031 exchange, divorce, estate, relocation)? That informs how much negotiation room exists.
- This sits on a lake — are riparian / water-frontage rights deeded with the parcel? Any dock permits, shoreline easements, or HOA water-use restrictions?
- What's the documented flood / surge / shoreline-erosion history here (FEMA AND non-FEMA — e.g., storm surge, creek backup, septic-field saturation)?
- Any water-quality or seasonal algae-bloom issues that affect tenant satisfaction or short-term-rental demand?
- What's the average days-on-market for RENTAL listings here right now (not sales)? A rising rental-DOM trend means longer vacancies and softer asking-rent achievability than the comps imply.
- What's the recent tenant-quality profile in this submarket — average credit score on applications, eviction rate, late-payment / NSF rate, and stable-employment percentage? A property-management company in the area should have these aggregated.
- How much new for-sale + rental construction is in the pipeline within 1–3 miles? Heavy new supply typically softens prices + rents 12–24 months out; constrained supply supports both.
Investment metrics
- 1% rule
- 1.02% ✓
- Cap rate
- 8.72%
- Cash-on-cash
- 8.67%
- DSCR
- 1.39
- GRM
- 8.1
CMA / ARV
No comps found within radius.
Projected returns pro-forma
-3.0% appreciation · 0.0% rent growth · sell at horizon
- IRR
- -6.3%
- Equity multiple
- 0.77×
- Total profit
- $-12,701
- Equity at exit
- $29,806
- IRR
- -0.4%
- Equity multiple
- 0.98×
- Total profit
- $-1,345
- Equity at exit
- $17,284
Cash invested: $55,972 (down + closing). Projections, not guarantees.
Landlord ↔ Tenant lean methodology
- Overall (STATE)
- 87 Strongly Landlord-Friendly
- State Florida
- 87 Strongly Landlord-Friendly · R+3
- County
- — inherits STATE
- City
- — inherits STATE
ZIP-level market 33615
- Rents YoY
- -4.6%
- Active inventory
- 328
- Price-to-rent
- 8.1×
Monthly cashflow live
- Estimated rent
- $2,044 high interval (Pro) →
- Mortgage (P&I)
- −$1,048
- Tax from tax record
- −$79 /mo · $945/yr
- Insurance
- −$83
- HOA
- −$0
- Vacancy / Maint / Mgmt
- −$429
- Net cashflow
- $404
Break-even live
UW: 25.0% down · 7.5% · 30yr · 1.5% tax · 5.0% vac · 8.0% maint · 8.0% mgmt
Financing live
Cash to close
- Down payment
- $49,975
- Closing costs
- $5,997
- Reserves months
- —
- Total cash needed
- —
Loan-product check · same deal, 3 products live
Conventional
25% down · 7.5% · 30yr
- Down + closing
- —
- Monthly P&I
- —
- Monthly cashflow
- —
- DSCR
- —
- Eligible?
- —
Personal DTI + credit; lowest rate.
DSCR
20% down · 8.5% · 30yr
- Down + closing
- —
- Monthly P&I
- —
- Monthly cashflow
- —
- DSCR
- —
- Eligible?
- —
No personal income docs; deal must DSCR.
Hard money
10% down · 12.0% · 12mo
- Down + closing
- —
- Monthly P&I
- —
- Monthly cashflow
- —
- DSCR
- —
- Eligible?
- —
Short-term bridge; refi at stabilization.
Rent comps 10 comps
| Address | Beds | Baths | Sqft | Rent | $/sqft | DOM | Units | Dist |
|---|---|---|---|---|---|---|---|---|
| 8307 Royal Sand Cir Unit 1475277P Tampa, FL | 2.0 | 2.0 | 1097 | $2,999 | $2.73 | 2d | 1 | 0.47mi |
| 7508 Stillridge Dr Unit G Tampa, FL | 2.0 | 2.0 | 973 | $1,495 | $1.54 | 22d | 1 | 0.56mi |
| 7605 Pinery Way Tampa, FL | 1.0–2.0 | 1.0–2.0 | 910 | $1,607 | $1.76 | 2d | 18 | 0.57mi |
| 8101 Sheldon Rd Unit 2 Tampa, FL | 2.0 | 2.0 | 810 | $1,650 | $2.04 | 24d | 1 | 0.80mi |
| 8870 W Waters Ave Tampa, FL | 1.0–2.0 | 1.0–2.0 | 1093 | $1,850 | $1.69 | 3d | 10 | 0.83mi |
| 6910 W Waters Ave Tampa, FL | 1.0–2.0 | 1.0–2.0 | 800 | $1,925 | $2.41 | 5d | 5 | 0.95mi |
| 8102 Sheldon Rd Tampa, FL | 1.0–2.0 | 1.0–2.0 | 737 | $1,910 | $2.59 | 2d | 22 | 0.97mi |
| 8820 Thomas Oaks Dr Tampa, FL | 1.0–3.0 | 1.0–2.0 | 1043 | $2,675 | $2.56 | 2d | 22 | 1.13mi |
| 8509 Olympic Ct Tampa, FL | 3.0 | 1.0 | 1119 | $1,736 | $1.55 | 17d | 1 | 1.24mi |
| 9567 Sunbelt St Tampa, FL | 1.0–3.0 | 1.0–2.0 | 947 | $2,369 | $2.50 | 3d | 11 | 1.39mi |
Listing history 4 events
-
2026-05-09status Pending
-
2026-05-07$199,900 Active
-
1993-10-12soldstatus $30,000
-
1980-09-01soldstatus $32,600
ⓘ Source: listings_history table (triggers on properties + properties_extension) + one-shot
backfill from property_details.listing_events for pre-trigger history.
Tax reassessment forecast FL · Resets to sale price
- Current annual tax
- $945 · $79/mo
- Projected year-2 tax
- $1,659 · $138/mo
- Expected delta
- +$714/yr (+$60/mo · 75.6%)
ⓘ Screening estimate from a state-policy table — verify with the county assessor before closing.
Climate risk First Street
- Flood 6/10 Major FEMA zone X (unshaded) · 53% chance over 30 yrs
- Wildfire 1/10 Low
- Heat 10/10 Extreme 7 d/yr ≥107°F today · 28 d/yr by 30 yrs out
- Wind 9/10 Extreme 99% chance of damaging wind over 30 yrs
- Air quality 3/10 Moderate 2 unhealthy d/yr today · 4 by 30 yrs out
Nearby sold comps map
Loading sold comps map…
Walkable amenities ~0.75 mi
Loading nearby amenities…
Taxation est. · year 1
- Rental income
- $24,528
- − Mortgage interest
- −$11,198
- − Property taxes
- −$945
- − Insurance
- −$1,000
- − Repairs & maintenance
- −$1,962
- − Management
- −$1,962
- − Depreciation
- −$5,815
- Taxable income
- $1,646
- Est. tax owed @ 24.0%
- −$395
- After-tax cash flow
- $4,458/yr
For passive investors: Depreciation is non-cash, so a rental often shows a tax loss while cash-flowing — sheltering income. Rental losses are passive: they offset passive income freely, and up to $25,000/yr can offset ordinary (W-2) income if you actively participate and your MAGI is under $100k (phasing out to $0 by $150k); unused losses carry forward. On sale, claimed depreciation is recaptured at up to 25%, and gains may owe capital-gains tax (a 1031 exchange can defer both). Figures are a year-1 estimate at your 24.0% rate — not tax advice; consult a CPA.
Schools (NCES district)
- District
- Hillsborough
- NCES district ID
- 1200870
- Math proficiency
- 47% ▼ -8.00%
- Reading proficiency
- 50% ▼ -4.00%
- Median HH income
- $50,622
- Composite
- 41.6/100
- National rank
- #3435
- State rank
- #41 of 73 in FL
Livability — Town 'n' Country
No livability data for this city. (Only ~50 U.S. cities are tracked.)
Census & demographics
- Census place
- Town 'n' Country, FL
- County
- Hillsborough County · 1,540,968 people
- City population
- 88,241
- Metro
- Tampa-St. Petersburg-Clearwater, FL
- Population (ZIP)
- 47,245
- Household income
- $69,274
- Rent vs Own
- Severe rent burden
- 1847.0
Population outlook (Hillsborough County) Hauer SSP2
- Today (2025)
- 1,607,022 people
- By 2030
- 1,733,968 · +7.9%
- By 2040
- 1,979,565 · +23.2%
- By 2050
- 2,203,427 · +37.1%
- By 2075
- 2,667,893 · +66.0%
- By 2100
- 2,891,558 · +79.9%
Race, ethnicity, and origin ACS 2023
- Neighborhood character
- Diverse neighborhood (Simpson 0.60)
- Race & ethnicity
- Hispanic / Latino 56% Two or more races 33% White 29% Black 7% Asian 3%
- Hispanic origin (detail)
- Mexican 2% Puerto Rican 14% Cuban 26% Dominican 3%
- Common ancestry
- Romanian 3% Estonian 1% Lithuanian 1%
- Foreign-born
- 36% · Canada, Jamaica, Vietnam
- Languages at home
- 44% English-only · Spanish 49% Other Indo-European 2% Russian/Polish/Slavic 1%
Political lean MEDSL · Hillsborough
- 2024 margin
- Toss-up / Even · D 47.8% · R 50.9% · Other 1.3%
- 2008→2024 swing
- -10.2pp toward R · 2008: 7.1pp · 2024: -3.1pp
- All cycles
- 2024: R+3.1 2020: D+6.9 2016: D+6.8 2012: D+6.7 2008: D+7.1
Not yet ingested
- Civics
- —
Market trends
- HPI YoY
- ▼ -376.91%
- Current HPI
- 401.8072
- Rent YoY
- ▼ -4.62%
- Metro
- Tampa-St. Petersburg-Clearwater, FL
- State GDP YoY
- ▲ 3.28%
- F500 in state
- 36
Industry mix (Fortune 500 HQ in FL)
| Industry | F500 HQs | Revenue |
|---|---|---|
| Industrial Technology | 2 | $29B |
|
||
| Insurance | 2 | $17B |
|
||
| Retail | 1 | $60B |
|
||
| Technology Distribution | 1 | $58B |
|
||
| Homebuilding | 1 | $35B |
|
||
| Technology Manufacturing | 1 | $35B |
|
||
Price history
+513.2% since first listed4 events — show timeline
- 2026-05-09 Pending — Stellar MLS as Distributed by MLS Grid
- 2026-05-07 Listed $199,900 Stellar MLS as Distributed by MLS Grid
- 1993-10-12 Sold (Public Records) $30,000 Public Records
- 1980-09-01 Sold (Public Records) $32,600 Public Records
Property tax history
+4.7%/yrLatest (2025): $945 · +4.9% YoY. Source: county tax records.
Cash-flow waterfall
monthlySold comps — $/sqft
last 12 mo · ≤1 miLoading sold comps…