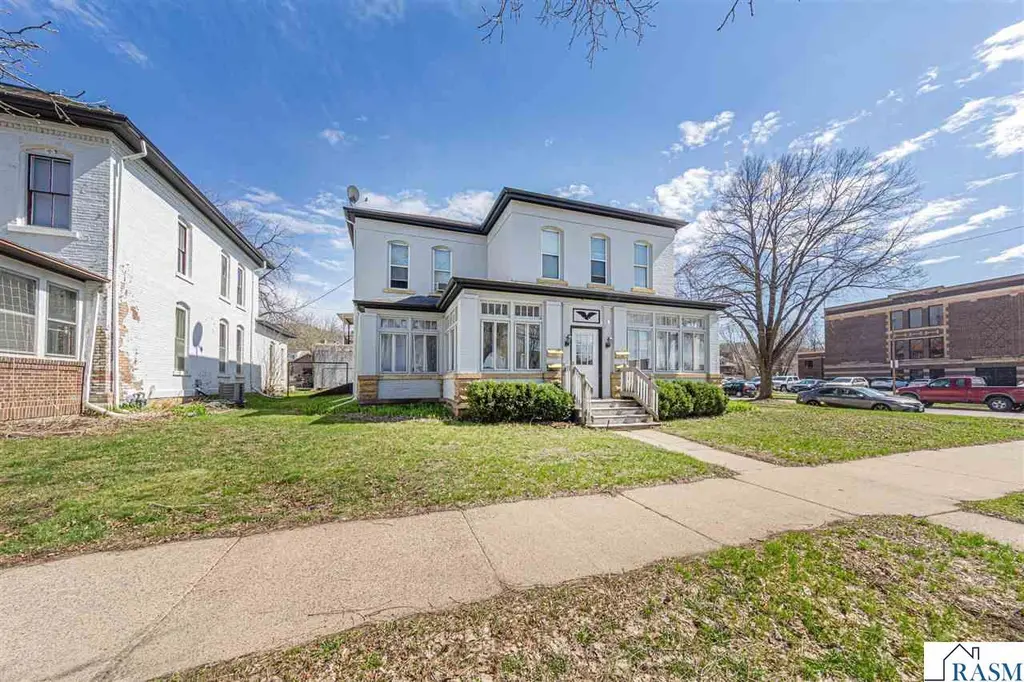
 Fourplex
303 N Broad St · Mankato, MN
Flood risk 1/10 · Minimal
- FEMA flood zone
- X
- Chance of flooding over 30 yrs
- 0.0%
- Est. flood insurance / yr
- $507 – $1,088
Fire risk 1/10 · Minimal
- Est. fire insurance / yr
- $888 – $1,650
Heat risk 2/10 · Minimal
- Hot days now (above 99°F)
- 7 days/yr
- Hot days in 30 yrs
- 15 days/yr
Wind risk 2/10 · Minimal
- Chance of severe wind over 30 yrs
- —
Air-quality risk 2/10 · Minimal
- Unhealthy air days now
- 1 days/yr
- Unhealthy air days in 30 yrs
- 1 days/yr
Risk factors via First Street. Map © Google.
Why this score? — see what drove the C+ grade
The composite is a weighted blend of 9 inputs, each scored 0–100. Each bar is that input's sub-score; the figure is the points it added to the 100-point composite (weight × sub-score).
- Cash flow +25.4/30.0
- DSCR +8.4/10.0
- 1% rule +6.5/10.0
- ARV discount +5.5/15.0
- Rent growth +4.6/5.0
- Schools +4.4/10.0
- Livability +3.9/5.0
- Condition / age +2.5/5.0
- Appreciation +0.0/10.0
$390,000
🖨 Deal sheet (PDF) 📄 Offer letter ✓ Due diligence
Multi-family units
County records classify this as Multi-Family (5+ Unit). Listing-text estimate: 4 units. estimate disagrees with records
5+ unit building — per-unit beds/baths from public records are typically unavailable; the breakdown below (if shown) is an estimate from the listing text.
Listing remarks MLS
Turnkey 4-unit investment opportunity in the heart of downtown Mankato. This 4,000+ sq ft property includes one 2-bedroom unit and three 1-bedroom units, all with full bathrooms, generating $3,075/month in rental income. Tenants pay electric and Wi-Fi, helping offset owner expenses. Newer roof (2019). The 2-bedroom unit features a dishwasher, and all units offer some cosmetic updates. Additional highlights include shared on-site laundry on first floor, tall/vaulted ceilings, and two porches for extra storage. Located just minutes from downtown amenities, this property offers strong rental appeal and consistent occupancy potential. 24-hour notice to tour. Call for a private showing.
Key facts
- 6,534 sq ft lot
- Parking
- Built 1885
Neighborhood map
What this means for you Summary
Snapshot
- This is a 1×2bd/1ba + 3×1bd/1ba units multifamily listed at $390k.
Deal economics
- At list price, monthly cash flow is $899 ($11k/yr) — positive. Per door: $225/mo.
- The deal already cash-flows at list — no discount required.
- Meets the 1% rule at list price ($5k rent vs $390k).
- Recommended offer: $367k (6.0% below list) — sets the bar for market timing.
- Cap rate 9.1% vs local median 3.4% in Mankato — top-decile yield for the area; either an underpriced asset or a hidden risk that comps aren't pricing in. Stress-test before assuming the spread holds.
Location & tenants
- Location reads 77/100 on livability (#133 in MN, #2,970 nationally) — a middle-class / working-renter tenant base. Strengths: housing A+, health & safety A+, cost of living A; Watch: crime C-, amenities C-, commute F.
- Mankato Public School District (urban): math 48% / reading 56% proficiency, ranked #98 of 301 in MN (top 33%) — acceptable for families but not a draw, mixed tenant base, ~2y average lease.
- Market conditions: Rents rising fast (+8.6%/yr); 352 active listings in the ZIP; 1 comparable units currently listed for rent nearby; 269 units permitted in Blue Earth County in 2024 (154 in 5+ unit buildings).
- At $4,501/mo this rent would consume 78% of the median local household income ($70k/yr) (locally 2394% of renters already pay >50% of income on rent) — very limited rent-growth headroom before tenants either downsize or default.
Forward outlook
- Local home prices are declining (-3.0%/yr); year-one equity from $3k of loan paydown is wiped out by about $12k of value loss. Plan a longer hold.
- Blue Earth County population projected at +18% by 2050 — long-run rental-demand tailwind backs the buy-and-hold thesis.
- At projected returns (-3.0% appreciation + 8.0% rent growth), your $109k cash investment doubles in ~8 years — after that, you're playing with house money.
Negotiation context
- It's been on market 63 days — a 6% lower offer ($367k) is reasonable based on typical stale-listing flexibility.
- Current owner paid $330k; 18% above their basis — modest negotiation headroom, anchor on the comps not their cost.
Risks & watch-outs
- Watch-outs: built in 1885 — expect roof / HVAC / electrical / plumbing capex.
Questions for the listing agent
- It's been on market 63 days. Have you received any prior offers? Is the seller open to a 6% concession, seller financing, or rate buy-down credit?
- Can we see the unit-by-unit rent roll, current vacancy, and any below-market leases? What's the average tenancy length?
- What capital expenditures (roof, boiler, parking lot, exteriors) have been made in the last 5 years, and what's planned in the next 2?
- Built in 1885 — when were the roof, HVAC, electrical panel, plumbing, and water heater last replaced?
- Why hasn't it sold? Are there any deal-killer items the seller is aware of (foundation, flood, title, zoning, code violations)?
- Is there a deadline driving the sale (1031 exchange, divorce, estate, relocation)? That informs how much negotiation room exists.
- Schools are B-rated — typically a magnet for longer-tenancy family renters. What's the average tenant stay here, and is there a school-zone premium baked into asking?
- What's the average days-on-market for RENTAL listings here right now (not sales)? A rising rental-DOM trend means longer vacancies and softer asking-rent achievability than the comps imply.
- What's the recent tenant-quality profile in this submarket — average credit score on applications, eviction rate, late-payment / NSF rate, and stable-employment percentage? A property-management company in the area should have these aggregated.
- How much new apartment / multifamily construction is in the pipeline within 1–3 miles? Heavy new supply (>2% of stock underway) typically softens rents 12–24 months out; light construction supports rent growth.
Investment metrics
- 1% rule
- 1.15% ✓
- Cap rate
- 9.06%
- Cash-on-cash
- 9.88%
- DSCR
- 1.44
- GRM
- 7.2
CMA / ARV
- ARV (median comp)
- $373,744
- List price
- $390,000
- Delta
- 4.35%
- Verdict
- FAIR
- Comps
- 6 within 1.0 mi
Show comp detail 1 sale within ~0.75 mi
| Address | Dist | Beds/Ba | Sqft | Sold | Price | $/sf | Match |
|---|---|---|---|---|---|---|---|
| 722 S Broad St | 0.70mi | 5/4.0 | 4,080 (+10%) | 9mo | $395,000 | $97 | 43 |
Match score weights: distance 35% · size 25% · config 20% · recency 20%. Top-matched comps best support the ARV.
Projected returns pro-forma
-3.0% appreciation · 8.0% rent growth · sell at horizon
- IRR
- 4.0%
- Equity multiple
- 1.16×
- Total profit
- $17,877
- Equity at exit
- $58,150
- IRR
- 17.7%
- Equity multiple
- 2.81×
- Total profit
- $197,719
- Equity at exit
- $33,720
Cash invested: $109,200 (down + closing). Projections, not guarantees.
Landlord ↔ Tenant lean methodology
- Overall (STATE)
- 46 Balanced
- State Minnesota
- 46 Balanced · D+2
- County
- — inherits STATE
- City
- — inherits STATE
ZIP-level market 56001
- Rents YoY
- 8.6%
- Active inventory
- 352
- Price-to-rent
- 27.2×
Monthly cashflow live
- Estimated rent
- $4,501 high interval (Pro) →
- Mortgage (P&I)
- −$2,045
- Tax from tax record
- −$449 /mo · $5,392/yr
- Insurance
- −$162
- HOA
- −$0
- Vacancy / Maint / Mgmt
- −$945
- Net cashflow
- $899
Break-even live
Sensitivity live
| Price | -10% $1,120 | -5% $1,009 | +0% $899 | +5% $788 | +10% $678 |
|---|---|---|---|---|---|
| Rent | -10% $543 | -5% $721 | +0% $899 | +5% $1,077 | +10% $1,254 |
| Rate | -1.0pp $1,095 | -0.5pp $998 | base $899 | +0.5pp $798 | +1.0pp $695 |
4-unit breakdown (identical units grouped — click to expand)
| Units | Beds | Baths | Est. rent |
|---|---|---|---|
| 1× unit | 2 | 1 | $1,194 |
| 3× units | 1 | 1 | $3,309 |
| #2 | 1 | 1 | $1,103 |
| #3 | 1 | 1 | $1,103 |
| #4 | 1 | 1 | $1,103 |
| Total (4 units) | $4,501 | ||
UW: 25.0% down · 7.5% · 30yr · 1.5% tax · 5.0% vac · 8.0% maint · 8.0% mgmt
Financing live
Cash to close
- Down payment
- $97,500
- Closing costs
- $11,700
- Reserves months
- —
- Total cash needed
- —
Loan-product check · same deal, 3 products live
Conventional
25% down · 7.5% · 30yr
- Down + closing
- —
- Monthly P&I
- —
- Monthly cashflow
- —
- DSCR
- —
- Eligible?
- —
Personal DTI + credit; lowest rate.
DSCR
20% down · 8.5% · 30yr
- Down + closing
- —
- Monthly P&I
- —
- Monthly cashflow
- —
- DSCR
- —
- Eligible?
- —
No personal income docs; deal must DSCR.
Hard money
10% down · 12.0% · 12mo
- Down + closing
- —
- Monthly P&I
- —
- Monthly cashflow
- —
- DSCR
- —
- Eligible?
- —
Short-term bridge; refi at stabilization.
Rent comps 1 comps
| Address | Beds | Baths | Sqft | Rent | $/sqft | DOM | Units | Dist |
|---|---|---|---|---|---|---|---|---|
| 412 Wall St Unit 412 North Mankato, MN | 4.0 | 2.5 | 2600 | $2,300 | $0.88 | 44d | 1 | 0.48mi |
Listing history 22 events
-
2026-06-19days on market $390,000 Active 63 DOM
-
2026-06-18days on market $390,000 Active 62 DOM
-
2026-06-17days on market $390,000 Active 61 DOM
-
2026-06-16days on market $390,000 Active 60 DOM
-
2026-06-15days on market $390,000 Active 59 DOM
-
2026-06-14days on market $390,000 Active 57 DOM
-
2026-06-13days on market $390,000 Active 56 DOM
-
2026-06-10days on market $390,000 Active 54 DOM
-
2026-06-09days on market $390,000 Active 53 DOM
-
2026-06-08days on market $390,000 Active 52 DOM
-
2026-06-07days on market $390,000 Active 51 DOM
-
2026-06-05days on market $390,000 Active 48 DOM
-
2026-06-03days on market $390,000 Active 47 DOM
-
2026-06-02days on market $390,000 Active 46 DOM
-
2026-06-01days on market $390,000 Active 45 DOM
-
2026-05-31days on market $390,000 Active 44 DOM
-
2026-05-30days on market $390,000 Active 43 DOM
-
2026-04-17$390,000 Active 690-char remark
Show marketing remark (690 chars)
Turnkey 4-unit investment opportunity in the heart of downtown Mankato. This 4,000+ sq ft property includes one 2-bedroom unit and three 1-bedroom units, all with full bathrooms, generating $3,075/month in rental income. Tenants pay electric and Wi-Fi, helping offset owner expenses. Newer roof (2019). The 2-bedroom unit features a dishwasher, and all units offer some cosmetic updates. Additional highlights include shared on-site laundry on first floor, tall/vaulted ceilings, and two porches for extra storage. Located just minutes from downtown amenities, this property offers strong rental appeal and consistent occupancy potential. 24-hour notice to tour. Call for a private showing.
-
2023-01-05soldstatus $330,000
-
2001-07-12soldstatus $180,000
-
1996-10-30soldstatus $97,000
-
1993-01-26soldstatus $85,000
ⓘ Source: listings_history table (triggers on properties + properties_extension) + one-shot
backfill from property_details.listing_events for pre-trigger history.
Tax reassessment forecast MN · Partial reset (capped growth)
- Current annual tax
- $5,392 · $449/mo
- Projected year-2 tax
- $5,392 · $449/mo
- Expected delta
- $0/yr ($0/mo · 0.0%)
ⓘ Screening estimate from a state-policy table — verify with the county assessor before closing.
Climate risk First Street
- Flood 1/10 Low FEMA zone X · 0% chance over 30 yrs
- Wildfire 1/10 Low
- Heat 2/10 Low 7 d/yr ≥99°F today · 15 d/yr by 30 yrs out
- Wind 2/10 Low
- Air quality 2/10 Low 1 unhealthy d/yr today · 1 by 30 yrs out
Nearby sold comps map
Loading sold comps map…
Walkable amenities ~0.75 mi
Loading nearby amenities…
Taxation est. · year 1
- Rental income
- $54,012
- − Mortgage interest
- −$21,846
- − Property taxes
- −$5,392
- − Insurance
- −$1,950
- − Repairs & maintenance
- −$4,321
- − Management
- −$4,321
- − Depreciation
- −$11,345
- Taxable income
- $4,837
- Est. tax owed @ 24.0%
- −$1,161
- After-tax cash flow
- $9,624/yr
For passive investors: Depreciation is non-cash, so a rental often shows a tax loss while cash-flowing — sheltering income. Rental losses are passive: they offset passive income freely, and up to $25,000/yr can offset ordinary (W-2) income if you actively participate and your MAGI is under $100k (phasing out to $0 by $150k); unused losses carry forward. On sale, claimed depreciation is recaptured at up to 25%, and gains may owe capital-gains tax (a 1031 exchange can defer both). Figures are a year-1 estimate at your 24.0% rate — not tax advice; consult a CPA.
Schools (NCES district)
- District
- Mankato Public School District
- NCES district ID
- 2718780
- Math proficiency
- 48% ▼ -11.00%
- Reading proficiency
- 56% ▼ -8.00%
- Median HH income
- $49,469
- Composite
- 44.36/100
- National rank
- #2819
- State rank
- #98 of 301 in MN
Livability — Mankato
- Score
- 77/100
- State rank
- #133
- US rank
- #2970
Category grades
Schools grade is shown separately in the Schools card above.
Census & demographics
- Census place
- Mankato, MN
- County
- Blue Earth County · 51,585 people
- City population
- 51,585
- Metro
- Mankato, MN
- Population (ZIP)
- 51,585
- Household income
- $69,531
- Rent vs Own
- Severe rent burden
- 2394.0
Population outlook (Blue Earth County) Hauer SSP2
- Today (2025)
- 70,208 people
- By 2030
- 72,708 · +3.6%
- By 2040
- 77,481 · +10.4%
- By 2050
- 82,842 · +18.0%
- By 2075
- 99,990 · +42.4%
- By 2100
- 116,795 · +66.4%
Race, ethnicity, and origin ACS 2023
- Neighborhood character
- Predominantly White (83%)
- Race & ethnicity
- White 83% Black 6% Hispanic / Latino 5% Two or more races 4% Asian 3%
- Common ancestry
- Portuguese 11% Lithuanian 3% Romanian 3%
- Foreign-born
- 8% · Canada, Vietnam, South Korea
- Languages at home
- 90% English-only · Spanish 3% Other Indo-European 1% Vietnamese 1%
Political lean MEDSL · Blue Earth
- 2024 margin
- Toss-up / Even · D 48.3% · R 49.5% · Other 2.1%
- 2008→2024 swing
- -14.2pp toward R · 2008: 12.9pp · 2024: -1.2pp
- All cycles
- 2024: R+1.2 2020: D+4.4 2016: R+3.7 2012: D+9.5 2008: D+12.9
Not yet ingested
- Civics
- —
Market trends
- HPI YoY
- ▼ -192.46%
- Current HPI
- 189.8485
- Rent YoY
- ▲ 8.55%
- Metro
- Mankato, MN
- State GDP YoY
- ▲ 2.41%
- F500 in state
- 34
Industry mix (Fortune 500 HQ in MN)
| Industry | F500 HQs | Revenue |
|---|---|---|
| Healthcare | 2 | $407B |
|
||
| Retail | 2 | $150B |
|
||
| Consumer Goods | 2 | $32B |
|
||
| Industrial Machinery | 2 | $6B |
|
||
| Agriculture | 1 | $40B |
|
||
| Healthcare / Medical Devices | 1 | $32B |
|
||
Price history
+358.8% since first listed5 events — show timeline
- 2026-04-17 Listed $390,000 RASM
- 2023-01-05 Sold (Public Records) $330,000 Public Records
- 2001-07-12 Sold (Public Records) $180,000 Public Records
- 1996-10-30 Sold (Public Records) $97,000 Public Records
- 1993-01-26 Sold (Public Records) $85,000 Public Records
Property tax history
+2.2%/yrLatest (2025): $5,392 · +2.1% YoY. Source: county tax records.
Cash-flow waterfall
monthlySold comps — $/sqft
last 12 mo · ≤1 miLoading sold comps…