 Multi-family
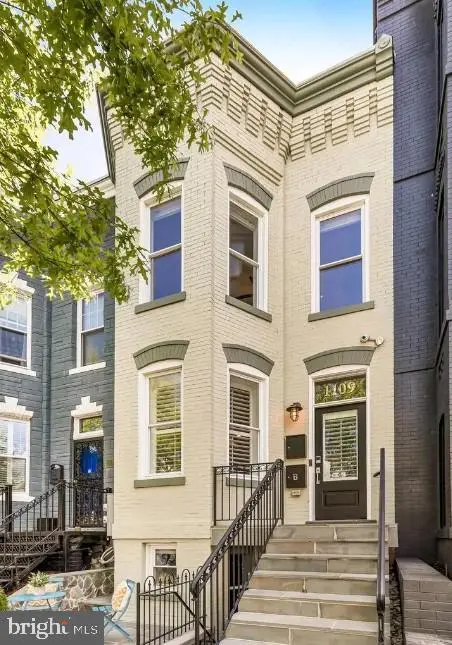
1109 I St NE · Washington, DC
Flood risk 1/10 · Minimal
- FEMA flood zone
- X (unshaded)
- Chance of flooding over 30 yrs
- 0.0%
- Est. flood insurance / yr
- $473 – $860
Fire risk 1/10 · Minimal
- Est. fire insurance / yr
- $631 – $1,173
Heat risk 7/10 · Major
- Hot days now (above 106°F)
- 7 days/yr
- Hot days in 30 yrs
- 15 days/yr
Wind risk 4/10 · Minor
- Chance of severe wind over 30 yrs
- 17.0%
Air-quality risk 4/10 · Minor
- Unhealthy air days now
- 4 days/yr
- Unhealthy air days in 30 yrs
- 5 days/yr
Risk factors via First Street. Map © Google.
Why this score? — see what drove the C- grade
The composite is a weighted blend of 9 inputs, each scored 0–100. Each bar is that input's sub-score; the figure is the points it added to the 100-point composite (weight × sub-score).
- Cash flow +22.5/30.0
- ARV discount +7.5/15.0
- DSCR +7.2/10.0
- 1% rule +5.0/10.0
- Livability +3.7/5.0
- Schools +3.6/10.0
- Condition / age +2.5/5.0
- Rent growth +1.7/5.0
- Appreciation +0.0/10.0
$1,400,000
🖨 Deal sheet 📄 Offer letter ✓ Due diligence
Multi-family units
County records classify this as Multi-Family (2-4 Unit). Listing-text estimate: 1 unit. estimate disagrees with records
Listing remarks MLS
Located on a quiet one-way street, 1109 I St NE is an oasis just steps from the endless amenities of vibrant H St NE. This fully renovated 5-bedroom, 3 and ½ bath home stuns with its soaring ceilings and high-end finishes. Boasting nearly 2,400 sq ft, it features an open floor plan on the main level with exposed brick, newly refinished red oak hardwood floors, built-in speakers, and custom kitchen cabinets with copious storage. The skylit upper level includes 3 bedrooms with Elfa closet systems and 2 full baths glimmering with floor-to-ceiling Avalon Marble tile. The lower level features a 2-bedroom 1-bath unit with a Certificate of Occupancy that's currently leased for $2,200/mo. The opposite of a dark English basement, this money-maker has high ceilings, a modern kitchen and bath, spacious custom closets, and windows in every room. Relax and entertain in two distinct outdoor spaces with a flagstone patio in the front and pavers throughout the back. A large shed, secure parking for two cars, and dedicated EV charging complete the package.
Key facts
- Custom kitchen
- Fully renovated
- Exposed brick
Tags
Property features AI
Finance
- Other: Total below-grade area of 860 (includes finished and unfinished areas); Above-grade finished area estimated at 1,565; Below-grade finished area estimated at 783 and unfinished area estimated at 77; Improvement and land assessed values reported
Exterior
- Parking: Off-street parking
- Utilities: Public water; Public sewer; Natural gas hot water
- Home design: Interior townhouse/rowhouse; Three levels; Fee simple ownership; Property in excellent condition
- Construction: Brick construction; Brick/mortar and concrete perimeter foundation; Above grade and below grade structures; Built year estimated
- Exterior features: No tidal water
Interior
- Bedrooms: One 2-bedroom unit; Three 3-bedroom units
- Heating & cooling: Forced air heating; Natural gas and electric heating fuel; Central air conditioning (electric)
- Interior features: Basement fully finished with outside entrance; Estimated living area; Total of 12 rooms
Neighborhood map
What this means for you Summary
Snapshot
- This is a 5-bed/3.5-bath multifamily listed at $1.40M.
Deal economics
- At list price, monthly cash flow is $2k ($28k/yr) — positive.
- The deal already cash-flows at list — no discount required.
- Meets the 1% rule at list price ($14k rent vs $1.40M).
- Recommended offer: $1.32M (6.0% below list) — sets the bar for market timing.
- Cap rate 8.3% vs local median 2.5% in Washington — top-decile yield for the area; either an underpriced asset or a hidden risk that comps aren't pricing in. Stress-test before assuming the spread holds.
Location & tenants
- Location reads 73/100 on livability (#1 in DC) — a middle-class / working-renter tenant base. Strengths: amenities A+, commute A+, employment A+; Watch: crime F, cost of living F.
- District Of Columbia Public Schools (urban): math 33% / reading 40% proficiency, ranked #8 of 32 in DC (top 25%) — families likely to look elsewhere, expect single-tenant / working-renter base with shorter leases; 65% free/reduced lunch — lower-income household profile, screen leases tightly.
- Market conditions: Rents falling (-3.0%/yr); 548 active listings in the ZIP; 39 comparable units currently listed for rent nearby; rentals at typical pace (median 25d on market — plan ~3-4 weeks tenant-placement turnaround); high-income renter base; 1,737 units permitted in District of Columbia in 2024 (1,506 in 5+ unit buildings).
- At $14,043/mo this rent would consume 140% of the median local household income ($120k/yr) (locally 3854% of renters already pay >50% of income on rent) — very limited rent-growth headroom before tenants either downsize or default.
Forward outlook
- Local home prices are declining (-3.0%/yr); year-one equity from $10k of loan paydown is wiped out by about $42k of value loss. Plan a longer hold.
- District of Columbia County population projected at +50% by 2050 — long-run rental-demand tailwind backs the buy-and-hold thesis.
Negotiation context
- It's been on market 84 days — a 6% lower offer ($1.32M) is reasonable based on typical stale-listing flexibility.
- 9 sale attempts since 19y ago; this cycle's ask has dropped $100k (7%) from the opening price — seller is motivated, your offer sets the floor, not the list.
Risks & watch-outs
- Watch-outs: built in 1933 — expect roof / HVAC / electrical / plumbing capex.
- Climate carrying-cost: extreme-heat days projected 7→15/yr by 2055 (HVAC capex compounding) — expect insurance premiums to compound above CPI over the hold.
Questions for the listing agent
- It's been on market 84 days. Have you received any prior offers? Is the seller open to a 6% concession, seller financing, or rate buy-down credit?
- Built in 1933 — when were the roof, HVAC, electrical panel, plumbing, and water heater last replaced?
- Why hasn't it sold? Are there any deal-killer items the seller is aware of (foundation, flood, title, zoning, code violations)?
- Is there a deadline driving the sale (1031 exchange, divorce, estate, relocation)? That informs how much negotiation room exists.
- Crime grade is F in this area — have there been break-ins, vandalism, or insurance claims at this property in the last 3 years? What carrier currently insures it and at what premium?
- What's the average days-on-market for RENTAL listings here right now (not sales)? A rising rental-DOM trend means longer vacancies and softer asking-rent achievability than the comps imply.
- What's the recent tenant-quality profile in this submarket — average credit score on applications, eviction rate, late-payment / NSF rate, and stable-employment percentage? A property-management company in the area should have these aggregated.
- How much new apartment / multifamily construction is in the pipeline within 1–3 miles? Heavy new supply (>2% of stock underway) typically softens rents 12–24 months out; light construction supports rent growth.
Investment metrics
- 1% rule
- 1.00% ✓
- Cap rate
- 8.30%
- Cash-on-cash
- 7.18%
- DSCR
- 1.32
- GRM
- 8.3
CMA / ARV
No comps found within radius.
Projected returns pro-forma
-3.0% appreciation · 0.0% rent growth · sell at horizon
- IRR
- -8.5%
- Equity multiple
- 0.70×
- Total profit
- $-118,911
- Equity at exit
- $208,745
- IRR
- -3.1%
- Equity multiple
- 0.82×
- Total profit
- $-71,592
- Equity at exit
- $121,046
Cash invested: $392,000 (down + closing). Projections, not guarantees.
Landlord ↔ Tenant lean methodology
- Overall (CITY)
- 0 Strongly Tenant-Friendly
- State District of Columbia
- 12 Strongly Tenant-Friendly · D+43
- County
- — inherits STATE
- City Washington
- 0 Strongly Tenant-Friendly · D+43
ZIP-level market 20002
- Rents YoY
- -3.0%
- Active inventory
- 548
- Price-to-rent
- 30.6×
Monthly cashflow live
- Estimated rent
- $14,043 medium interval (Pro) →
- Mortgage (P&I)
- −$7,342
- Tax from tax record
- −$822 /mo · $9,866/yr
- Insurance
- −$583
- HOA
- −$0
- Vacancy / Maint / Mgmt
- −$2,949
- Net cashflow
- $2,347
Break-even live
4-unit breakdown (identical units grouped — click to expand)
| Units | Beds | Baths | Est. rent |
|---|---|---|---|
| 2× units | 3 | 1.5 | $7,620 |
| #1 | 3 | 1.5 | $3,810 |
| #2 | 3 | 1.5 | $3,810 |
| 2× units | 2 | 1.5 | $6,424 |
| #3 | 2 | 1.5 | $3,212 |
| #4 | 2 | 1.5 | $3,212 |
| Total (4 units) | $14,043 | ||
UW: 25.0% down · 7.5% · 30yr · 1.5% tax · 5.0% vac · 8.0% maint · 8.0% mgmt
Financing live
Cash to close
- Down payment
- $350,000
- Closing costs
- $42,000
- Reserves months
- —
- Total cash needed
- —
Loan-product check · same deal, 3 products live
Conventional
25% down · 7.5% · 30yr
- Down + closing
- —
- Monthly P&I
- —
- Monthly cashflow
- —
- DSCR
- —
- Eligible?
- —
Personal DTI + credit; lowest rate.
DSCR
20% down · 8.5% · 30yr
- Down + closing
- —
- Monthly P&I
- —
- Monthly cashflow
- —
- DSCR
- —
- Eligible?
- —
No personal income docs; deal must DSCR.
Hard money
10% down · 12.0% · 12mo
- Down + closing
- —
- Monthly P&I
- —
- Monthly cashflow
- —
- DSCR
- —
- Eligible?
- —
Short-term bridge; refi at stabilization.
Rent comps 39 comps
| Address | Beds | Baths | Sqft | Rent | $/sqft | DOM | Units | Dist |
|---|---|---|---|---|---|---|---|---|
| 1119 Montello Ave NE Washington, DC | 6.0 | 2.0 | 1938 | $6,000 | $3.10 | 24d | 1 | 0.17mi |
| 1321 I St NE Washington, DC | 4.0 | 3.5 | 1809 | $4,600 | $2.54 | 24d | 1 | 0.19mi |
| 1324 H St NE Unit 2 Washington, DC | 4.0 | 1.5 | 2100 | $4,000 | $1.90 | 24d | 1 | 0.20mi |
| 1127 Orren St NE Washington, DC | 6.0 | 2.5 | 2064 | $6,800 | $3.29 | 24d | 1 | 0.28mi |
| 1236 Oates St NE Washington, DC | 4.0 | 2.0 | 1294 | $2,999 | $2.32 | 18d | 1 | 0.36mi |
| 1222 Owen Pl NE Washington, DC | 4.0 | 2.5 | 2164 | $3,800 | $1.76 | 24d | 1 | 0.40mi |
| 1409 Orren St NE Washington, DC | 4.0 | 2.0 | 1352 | $3,995 | $2.95 | 7d | 1 | 0.42mi |
| 1209 6th St NE Unit A Washington, DC | 4.0 | 1.5 | 1648 | $3,400 | $2.06 | 24d | 1 | 0.52mi |
| 743 3rd St NE Washington, DC | 4.0 | 2.5 | 1100 | $5,000 | $4.55 | 24d | 1 | 0.58mi |
| 1109 Abbey Pl NE Washington, DC | 4.0 | 2.0 | 1568 | $4,350 | $2.77 | 12d | 1 | 0.58mi |
| 1414 C St NE Washington, DC | 4.0 | 2.5 | 1824 | $5,100 | $2.80 | 24d | 1 | 0.60mi |
| 1255 Raum St NE Unit 1388282P Washington, DC | 2.0–8.0 | 1.0–5.0 | 3245 | $8,740 | $2.69 | 2d | 2 | 0.61mi |
| 1714 Montello Ave NE Washington, DC | 4.0 | 3.0 | 2100 | $4,350 | $2.07 | 24d | 1 | 0.65mi |
| 1224 16th St NE Washington, DC | 4.0 | 2.0 | 1360 | $3,900 | $2.87 | 24d | 1 | 0.67mi |
| 711 18th St NE Unit 1 Washington, DC | 4.0 | 2.0 | 1124 | $5,300 | $4.72 | 24d | 1 | 0.75mi |
| 300 Neal Pl NE Washington, DC | 4.0 | 1.0–4.0 | 951 | $6,363 | $6.69 | 1d | 10 | 0.77mi |
| 847 20th St NE Washington, DC | 4.0 | 2.5 | 1802 | $4,100 | $2.28 | 12d | 1 | 0.87mi |
| 2025 E St NE Unit 4 Washington, DC | 5.0 | 3.0 | 1936 | $6,593 | $3.41 | 24d | 1 | 0.91mi |
| 525 21st St NE Washington, DC | 4.0 | 3.5 | 1860 | $3,545 | $1.91 | 24d | 1 | 0.95mi |
| 525 21st St NE Washington, DC | 4.0 | 3.5 | 1890 | $3,545 | $1.88 | 18d | 1 | 0.95mi |
| 7 New York Ave NE Washington, DC | 4.0 | 1.0–3.0 | 1096 | $7,800 | $7.11 | 2d | 11 | 1.02mi |
| 1618 1st St NE Washington, DC | 6.0 | 3.0 | 1300 | $5,695 | $4.38 | 7d | 1 | 1.12mi |
| 401 11th St SE Washington, DC | 4.0 | 4.5 | 1832 | $7,000 | $3.82 | 18d | 1 | 1.18mi |
| 1417 1st St NW Washington, DC | 4.0 | 3.5 | 1763 | $5,000 | $2.84 | 24d | 1 | 1.26mi |
| 2104 4th St NE #1 Washington, DC | 4.0 | 3.5 | 2165 | $6,150 | $2.84 | 24d | 1 | 1.31mi |
| 2129 4th St NE Washington, DC | 4.0 | 3.5 | 2052 | $4,400 | $2.14 | 24d | 1 | 1.33mi |
| 1613 1st St NW Washington, DC | 4.0 | 4.0 | 1965 | $4,750 | $2.42 | 24d | 1 | 1.34mi |
| 167 V St NE Washington, DC | 5.0 | 2.0 | 1485 | $5,850 | $3.94 | 24d | 1 | 1.37mi |
| 2218 16th St NE Washington, DC | 4.0 | 2.5 | 1496 | $3,400 | $2.27 | 18d | 1 | 1.39mi |
| 45 Rhode Island Ave NE Unit 1388279P Washington, DC | 2.0–6.0 | 2.0–6.0 | 10371 | $13,837 | $1.33 | 7d | 2 | 1.43mi |
| 448 K St NW Unit 301 Washington, DC | 5.0 | 2.0 | 1442 | $5,800 | $4.02 | 3d | 1 | 1.45mi |
| 448 K St NW Unit 401 Washington, DC | 5.0 | 2.0 | 1442 | $5,300 | $3.68 | 17d | 1 | 1.45mi |
| 448 K St NW Unit 301 Washington, DC | 5.0 | 2.0 | 1442 | $5,800 | $4.02 | 2d | 1 | 1.45mi |
| 448 K St NW Unit 601 Washington, DC | 5.0 | 2.0 | 1442 | $5,300 | $3.68 | 24d | 1 | 1.45mi |
| 448 K St NW Unit 202 Washington, DC | 5.0 | 2.0 | 1442 | $4,800 | $3.33 | 20d | 1 | 1.45mi |
| 448 K St NW Unit 202 Washington, DC | 5.0 | 2.0 | 1442 | $4,500 | $3.12 | 18d | 1 | 1.45mi |
| 1417 Downing St NE Washington, DC | 4.0 | 2.0 | 1538 | $4,200 | $2.73 | 4d | 1 | 1.47mi |
| 2300 18th St NE #2300 Washington, DC | 4.0 | 3.0 | 1826 | $4,500 | $2.46 | 22d | 1 | 1.48mi |
| 1704 Montana Ave NE Washington, DC | 4.0 | 2.0 | 1518 | $4,000 | $2.64 | 24d | 1 | 1.50mi |
Listing history 49 events
-
2026-06-18days on market $1,400,000 Active 84 DOM
-
2026-06-17days on market $1,400,000 Active 83 DOM
-
2026-06-16days on market $1,400,000 Active 82 DOM
-
2026-06-15days on market $1,400,000 Active 81 DOM
-
2026-06-13days on market $1,400,000 Active 79 DOM
-
2026-06-09days on market $1,400,000 Active 75 DOM
-
2026-06-08days on market $1,400,000 Active 74 DOM
-
2026-06-07days on market $1,400,000 Active 73 DOM
-
2026-06-04days on market $1,400,000 Active 70 DOM
-
2026-06-03days on market $1,400,000 Active 69 DOM
-
2026-06-02days on market $1,400,000 Active 68 DOM
-
2026-06-01days on market $1,400,000 Active 67 DOM
-
2026-05-31days on market $1,400,000 Active 66 DOM
-
2026-05-21price $1,400,000
-
2026-05-04price $1,450,000
-
2026-03-26$1,500,000 Active
-
2025-12-05historical
-
2025-11-20price $1,450,000
-
2025-10-29$1,500,000 Active
-
2023-11-08historical $1,999
-
2023-10-22price $1,999
-
2023-10-01price $2,159
-
2023-09-20price $2,299
-
2023-08-11price $2,419
-
2023-07-12
-
2023-05-25soldstatus $1,300,000
-
2023-05-24soldstatus $1,300,000 Closed 1062-char remark
Show marketing remark (1062 chars)
Located on a quiet one-way street, 1109 I St NE is an oasis just steps from the endless amenities of vibrant H St NE. This fully renovated 5-bedroom, 3 and ½ bath home stuns with its soaring ceilings and high-end finishes. Boasting nearly 2,400 sq ft, it features an open floor plan on the main level with exposed brick, newly refinished red oak hardwood floors, built-in speakers, and custom kitchen cabinets with copious storage. The skylit upper level includes 3 bedrooms with Elfa closet systems and 2 full baths glimmering with floor-to-ceiling Avalon Marble tile. The lower level features a 2-bedroom 1-bath unit with a Certificate of Occupancy that's currently leased for $2,200/mo. The opposite of a dark English basement, this money-maker has high ceilings, a modern kitchen and bath, spacious custom closets, and windows in every room. Relax and entertain in two distinct outdoor spaces with a flagstone patio in the front and pavers throughout the back. A large shed, secure parking for two cars, and dedicated EV charging complete the package.
-
2023-04-26status Pending 1062-char remark
Show marketing remark (1062 chars)
Located on a quiet one-way street, 1109 I St NE is an oasis just steps from the endless amenities of vibrant H St NE. This fully renovated 5-bedroom, 3 and ½ bath home stuns with its soaring ceilings and high-end finishes. Boasting nearly 2,400 sq ft, it features an open floor plan on the main level with exposed brick, newly refinished red oak hardwood floors, built-in speakers, and custom kitchen cabinets with copious storage. The skylit upper level includes 3 bedrooms with Elfa closet systems and 2 full baths glimmering with floor-to-ceiling Avalon Marble tile. The lower level features a 2-bedroom 1-bath unit with a Certificate of Occupancy that's currently leased for $2,200/mo. The opposite of a dark English basement, this money-maker has high ceilings, a modern kitchen and bath, spacious custom closets, and windows in every room. Relax and entertain in two distinct outdoor spaces with a flagstone patio in the front and pavers throughout the back. A large shed, secure parking for two cars, and dedicated EV charging complete the package.
-
2023-04-20$1,298,500 Active 1062-char remark
Show marketing remark (1062 chars)
Located on a quiet one-way street, 1109 I St NE is an oasis just steps from the endless amenities of vibrant H St NE. This fully renovated 5-bedroom, 3 and ½ bath home stuns with its soaring ceilings and high-end finishes. Boasting nearly 2,400 sq ft, it features an open floor plan on the main level with exposed brick, newly refinished red oak hardwood floors, built-in speakers, and custom kitchen cabinets with copious storage. The skylit upper level includes 3 bedrooms with Elfa closet systems and 2 full baths glimmering with floor-to-ceiling Avalon Marble tile. The lower level features a 2-bedroom 1-bath unit with a Certificate of Occupancy that's currently leased for $2,200/mo. The opposite of a dark English basement, this money-maker has high ceilings, a modern kitchen and bath, spacious custom closets, and windows in every room. Relax and entertain in two distinct outdoor spaces with a flagstone patio in the front and pavers throughout the back. A large shed, secure parking for two cars, and dedicated EV charging complete the package.
-
2023-04-15historical $1,298,500 1062-char remark
Show marketing remark (1062 chars)
Located on a quiet one-way street, 1109 I St NE is an oasis just steps from the endless amenities of vibrant H St NE. This fully renovated 5-bedroom, 3 and ½ bath home stuns with its soaring ceilings and high-end finishes. Boasting nearly 2,400 sq ft, it features an open floor plan on the main level with exposed brick, newly refinished red oak hardwood floors, built-in speakers, and custom kitchen cabinets with copious storage. The skylit upper level includes 3 bedrooms with Elfa closet systems and 2 full baths glimmering with floor-to-ceiling Avalon Marble tile. The lower level features a 2-bedroom 1-bath unit with a Certificate of Occupancy that's currently leased for $2,200/mo. The opposite of a dark English basement, this money-maker has high ceilings, a modern kitchen and bath, spacious custom closets, and windows in every room. Relax and entertain in two distinct outdoor spaces with a flagstone patio in the front and pavers throughout the back. A large shed, secure parking for two cars, and dedicated EV charging complete the package.
-
2014-04-08soldstatus $842,500
-
2014-04-08soldstatus $842,500 Sold
-
2014-04-08soldstatus $842,500
-
2014-03-12status Contingent (No Kick Out)
-
2014-03-11historical
-
2014-03-03$839,900 Active
-
2014-03-03$839,900
-
2013-12-05soldstatus $486,000
-
2013-12-03historical
-
2013-12-03soldstatus $486,000 Sold
-
2013-12-03soldstatus $486,000
-
2013-08-30status Contingent (No Kick Out)
-
2013-08-30historical
-
2013-08-23$499,900 Active
-
2013-08-23$499,900
-
2007-09-01historical
-
2007-04-05
-
1991-09-06soldstatus $65,000
-
1991-09-05soldstatus $65,000
ⓘ Source: listings_history table (triggers on properties + properties_extension) + one-shot
backfill from property_details.listing_events for pre-trigger history.
Tax reassessment forecast DC · Partial reset (capped growth)
- Current annual tax
- $9,866 · $822/mo
- Projected year-2 tax
- $9,866 · $822/mo
- Expected delta
- $0/yr ($0/mo · 0.0%)
ⓘ Screening estimate from a state-policy table — verify with the county assessor before closing.
Climate risk First Street
- Flood 1/10 Low FEMA zone X (unshaded) · 0% chance over 30 yrs
- Wildfire 1/10 Low
- Heat 7/10 Severe 7 d/yr ≥106°F today · 15 d/yr by 30 yrs out
- Wind 4/10 Moderate 17% chance of damaging wind over 30 yrs
- Air quality 4/10 Moderate 4 unhealthy d/yr today · 5 by 30 yrs out
Nearby sold comps map
Loading sold comps map…
Walkable amenities ~0.75 mi
Loading nearby amenities…
Taxation est. · year 1
- Rental income
- $168,516
- − Mortgage interest
- −$78,422
- − Property taxes
- −$9,866
- − Insurance
- −$7,000
- − Repairs & maintenance
- −$13,481
- − Management
- −$13,481
- − Depreciation
- −$40,727
- Taxable income
- $5,538
- Est. tax owed @ 24.0%
- −$1,329
- After-tax cash flow
- $26,831/yr
For passive investors: Depreciation is non-cash, so a rental often shows a tax loss while cash-flowing — sheltering income. Rental losses are passive: they offset passive income freely, and up to $25,000/yr can offset ordinary (W-2) income if you actively participate and your MAGI is under $100k (phasing out to $0 by $150k); unused losses carry forward. On sale, claimed depreciation is recaptured at up to 25%, and gains may owe capital-gains tax (a 1031 exchange can defer both). Figures are a year-1 estimate at your 24.0% rate — not tax advice; consult a CPA.
Schools (NCES district)
- District
- District Of Columbia Public Schools
- NCES district ID
- 1100030
- Math proficiency
- 33% ▲ 3.00%
- Reading proficiency
- 40% ▲ 5.00%
- Median HH income
- $67,671
- Composite
- 35.84/100
- National rank
- #9606
- State rank
- #8 of 32 in DC
Livability — Washington
- Score
- 73/100
- State rank
- #1
- US rank
- #5327
Category grades
Schools grade is shown separately in the Schools card above.
Census & demographics
- Census place
- Washington, DC
- County
- District of Columbia · 671,873 people
- City population
- 671,873
- Metro
- Washington-Arlington-Alexandria, DC-VA-MD-WV
- Population (ZIP)
- 72,397
- Household income
- $120,337
- Rent vs Own
- Severe rent burden
- 3854.0
Population outlook (District of Columbia County) Hauer SSP2
- Today (2025)
- 821,926 people
- By 2030
- 899,517 · +9.4%
- By 2040
- 1,061,162 · +29.1%
- By 2050
- 1,231,493 · +49.8%
- By 2075
- 1,603,312 · +95.1%
- By 2100
- 1,847,141 · +124.7%
Race, ethnicity, and origin ACS 2023
- Neighborhood character
- Diverse neighborhood (Simpson 0.66)
- Race & ethnicity
- White 41% Black 40% Two or more races 9% Hispanic / Latino 9% Asian 3%
- Hispanic origin (detail)
- Mexican 2%
- Common ancestry
- Romanian 3% Lithuanian 2% Italian 2%
- Foreign-born
- 9% · Canada, China, South Korea
- Languages at home
- 87% English-only · Spanish 5% French/Haitian/Cajun 2% Other Indo-European 1%
Political lean MEDSL · District of Columbia
- 2024 margin
- Solid D (+86.1) · D 91.2% · R 5.1% · Other 3.8%
- 2008→2024 swing
- +0.1pp no change · 2008: 85.9pp · 2024: 86.1pp
- All cycles
- 2024: D+86.1 2020: D+86.8 2016: D+88.7 2012: D+84.2 2008: D+85.9
Not yet ingested
- Civics
- —
Market trends
- HPI YoY
- ▼ -852.61%
- Current HPI
- 396.6033
- Rent YoY
- ▼ -3.04%
- Metro
- Washington-Arlington-Alexandria, DC-VA-MD-WV
- State GDP YoY
- ▲ 1.33%
- F500 in state
- 6
Industry mix (Fortune 500 HQ in DC)
| Industry | F500 HQs | Revenue |
|---|---|---|
| Financial Services | 1 | $153B |
|
||
| Life Sciences / Industrials | 1 | $25B |
|
||
| Industrial Machinery | 1 | $8B |
|
||
Price history
+2053.8% since first listed36 events — show timeline
- 2026-05-21 Price Changed $1,400,000 BRIGHT MLS
- 2026-05-04 Price Changed $1,450,000 BRIGHT MLS
- 2026-03-26 Listed $1,500,000 BRIGHT MLS
- 2025-12-05 Listing Removed — BRIGHT MLS
- 2025-11-20 Price Changed $1,450,000 BRIGHT MLS
- 2025-10-29 Listed $1,500,000 BRIGHT MLS
- 2023-11-08 Rental Removed $1,999 BUILDIUM
- 2023-10-22 Price Changed $1,999 BUILDIUM
- 2023-10-01 Price Changed $2,159 BUILDIUM
- 2023-09-20 Price Changed $2,299 BUILDIUM
- 2023-08-11 Price Changed $2,419 BUILDIUM
- 2023-07-12 Listed for Rent — BUILDIUM
- 2023-05-25 Sold (Public Records) $1,300,000 Public Records
- 2023-05-24 Sold (MLS) $1,300,000 BRIGHT MLS
- 2023-04-26 Pending — BRIGHT MLS
- 2023-04-20 Listed $1,298,500 BRIGHT MLS
- 2023-04-15 Coming Soon $1,298,500 BRIGHT MLS
- 2014-04-08 Sold (Public Records) $842,500 Public Records
- 2014-04-08 Sold (MLS) $842,500 MRIS
- 2014-04-08 Sold (MLS) $842,500 BRIGHT MLS
- 2014-03-12 Pending — MRIS
- 2014-03-11 Listing Removed — BRIGHT MLS
- 2014-03-03 Listed $839,900 MRIS
- 2014-03-03 Listed $839,900 BRIGHT MLS
- 2013-12-05 Sold (Public Records) $486,000 Public Records
- 2013-12-03 Delisted — MRIS
- 2013-12-03 Sold (MLS) $486,000 BRIGHT MLS
- 2013-12-03 Sold (MLS) $486,000 MRIS
- 2013-08-30 Pending — MRIS
- 2013-08-30 Listing Removed — BRIGHT MLS
- 2013-08-23 Listed $499,900 MRIS
- 2013-08-23 Listed $499,900 BRIGHT MLS
- 2007-09-01 Delisted — MRIS
- 2007-04-05 Listed — MRIS
- 1991-09-06 Sold (Public Records) $65,000 Public Records
- 1991-09-05 Sold (Public Records) $65,000 Public Records
Property tax history
+5.9%/yrLatest (2025): $9,866 · +0.1% YoY. Source: county tax records.
Cash-flow waterfall
monthlySold comps — $/sqft
last 12 mo · ≤1 miLoading sold comps…