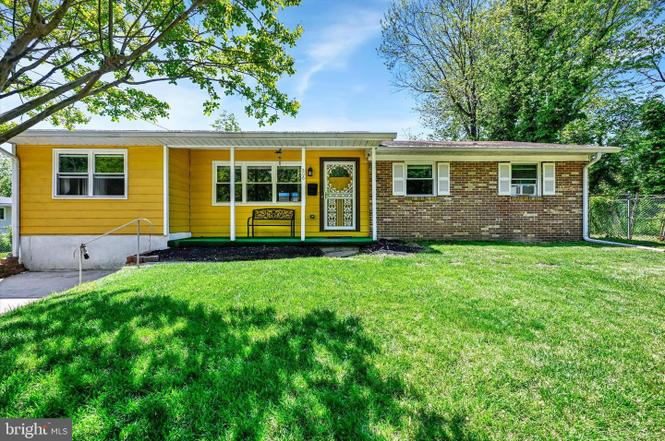
206 Melvin Ave · Catonsville, MD
Flood risk 1/10 · Minimal
- FEMA flood zone
- X (unshaded)
- Chance of flooding over 30 yrs
- 0.0%
- Est. flood insurance / yr
- $473 – $860
Fire risk 2/10 · Minimal
- Est. fire insurance / yr
- $755 – $1,403
Heat risk 6/10 · Moderate
- Hot days now (above 103°F)
- 7 days/yr
- Hot days in 30 yrs
- 15 days/yr
Wind risk 4/10 · Minor
- Chance of severe wind over 30 yrs
- 18.0%
Air-quality risk 3/10 · Minor
- Unhealthy air days now
- 3 days/yr
- Unhealthy air days in 30 yrs
- 4 days/yr
Risk factors via First Street. Map © Google.
Why this score? — see what drove the D- grade
The composite is a weighted blend of 9 inputs, each scored 0–100. Each bar is that input's sub-score; the figure is the points it added to the 100-point composite (weight × sub-score).
- ARV discount +15.0/15.0
- Cash flow +8.4/30.0
- Livability +4.0/5.0
- Rent growth +3.0/5.0
- Condition / age +2.5/5.0
- 1% rule +2.3/10.0
- DSCR +2.3/10.0
- Schools +2.3/10.0
- Appreciation +0.0/10.0
$330,000
🖨 Deal sheet 📄 Offer letter ✓ Due diligence
Listing remarks
Welcome to 206 Melvin Ave in Catonsville. This brick and siding rancher offers easy one-level living with hardwood floors, a modern kitchen, spacious living and dining areas, and a bright rear sunroom overlooking the backyard. The home features generous room sizes and a flexible layout ready for your personal touches. Recent updates include a new water heater in 2025 and basement waterproofing completed in 2025 with a sump pump and battery backup for added peace of mind. Enjoy the charm and convenience that make Catonsville so popular. Residents love the small-town feel, local shops and restaurants along Frederick Road, community events, and quick access to Patapsco Valley State Park with m
Key facts
- Bright rear sunroom
- Recent updates
- Sump pump
Tags
Property features AI
Finance
- Other: Fee simple ownership; Property condition listed below average / major rehab needed; Pets allowed with no restrictions; Below-grade finished and unfinished areas present
Exterior
- Parking: Driveway; On-street parking
- Utilities: Public water; Public sewer; Electric service 200+ amp available; Natural gas available (heating and hot water)
- Home design: Detached home; Not in a federal flood zone; Suburban location; Blacktop road access
- Construction: Brick and vinyl siding exterior; Shingle roof; Block foundation; Basement: poured concrete, unfinished (with sump pump); Basement footprint fully under the house (100%)
- Exterior features: Chain link fencing; Shed; Rear entrance to basement
Interior
- Kitchen: Exhaust fan; Microwave
- Bedrooms: 3 bedrooms on the main level
- Flooring: Laminate plank; Wood
- Bathrooms: 1 full bathroom on the main level; 1 half bathroom on the main level; Total: 1 full bath, 1 half bath
- Heating & cooling: 90% forced air heating (natural gas); Window air conditioning units (electric)
- Interior features: Ceiling fans; Air filter system; Not furnished
- Laundry & utility: Basement laundry hookups
Neighborhood map
What this means for you Summary
Snapshot
- This is a 3-bed/1.0-bath single-family listed at $330k.
Deal economics
- At list price, monthly cash flow is $-296 ($-4k/yr) — negative.
- To cash-flow at today's rent, offer at most $278k (15.9% below list).
- To meet the 1% rule (rent ≥ 1% of price), the offer needs to be $241k (26.9% below list).
- Recommended offer: $241k (26.9% below list) — sets the bar for 1% rule.
- Cap rate 5.2% vs local median 3.4% in Catonsville — top-decile yield for the area; either an underpriced asset or a hidden risk that comps aren't pricing in. Stress-test before assuming the spread holds.
Location & tenants
- Location reads 81/100 on livability (#43 in MD, #1,586 nationally) — a professional / high-income tenant draw. Strengths: commute A+, employment A+, housing A+; Watch: crime D, cost of living D.
- Baltimore County Public Schools (suburban): math 15% / reading 34% proficiency, ranked #11 of 24 in MD (top 46%) — low school quality limits family demand, transient renter base, plan for 1-2y turnover.
- Zoned schools: Hillcrest Elementary (math 35% / reading 41%, grade F, #117 of 860 statewide, top 14%, 652 students, 34% FRL); Catonsville Middle (math 11% / reading 49%, grade F, #65 of 225 statewide, top 29%, 805 students, 40% FRL); Catonsville High (math 26% / reading 68%, grade D-, #114 of 222 statewide, top 52%, 1,729 students, 42% FRL) — zoned schools at 39% FRL track the district average.
- Zoned-school proficiency averages 38% at this address vs 24% district-wide (+14 pts) — the actual schools serving this property are materially stronger than the Baltimore County Public Schools average implies; a family-tenant draw the district grade alone would hide.
- Market conditions: Rents rising (+1.9%/yr); 144 active listings in the ZIP; 10 comparable units currently listed for rent nearby; rentals at typical pace (median 20d on market — plan ~3-4 weeks tenant-placement turnaround); 40% of comp listings sitting > 30 days — soft ceiling on asking rent; high-income renter base; 1,511 units permitted in Baltimore County in 2024 (643 in 5+ unit buildings).
Forward outlook
- Local home prices are declining (-3.0%/yr); year-one equity from $2k of loan paydown is wiped out by about $10k of value loss. Plan a longer hold.
- Baltimore County population projected at +12% by 2050 — modest demand growth; plan on rents tracking national, not racing it.
Negotiation context
- Only 9 days on market — expect competitive offers; lowballing is unlikely to land.
- 2 sale attempts with the ask held roughly flat each time — persistent listings suggest the price (not the market) is what's stuck; bring a comps-based counter.
- Current owner paid $32k; list at $330k implies a 934% gain — meaningful room to come down on a strong offer.
Risks & watch-outs
- Climate carrying-cost: extreme-heat days projected 7→15/yr by 2055 (HVAC capex compounding) — expect insurance premiums to compound above CPI over the hold.
Questions for the listing agent
- What do current leases actually rent for vs. the listed asking? Can we see a recent rent roll and the last 12 months of T-12 income?
- Built in 1968 — when were the roof, HVAC, electrical panel, plumbing, and water heater last replaced?
- Is there a deadline driving the sale (1031 exchange, divorce, estate, relocation)? That informs how much negotiation room exists.
- Crime grade is D in this area — have there been break-ins, vandalism, or insurance claims at this property in the last 3 years? What carrier currently insures it and at what premium?
- The area grade is low — what's the realistic commute time and amenity access for the typical tenant pool here? Any planned neighborhood developments (good or bad) we should know about?
- What's the average days-on-market for RENTAL listings here right now (not sales)? A rising rental-DOM trend means longer vacancies and softer asking-rent achievability than the comps imply.
- What's the recent tenant-quality profile in this submarket — average credit score on applications, eviction rate, late-payment / NSF rate, and stable-employment percentage? A property-management company in the area should have these aggregated.
- How much new for-sale + rental construction is in the pipeline within 1–3 miles? Heavy new supply typically softens prices + rents 12–24 months out; constrained supply supports both.
Investment metrics
- 1% rule
- 0.73% ✗
- Cap rate
- 5.22%
- Cash-on-cash
- -3.85%
- DSCR
- 0.83
- GRM
- 11.4
CMA / ARV
- ARV (median comp)
- $416,650
- List price
- $330,000
- Delta
- -20.80%
- Verdict
- UNDERPRICED
- Comps
- 20 within 1.0 mi
Show comp detail 12 sales within ~0.75 mi
| Address | Dist | Beds/Ba | Sqft | Sold | Price | $/sf | Match |
|---|---|---|---|---|---|---|---|
| 226 Glenmore Ave | 0.22mi | 4/1.5 (+1) | 1,542 (-4%) | 2mo | $455,000 | $295 | 74 |
| 330 Suter Rd | 0.24mi | 3/2.0 | 1,650 (+3%) | 12mo | $245,000 | $148 | 70 |
| 122 Wyndcrest Ave | 0.33mi | 3/1.0 | 1,461 (-9%) | 3mo | $431,000 | $295 | 67 |
| 6042 Old Frederick Rd | 0.39mi | 3/1.0 | 1,464 (-9%) | 6mo | $375,000 | $256 | 62 |
| 311 N Beaumont Ave | 0.16mi | 4/3.0 (+1) | 1,530 (-5%) | 13mo | $485,000 | $317 | 61 |
| 1300 Rice Ave | 0.29mi | 3/2.0 | 1,422 (-11%) | 5mo | $460,000 | $323 | 59 |
| 1418 Midvale Ave | 0.45mi | 3/1.5 | 1,404 (-12%) | 12mo | $435,000 | $310 | 46 |
| 207 Rosewood Ave | 0.46mi | 3/2.0 | 1,794 (+12%) | 12mo | $455,000 | $254 | 45 |
| 2 Park Dr | 0.62mi | 3/1.5 | 1,834 (+14%) | 1mo | $540,000 | $294 | 44 |
| 614 Southmont Rd | 0.72mi | 3/2.0 | 1,704 (+6%) | 12mo | $492,000 | $289 | 42 |
| 1912 Old Frederick Rd | 0.66mi | 4/2.0 (+1) | 1,744 (+9%) | 6mo | $410,000 | $235 | 40 |
| 1108 Handy Ave | 0.64mi | 3/3.0 | 1,791 (+12%) | 8mo | $425,000 | $237 | 36 |
Match score weights: distance 35% · size 25% · config 20% · recency 20%. Top-matched comps best support the ARV.
Projected returns pro-forma
-3.0% appreciation · 1.87% rent growth · sell at horizon
- IRR
- -24.0%
- Equity multiple
- 0.19×
- Total profit
- $-75,070
- Equity at exit
- $49,204
- IRR
- -22.5%
- Equity multiple
- -0.09×
- Total profit
- $-100,597
- Equity at exit
- $28,532
Cash invested: $92,400 (down + closing). Projections, not guarantees.
Landlord ↔ Tenant lean methodology
- Overall (STATE)
- 27 Tenant-Leaning
- State Maryland
- 27 Tenant-Leaning · D+14
- County
- — inherits STATE
- City
- — inherits STATE
ZIP-level market 21228
- Rents YoY
- 1.9%
- Active inventory
- 144
- Price-to-rent
- 11.4×
Monthly cashflow live
- Estimated rent
- $2,412 high interval (Pro) →
- Mortgage (P&I)
- −$1,731
- Tax from tax record
- −$334 /mo · $4,008/yr
- Insurance
- −$138
- HOA
- −$0
- Vacancy / Maint / Mgmt
- −$507
- Net cashflow
- $-296
Break-even live
UW: 25.0% down · 7.5% · 30yr · 1.5% tax · 5.0% vac · 8.0% maint · 8.0% mgmt
Financing live
Cash to close
- Down payment
- $82,500
- Closing costs
- $9,900
- Reserves months
- —
- Total cash needed
- —
Loan-product check · same deal, 3 products live
Conventional
25% down · 7.5% · 30yr
- Down + closing
- —
- Monthly P&I
- —
- Monthly cashflow
- —
- DSCR
- —
- Eligible?
- —
Personal DTI + credit; lowest rate.
DSCR
20% down · 8.5% · 30yr
- Down + closing
- —
- Monthly P&I
- —
- Monthly cashflow
- —
- DSCR
- —
- Eligible?
- —
No personal income docs; deal must DSCR.
Hard money
10% down · 12.0% · 12mo
- Down + closing
- —
- Monthly P&I
- —
- Monthly cashflow
- —
- DSCR
- —
- Eligible?
- —
Short-term bridge; refi at stabilization.
Rent comps 10 comps
| Address | Beds | Baths | Sqft | Rent | $/sqft | DOM | Units | Dist |
|---|---|---|---|---|---|---|---|---|
| 410 Winters Ln Catonsville, MD | 2.0 | 2.0 | 1296 | $2,000 | $1.54 | 4d | 1 | 0.46mi |
| 436 Westshire Dr Catonsville, MD | 4.0 | 2.0 | 1548 | $2,800 | $1.81 | 43d | 1 | 0.48mi |
| 417 Wheaton Pl Catonsville, MD | 2.0 | 1.0 | 1200 | $2,169 | $1.81 | 3d | 1 | 0.65mi |
| 1200 Alexander Ave Catonsville, MD | 3.0 | 2.5 | 1215 | $2,400 | $1.98 | 43d | 1 | 0.74mi |
| 609 Wallerson Rd Catonsville, MD | 3.0 | 2.0 | 1704 | $3,395 | $1.99 | 20d | 1 | 0.75mi |
| 10 Prestwick Sq Catonsville, MD | 4.0 | 2.5 | 1710 | $2,500 | $1.46 | 17d | 1 | 0.78mi |
| 39 Bloomsbury Ave Unit 1 Catonsville, MD | 2.0 | 1.0 | 1100 | $1,800 | $1.64 | 43d | 1 | 0.89mi |
| 311 Harlem Ln Catonsville, MD | 3.0 | 2.0 | 1152 | $2,300 | $2.00 | 4d | 1 | 0.99mi |
| 1205 Corolla Ct #1205 Catonsville, MD | 4.0 | 3.5 | 1960 | $2,650 | $1.35 | 4d | 1 | 1.16mi |
| 51 Briarwood Rd Catonsville, MD | 3.0 | 1.0 | 1200 | $2,100 | $1.75 | 43d | 1 | 1.43mi |
Listing history 4 events
-
2026-06-19status $330,000 Pending 9 DOM
-
2026-05-15historical
-
2026-05-06$330,000 Active
-
1974-07-29soldstatus $31,900
ⓘ Source: listings_history table (triggers on properties + properties_extension) + one-shot
backfill from property_details.listing_events for pre-trigger history.
Tax reassessment forecast MD · Partial reset (capped growth)
- Current annual tax
- $4,008 · $334/mo
- Projected year-2 tax
- $4,008 · $334/mo
- Expected delta
- $0/yr ($0/mo · 0.0%)
ⓘ Screening estimate from a state-policy table — verify with the county assessor before closing.
Climate risk First Street
- Flood 1/10 Low FEMA zone X (unshaded) · 0% chance over 30 yrs
- Wildfire 2/10 Low
- Heat 6/10 Major 7 d/yr ≥103°F today · 15 d/yr by 30 yrs out
- Wind 4/10 Moderate 18% chance of damaging wind over 30 yrs
- Air quality 3/10 Moderate 3 unhealthy d/yr today · 4 by 30 yrs out
Nearby sold comps map
Loading sold comps map…
Walkable amenities ~0.75 mi
Loading nearby amenities…
Taxation est. · year 1
- Rental income
- $28,948
- − Mortgage interest
- −$18,485
- − Property taxes
- −$4,008
- − Insurance
- −$1,650
- − Repairs & maintenance
- −$2,316
- − Management
- −$2,316
- − Depreciation
- −$9,600
- Taxable loss
- −$9,427
- Est. tax savings @ 24.0%
- +$2,262
- After-tax cash flow
- $-1,293/yr
For passive investors: Depreciation is non-cash, so a rental often shows a tax loss while cash-flowing — sheltering income. Rental losses are passive: they offset passive income freely, and up to $25,000/yr can offset ordinary (W-2) income if you actively participate and your MAGI is under $100k (phasing out to $0 by $150k); unused losses carry forward. On sale, claimed depreciation is recaptured at up to 25%, and gains may owe capital-gains tax (a 1031 exchange can defer both). Figures are a year-1 estimate at your 24.0% rate — not tax advice; consult a CPA.
Schools (NCES district)
- District
- Baltimore County Public Schools
- NCES district ID
- 2400120
- Math proficiency
- 15% ▼ -16.00%
- Reading proficiency
- 34% ▼ -5.00%
- Median HH income
- $66,746
- Composite
- 23.17/100
- National rank
- #7948
- State rank
- #11 of 24 in MD
Livability — Catonsville
- Score
- 81/100
- State rank
- #43
- US rank
- #1586
Category grades
Schools grade is shown separately in the Schools card above.
Census & demographics
- Census place
- Catonsville, MD
- County
- Baltimore County · 769,527 people
- City population
- 50,492
- Metro
- Baltimore-Columbia-Towson, MD
- Population (ZIP)
- 50,492
- Household income
- $112,656
- Rent vs Own
- Severe rent burden
- 1820.0
Population outlook (Baltimore County) Hauer SSP2
- Today (2025)
- 885,518 people
- By 2030
- 909,272 · +2.7%
- By 2040
- 951,547 · +7.5%
- By 2050
- 990,955 · +11.9%
- By 2075
- 1,086,411 · +22.7%
- By 2100
- 1,135,078 · +28.2%
Race, ethnicity, and origin ACS 2023
- Neighborhood character
- Diverse neighborhood (Simpson 0.64)
- Race & ethnicity
- White 55% Black 18% Asian 14% Hispanic / Latino 7% Two or more races 7%
- Hispanic origin (detail)
- Mexican 1%
- Common ancestry
- Romanian 3% Italian 2% Slovak 2%
- Foreign-born
- 16% · Canada, Philippines, Vietnam
- Languages at home
- 81% English-only · Other Indo-European 7% Spanish 5% Other Asian/Pacific 2%
Political lean MEDSL · Baltimore
- 2024 margin
- Strong D (+24.5) · D 61.0% · R 36.5% · Other 2.5%
- 2008→2024 swing
- +9.9pp toward D · 2008: 14.6pp · 2024: 24.5pp
- All cycles
- 2024: D+24.5 2020: D+27.0 2016: D+17.4 2012: D+16.4 2008: D+14.6
Not yet ingested
- Civics
- —
Market trends
- HPI YoY
- ▼ -370.51%
- Current HPI
- 282.1593
- Rent YoY
- ▲ 1.87%
- Metro
- Baltimore-Columbia-Towson, MD
- State GDP YoY
- ▲ 2.97%
- F500 in state
- 12
Industry mix (Fortune 500 HQ in MD)
| Industry | F500 HQs | Revenue |
|---|---|---|
| Aerospace / Defense | 1 | $71B |
|
||
| Utilities | 1 | $25B |
|
||
| Hotels | 1 | $24B |
|
||
| Consumer Goods | 1 | $7B |
|
||
| Real Estate | 1 | $6B |
|
||
| Chemicals | 1 | $2B |
|
||
Price history
+934.5% since first listed4 events — show timeline
- 2026-05-19 Relisted — BRIGHT MLS
- 2026-05-15 Listing Removed — BRIGHT MLS
- 2026-05-06 Listed $330,000 BRIGHT MLS
- 1974-07-29 Sold (Public Records) $31,900 Public Records
Property tax history
+3.8%/yrLatest (2025): $4,008 · +13.1% YoY. Source: county tax records.
Cash-flow waterfall
monthlySold comps — $/sqft
last 12 mo · ≤1 miLoading sold comps…