 Multi-family
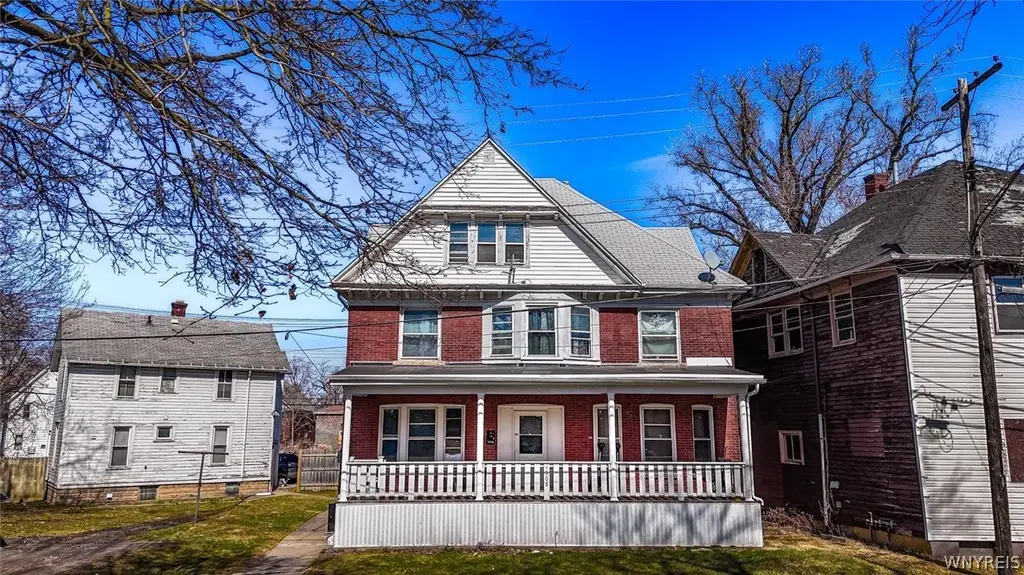
1308 South Ave · Niagara Falls, NY
Flood risk 1/10 · Minimal
- FEMA flood zone
- X (unshaded)
- Chance of flooding over 30 yrs
- 0.0%
- Est. flood insurance / yr
- $473 – $860
Fire risk 2/10 · Minimal
- Est. fire insurance / yr
- $691 – $1,283
Heat risk 2/10 · Minimal
- Hot days now (above 94°F)
- 7 days/yr
- Hot days in 30 yrs
- 15 days/yr
Wind risk 1/10 · Minimal
- Chance of severe wind over 30 yrs
- —
Air-quality risk 3/10 · Minor
- Unhealthy air days now
- 2 days/yr
- Unhealthy air days in 30 yrs
- 3 days/yr
Risk factors via First Street. Map © Google.
Why this score? — see what drove the D- grade
The composite is a weighted blend of 9 inputs, each scored 0–100. Each bar is that input's sub-score; the figure is the points it added to the 100-point composite (weight × sub-score).
- Cash flow +15.0/30.0
- 1% rule +5.0/10.0
- DSCR +5.0/10.0
- Livability +3.0/5.0
- Rent growth +2.5/5.0
- Schools +2.5/10.0
- Condition / age +2.5/5.0
- ARV discount +0.0/15.0
- Appreciation +0.0/10.0
$200,000
🖨 Deal sheet 📄 Offer letter ✓ Due diligence
Multi-family units
County records classify this as Multi-Family (2-4 Unit). Listing-text estimate: 1 unit. estimate disagrees with records
Listing remarks MLS
WELCOME TO 1308 SOUTH AVE Exceptional investment opportunity in Niagara Falls! This multi-unit brick property is located in an Airbnb zoning area, offering great potential as a bed & breakfast or short-term rental. Featuring 10 rooms, 3 bathrooms, and 2 kitchens, the property is currently generating $3,000 in monthly income from 7 rented rooms (5 at $400 each and 2 at $500 each), with 3 additional rooms still available for rent. The sale also includes two extra lots, right across from the property 1308 south Ave providing even more value and potential. Don't miss out on this versatile income-producing property!
Key facts
- Two extra lots
- Airbnb zoning area
- 2,880 sq ft lot
Tags
Neighborhood map
What this means for you Summary
Snapshot
- This is a 6-bed/2.0-bath multifamily listed at $200k.
Deal economics
- At list price, monthly cash flow is $7k ($84k/yr) — positive.
- The deal already cash-flows at list — no discount required.
- Meets the 1% rule at list price ($10k rent vs $200k).
- Recommended offer: $188k (6.0% below list) — sets the bar for market timing.
- Cap rate 48.1% vs local median 7.7% in Niagara Falls — top-decile yield for the area; either an underpriced asset or a hidden risk that comps aren't pricing in. Stress-test before assuming the spread holds.
Location & tenants
- Location reads 60/100 on livability (#956 in NY) — a middle-class / working-renter tenant base. Strengths: cost of living A+, housing A+; Watch: schools F, crime F, amenities F.
- Niagara Falls City School District (urban): math 26% / reading 34% proficiency, ranked #578 of 590 in NY (top 98%) — families likely to look elsewhere, expect single-tenant / working-renter base with shorter leases; 66% free/reduced lunch — lower-income household profile, screen leases tightly.
- Market conditions: 142 active listings in the ZIP; 167 units permitted in Niagara County in 2024 (0 in 5+ unit buildings).
- At $10,499/mo this rent would consume 247% of the median local household income ($51k/yr) (locally 1095% of renters already pay >50% of income on rent) — very limited rent-growth headroom before tenants either downsize or default.
Forward outlook
- Local home prices are declining (-3.0%/yr); year-one equity from $1k of loan paydown is wiped out by about $6k of value loss. Plan a longer hold.
- Niagara County population projected at -19% by 2050 — secular population decline; favor cash flow + early exit over multi-decade hold.
- At projected returns (-3.0% appreciation + 3.0% rent growth), your $56k cash investment doubles in ~1 year — after that, you're playing with house money.
Negotiation context
- It's been on market 82 days — a 6% lower offer ($188k) is reasonable based on typical stale-listing flexibility.
- 3 sale attempts since 2y ago with the ask held roughly flat each time — persistent listings suggest the price (not the market) is what's stuck; bring a comps-based counter.
- Current owner paid $100k; list at $200k implies a 100% gain — meaningful room to come down on a strong offer.
Risks & watch-outs
- Watch-outs: built in 1912 — expect roof / HVAC / electrical / plumbing capex.
Questions for the listing agent
- It's been on market 82 days. Have you received any prior offers? Is the seller open to a 6% concession, seller financing, or rate buy-down credit?
- Built in 1912 — when were the roof, HVAC, electrical panel, plumbing, and water heater last replaced?
- Why hasn't it sold? Are there any deal-killer items the seller is aware of (foundation, flood, title, zoning, code violations)?
- Is there a deadline driving the sale (1031 exchange, divorce, estate, relocation)? That informs how much negotiation room exists.
- Schools are F-rated, which usually means shorter tenancies and higher turnover. Who's the typical renter profile here, and what's been the actual vacancy rate?
- Crime grade is F in this area — have there been break-ins, vandalism, or insurance claims at this property in the last 3 years? What carrier currently insures it and at what premium?
- The area grade is low — what's the realistic commute time and amenity access for the typical tenant pool here? Any planned neighborhood developments (good or bad) we should know about?
- What's the average days-on-market for RENTAL listings here right now (not sales)? A rising rental-DOM trend means longer vacancies and softer asking-rent achievability than the comps imply.
- What's the recent tenant-quality profile in this submarket — average credit score on applications, eviction rate, late-payment / NSF rate, and stable-employment percentage? A property-management company in the area should have these aggregated.
- How much new apartment / multifamily construction is in the pipeline within 1–3 miles? Heavy new supply (>2% of stock underway) typically softens rents 12–24 months out; light construction supports rent growth.
Investment metrics
- 1% rule
- 5.25% ✓
- Cap rate
- 48.14%
- Cash-on-cash
- 149.46%
- DSCR
- 7.65
- GRM
- 1.6
CMA / ARV
- ARV (median comp)
- $151,469
- List price
- $200,000
- Delta
- 32.04%
- Verdict
- OVERPRICED
- Comps
- 20 within 1.0 mi
Show comp detail 12 sales within ~0.75 mi
| Address | Dist | Beds/Ba | Sqft | Sold | Price | $/sf | Match |
|---|---|---|---|---|---|---|---|
| 1635 South Ave | 0.27mi | 5/2.0 (-1) | 2,208 (+0%) | 2mo | $85,000 | $38 | 80 |
| 1145 Willow Ave | 0.23mi | 6/2.0 | 2,304 (+4%) | 3mo | $53,300 | $23 | 80 |
| 2225 Whitney Ave | 0.68mi | 6/2.0 | 2,200 (-0%) | 3mo | $125,000 | $57 | 65 |
| 814 Willow Ave | 0.41mi | 5/2.0 (-1) | 2,072 (-6%) | 2mo | $140,000 | $68 | 64 |
| 1825 Pierce Ave | 0.51mi | 6/2.0 | 2,288 (+4%) | 10mo | $110,000 | $48 | 61 |
| 1813 South Ave | 0.38mi | 6/2.0 | 2,436 (+10%) | 6mo | $137,940 | $57 | 60 |
| 2133 North Ave | 0.59mi | 6/2.0 | 2,048 (-7%) | 9mo | $170,000 | $83 | 53 |
| 1023 15th St | 0.49mi | 5/4.0 (-1) | 2,304 (+4%) | 5mo | $190,000 | $82 | 53 |
| 1811 Weston Ave | 0.38mi | 5/3.0 (-1) | 1,998 (-9%) | 6mo | $140,000 | $70 | 52 |
| 2200 Lasalle Ave | 0.66mi | 5/2.0 (-1) | 2,304 (+4%) | 12mo | $160,000 | $69 | 46 |
| 1113 Whitney Ave | 0.38mi | 7/3.0 (+1) | 2,504 (+14%) | 8mo | $48,000 | $19 | 44 |
| 1882 Niagara Ave | 0.53mi | 5/2.5 (-1) | 2,527 (+15%) | 0mo | $155,000 | $61 | 44 |
Match score weights: distance 35% · size 25% · config 20% · recency 20%. Top-matched comps best support the ARV.
Projected returns pro-forma
-3.0% appreciation · 3.0% rent growth · sell at horizon
- IRR
- —
- Equity multiple
- 8.36×
- Total profit
- $411,954
- Equity at exit
- $29,821
- IRR
- —
- Equity multiple
- 17.63×
- Total profit
- $931,243
- Equity at exit
- $17,292
Cash invested: $56,000 (down + closing). Projections, not guarantees.
Landlord ↔ Tenant lean methodology
- Overall (STATE)
- 15 Strongly Tenant-Friendly
- State New York
- 15 Strongly Tenant-Friendly · D+10
- County
- — inherits STATE
- City
- — inherits STATE
ZIP-level market 14305
- Home prices YoY
- -10.9%
- Active inventory
- 142
- Price-to-rent
- 15.9×
Monthly cashflow live
- Estimated rent
- $10,499 high interval (Pro) →
- Mortgage (P&I)
- −$1,049
- Tax from tax record
- −$187 /mo · $2,244/yr
- Insurance
- −$83
- HOA
- −$0
- Vacancy / Maint / Mgmt
- −$2,205
- Net cashflow
- $6,975
Break-even live
10-unit breakdown (identical units grouped — click to expand)
| Units | Beds | Baths | Est. rent |
|---|---|---|---|
| 10× units | 1 | 1 | $10,500 |
| #1 | 1 | 1 | $1,050 |
| #2 | 1 | 1 | $1,050 |
| #3 | 1 | 1 | $1,050 |
| #4 | 1 | 1 | $1,050 |
| #5 | 1 | 1 | $1,050 |
| #6 | 1 | 1 | $1,050 |
| #7 | 1 | 1 | $1,050 |
| #8 | 1 | 1 | $1,050 |
| #9 | 1 | 1 | $1,050 |
| #10 | 1 | 1 | $1,050 |
| Total (10 units) | $10,499 | ||
UW: 25.0% down · 7.5% · 30yr · 1.5% tax · 5.0% vac · 8.0% maint · 8.0% mgmt
Financing live
Cash to close
- Down payment
- $50,000
- Closing costs
- $6,000
- Reserves months
- —
- Total cash needed
- —
Loan-product check · same deal, 3 products live
Conventional
25% down · 7.5% · 30yr
- Down + closing
- —
- Monthly P&I
- —
- Monthly cashflow
- —
- DSCR
- —
- Eligible?
- —
Personal DTI + credit; lowest rate.
DSCR
20% down · 8.5% · 30yr
- Down + closing
- —
- Monthly P&I
- —
- Monthly cashflow
- —
- DSCR
- —
- Eligible?
- —
No personal income docs; deal must DSCR.
Hard money
10% down · 12.0% · 12mo
- Down + closing
- —
- Monthly P&I
- —
- Monthly cashflow
- —
- DSCR
- —
- Eligible?
- —
Short-term bridge; refi at stabilization.
Listing history 23 events
-
2026-06-18days on market $200,000 Active 82 DOM
-
2026-06-17days on market $200,000 Active 81 DOM
-
2026-06-16days on market $200,000 Active 80 DOM
-
2026-06-15days on market $200,000 Active 79 DOM
-
2026-06-13days on market $200,000 Active 77 DOM
-
2026-06-13days on market $200,000 Active 76 DOM
-
2026-06-10days on market $200,000 Active 74 DOM
-
2026-06-09days on market $200,000 Active 73 DOM
-
2026-06-08days on market $200,000 Active 72 DOM
-
2026-06-07days on market $200,000 Active 71 DOM
-
2026-06-03days on market $200,000 Active 67 DOM
-
2026-06-02days on market $200,000 Active 66 DOM
-
2026-06-01days on market $200,000 Active 65 DOM
-
2026-05-31days on market $200,000 Active 64 DOM
-
2026-03-29$200,000 Active 624-char remark
Show marketing remark (624 chars)
WELCOME TO 1308 SOUTH AVE Exceptional investment opportunity in Niagara Falls! This multi-unit brick property is located in an Airbnb zoning area, offering great potential as a bed & breakfast or short-term rental. Featuring 10 rooms, 3 bathrooms, and 2 kitchens, the property is currently generating $3,000 in monthly income from 7 rented rooms (5 at $400 each and 2 at $500 each), with 3 additional rooms still available for rent. The sale also includes two extra lots, right across from the property 1308 south Ave providing even more value and potential. Don't miss out on this versatile income-producing property!
-
2025-06-19historical
-
2025-06-09price $223,000
-
2025-05-15price $225,000
-
2025-04-03$230,000 Active
-
2024-10-15historical
-
2024-06-18$199,900 Active
-
2023-03-22soldstatus $100,000
-
2018-03-16soldstatus $40,000
ⓘ Source: listings_history table (triggers on properties + properties_extension) + one-shot
backfill from property_details.listing_events for pre-trigger history.
Tax reassessment forecast NY · Partial reset (capped growth)
- Current annual tax
- $2,244 · $187/mo
- Projected year-2 tax
- $2,812 · $234/mo
- Expected delta
- +$568/yr (+$47/mo · 25.3%)
ⓘ Screening estimate from a state-policy table — verify with the county assessor before closing.
Climate risk First Street
- Flood 1/10 Low FEMA zone X (unshaded) · 0% chance over 30 yrs
- Wildfire 2/10 Low
- Heat 2/10 Low 7 d/yr ≥94°F today · 15 d/yr by 30 yrs out
- Wind 1/10 Low
- Air quality 3/10 Moderate 2 unhealthy d/yr today · 3 by 30 yrs out
Nearby sold comps map
Loading sold comps map…
Walkable amenities ~0.75 mi
Loading nearby amenities…
Taxation est. · year 1
- Rental income
- $125,988
- − Mortgage interest
- −$11,203
- − Property taxes
- −$2,244
- − Insurance
- −$1,000
- − Repairs & maintenance
- −$10,079
- − Management
- −$10,079
- − Depreciation
- −$5,818
- Taxable income
- $85,564
- Est. tax owed @ 24.0%
- −$20,535
- After-tax cash flow
- $63,165/yr
For passive investors: Depreciation is non-cash, so a rental often shows a tax loss while cash-flowing — sheltering income. Rental losses are passive: they offset passive income freely, and up to $25,000/yr can offset ordinary (W-2) income if you actively participate and your MAGI is under $100k (phasing out to $0 by $150k); unused losses carry forward. On sale, claimed depreciation is recaptured at up to 25%, and gains may owe capital-gains tax (a 1031 exchange can defer both). Figures are a year-1 estimate at your 24.0% rate — not tax advice; consult a CPA.
Schools (NCES district)
- District
- Niagara Falls City School District
- NCES district ID
- 3620820
- Math proficiency
- 26% ▼ -10.00%
- Reading proficiency
- 34% ▲ 3.00%
- Median HH income
- $32,488
- Composite
- 24.5/100
- National rank
- #7655
- State rank
- #578 of 590 in NY
Livability — Niagara Falls
- Score
- 60/100
- State rank
- #956
- US rank
- #18749
Category grades
Schools grade is shown separately in the Schools card above.
Census & demographics
- Census place
- Niagara Falls, NY
- County
- Niagara County · 157,377 people
- City population
- 62,983
- Metro
- Buffalo-Cheektowaga, NY
- Population (ZIP)
- 16,696
- Household income
- $51,004
- Rent vs Own
- Severe rent burden
- 1095.0
Population outlook (Niagara County) Hauer SSP2
- Today (2025)
- 204,149 people
- By 2030
- 197,900 · -3.1%
- By 2040
- 182,239 · -10.7%
- By 2050
- 165,198 · -19.1%
- By 2075
- 129,416 · -36.6%
- By 2100
- 96,222 · -52.9%
Race, ethnicity, and origin ACS 2023
- Neighborhood character
- Diverse neighborhood (Simpson 0.63)
- Race & ethnicity
- White 55% Black 24% Two or more races 13% Hispanic / Latino 8% Asian 1% Native American 1%
- Hispanic origin (detail)
- Puerto Rican 4%
- Common ancestry
- Romanian 6% Slovak 2% Lithuanian 2%
- Foreign-born
- 6% · Canada, Jamaica
- Languages at home
- 93% English-only · Spanish 4% Other Indo-European 1%
Political lean MEDSL · Niagara
- 2024 margin
- R (+14.9) · D 42.5% · R 57.5%
- 2008→2024 swing
- -15.9pp toward R · 2008: 1.0pp · 2024: -14.9pp
- All cycles
- 2024: R+14.9 2020: R+9.7 2016: R+19.0 2012: D+0.6 2008: D+1.0
Not yet ingested
- Civics
- —
Market trends
- HPI YoY
- ▼ -43.08%
- Current HPI
- 350.8741
- Rent YoY
- —
- Metro
- Buffalo-Cheektowaga, NY
- State GDP YoY
- ▲ 2.60%
- F500 in state
- 92
Industry mix (Fortune 500 HQ in NY)
| Industry | F500 HQs | Revenue |
|---|---|---|
| Financial Services | 10 | $950B |
|
||
| Consumer Goods | 9 | $162B |
|
||
| Insurance | 4 | $225B |
|
||
| Telecommunications | 2 | $144B |
|
||
| Pharmaceuticals | 2 | $112B |
|
||
| Media / Entertainment | 2 | $69B |
|
||
Price history
+400.0% since first listed9 events — show timeline
- 2026-03-29 Listed $200,000 WNYREIS
- 2025-06-19 Listing Removed — WNYREIS
- 2025-06-09 Price Changed $223,000 WNYREIS
- 2025-05-15 Price Changed $225,000 WNYREIS
- 2025-04-03 Listed $230,000 WNYREIS
- 2024-10-15 Listing Removed — WNYREIS
- 2024-06-18 Listed $199,900 WNYREIS
- 2023-03-22 Sold (Public Records) $100,000 Public Records
- 2018-03-16 Sold (Public Records) $40,000 Public Records
Property tax history
+8.3%/yrLatest (2025): $2,244 · +54.2% YoY. Source: county tax records.
Cash-flow waterfall
monthlySold comps — $/sqft
last 12 mo · ≤1 miLoading sold comps…