 🏗️ New Construction
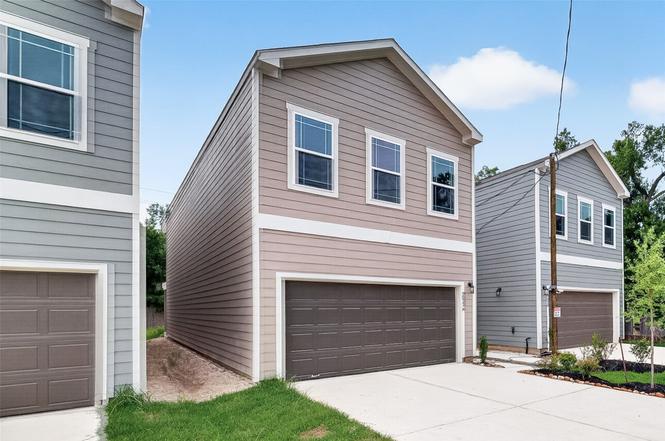
9022 Madera Rd Unit A · Houston, TX
Flood risk 1/10 · Minimal
- FEMA flood zone
- X (unshaded)
- Chance of flooding over 30 yrs
- 0.0%
- Est. flood insurance / yr
- $507 – $1,088
Fire risk 5/10 · Moderate
- Est. fire insurance / yr
- $1,222 – $2,270
Heat risk 9/10 · Severe
- Hot days now (above 110°F)
- 7 days/yr
- Hot days in 30 yrs
- 25 days/yr
Wind risk 9/10 · Severe
- Chance of severe wind over 30 yrs
- 99.0%
Air-quality risk 3/10 · Minor
- Unhealthy air days now
- 3 days/yr
- Unhealthy air days in 30 yrs
- 3 days/yr
Risk factors via First Street. Map © Google.
Why this score? — see what drove the D+ grade
The composite is a weighted blend of 9 inputs, each scored 0–100. Each bar is that input's sub-score; the figure is the points it added to the 100-point composite (weight × sub-score).
- Cash flow +15.8/30.0
- ARV discount +7.5/15.0
- Appreciation +6.2/10.0
- DSCR +4.9/10.0
- Livability +3.7/5.0
- 1% rule +3.2/10.0
- Schools +2.7/10.0
- Rent growth +2.5/5.0
- Condition / age +2.5/5.0
$204,990
🖨 Deal sheet 📄 Offer letter ✓ Due diligence
Listing remarks
Don't miss out on this new construction home featuring 3 bedrooms, 2.5 bathrooms, and a spacious backyard perfect for entertaining guests and hosting BBQ for your loved ones. This property offers an open floor plan, stylish finishes, kitchen with island and plenty of natural light. Perfect for easy living and entertaining! Location is unbeatable, easy access to Belway 8 East and Freeway 59 20 minutes drive to Downtown and IAH Airport. Conveniently located near shopping centers, malls and restaurants.
Key facts
- Open floor plan
- Spacious backyard
- Natural light
Tags
Property features AI
Exterior
- Parking: Attached 2-car garage; Additional parking available
- Security: Smoke detectors
- Utilities: Public water; Public sewer
- Home design: Residential property; New construction; Slab foundation
- Construction: Built in 2026; Cement siding; Composition roof
- Exterior features: Private yard; Subdivision setting
Interior
- Kitchen: Dishwasher; Electric cooktop; Free-standing range; Disposal; Microwave; Oven
- Bedrooms: First-floor bedroom (11 x 11); Second-floor bedroom (11 x 13); Second-floor primary bedroom (12 x 19)
- Flooring: Carpet; Tile; Vinyl
- Bathrooms: 2 full bathrooms; 1 half bathroom
- Heating & cooling: Central heating (electric); Central air (electric)
- Interior features: Double vanity; Kitchen island; Primary bedroom with private bath; Pantry; Quartz countertops; Tub with shower; Ceiling fans; Kitchen/dining combo
- Laundry & utility: Washer hookup; Electric dryer hookup; Gas dryer hookup
Neighborhood map
What this means for you Summary
Snapshot
- This is a 3-bed/2.5-bath other listed at $205k.
Deal economics
- At list price, monthly cash flow is $95 ($1k/yr) — positive.
- The deal already cash-flows at list — no discount required.
- To meet the 1% rule (rent ≥ 1% of price), the offer needs to be $168k (18.0% below list).
- Recommended offer: $168k (18.0% below list) — sets the bar for 1% rule.
- Cap rate 6.8% vs local median 3.2% in Houston — top-decile yield for the area; either an underpriced asset or a hidden risk that comps aren't pricing in. Stress-test before assuming the spread holds.
Location & tenants
- Location reads 74/100 on livability (#184 in TX, #4,771 nationally) — a middle-class / working-renter tenant base. Strengths: amenities A+, cost of living A+, housing A+; Watch: crime F.
- Houston ISD (urban): math 27% / reading 35% proficiency, ranked #593 of 826 in TX (top 72%) — families likely to look elsewhere, expect single-tenant / working-renter base with shorter leases; 71% free/reduced lunch — lower-income household profile, screen leases tightly.
- Zoned schools: Forest Brook Middle (math 12% / reading 14%, grade F, #1,609 of 1,662 statewide, top 97%, 613 students, 98% FRL); North Forest H S (math 13% / reading 18%, grade F, #1,505 of 1,632 statewide, top 92%, 974 students, 97% FRL) — zoned schools average 98% FRL vs 71% district-wide (27 pts higher); higher-poverty schools than district average — tighter screening recommended.
- Zoned-school proficiency averages 14% at this address vs 31% district-wide (-17 pts) — the specific schools serving this property underperform the Houston ISD average; the district grade overstates school quality for this exact location.
- Market conditions: 129 active listings in the ZIP; 30 comparable units currently listed for rent nearby; rentals at typical pace (median 25d on market — plan ~3-4 weeks tenant-placement turnaround); 47% of comp listings sitting > 30 days — soft ceiling on asking rent; lower-income renter base — watch delinquency; 29,883 units permitted in Harris County in 2024 (8,621 in 5+ unit buildings).
- At $1,682/mo this rent would consume 52% of the median local household income ($39k/yr) (locally 780% of renters already pay >50% of income on rent) — very limited rent-growth headroom before tenants either downsize or default.
Forward outlook
- In year one you build about $7k of equity ($1k loan paydown + $5k appreciation (2.5% local appreciation)).
- Harris County population projected at +47% by 2050 — long-run rental-demand tailwind backs the buy-and-hold thesis.
- At projected returns (2.5% appreciation + 3.0% rent growth), your $57k cash investment doubles in ~7 years — after that, you're playing with house money.
- By year 6, paydown + projected appreciation supports a ~$35k cash-out refi (75% LTV) — recoverable capital for the next deal without selling this one.
Negotiation context
- Only 8 days on market — expect competitive offers; lowballing is unlikely to land.
Risks & watch-outs
- Climate carrying-cost: severe wind risk, 99% chance of damaging wind over 30y; moderate wildfire risk; extreme-heat days projected 7→25/yr by 2055 (HVAC capex compounding) — expect insurance premiums to compound above CPI over the hold.
Questions for the listing agent
- Is there a deadline driving the sale (1031 exchange, divorce, estate, relocation)? That informs how much negotiation room exists.
- Schools are D-rated, which usually means shorter tenancies and higher turnover. Who's the typical renter profile here, and what's been the actual vacancy rate?
- Crime grade is F in this area — have there been break-ins, vandalism, or insurance claims at this property in the last 3 years? What carrier currently insures it and at what premium?
- The area grade is low — what's the realistic commute time and amenity access for the typical tenant pool here? Any planned neighborhood developments (good or bad) we should know about?
- What's the average days-on-market for RENTAL listings here right now (not sales)? A rising rental-DOM trend means longer vacancies and softer asking-rent achievability than the comps imply.
- What's the recent tenant-quality profile in this submarket — average credit score on applications, eviction rate, late-payment / NSF rate, and stable-employment percentage? A property-management company in the area should have these aggregated.
- How much new for-sale + rental construction is in the pipeline within 1–3 miles? Heavy new supply typically softens prices + rents 12–24 months out; constrained supply supports both.
Investment metrics
- 1% rule
- 0.82% ✗
- Cap rate
- 6.85%
- Cash-on-cash
- 1.98%
- DSCR
- 1.09
- GRM
- 10.2
CMA / ARV
No comps found within radius.
Projected returns pro-forma
2.5% appreciation · 3.0% rent growth · sell at horizon
- IRR
- 7.9%
- Equity multiple
- 1.44×
- Total profit
- $25,228
- Equity at exit
- $86,423
- IRR
- 10.8%
- Equity multiple
- 2.54×
- Total profit
- $88,138
- Equity at exit
- $128,879
Cash invested: $57,397 (down + closing). Projections, not guarantees.
Landlord ↔ Tenant lean methodology
- Overall (STATE)
- 87 Strongly Landlord-Friendly
- State Texas
- 87 Strongly Landlord-Friendly · R+5
- County
- — inherits STATE
- City
- — inherits STATE
ZIP-level market 77078
- Home prices YoY
- 0.8%
- Active inventory
- 129
- Price-to-rent
- 10.2×
Monthly cashflow live
- Estimated rent
- $1,682 high interval (Pro) →
- Mortgage (P&I)
- −$1,075
- Tax from tax record
- −$73 /mo · $881/yr
- Insurance
- −$85
- HOA
- −$0
- Vacancy / Maint / Mgmt
- −$353
- Net cashflow
- $95
Break-even live
UW: 25.0% down · 7.5% · 30yr · 1.5% tax · 5.0% vac · 8.0% maint · 8.0% mgmt
Financing live
Cash to close
- Down payment
- $51,248
- Closing costs
- $6,150
- Reserves months
- —
- Total cash needed
- —
Loan-product check · same deal, 3 products live
Conventional
25% down · 7.5% · 30yr
- Down + closing
- —
- Monthly P&I
- —
- Monthly cashflow
- —
- DSCR
- —
- Eligible?
- —
Personal DTI + credit; lowest rate.
DSCR
20% down · 8.5% · 30yr
- Down + closing
- —
- Monthly P&I
- —
- Monthly cashflow
- —
- DSCR
- —
- Eligible?
- —
No personal income docs; deal must DSCR.
Hard money
10% down · 12.0% · 12mo
- Down + closing
- —
- Monthly P&I
- —
- Monthly cashflow
- —
- DSCR
- —
- Eligible?
- —
Short-term bridge; refi at stabilization.
Rent comps 30 comps
| Address | Beds | Baths | Sqft | Rent | $/sqft | DOM | Units | Dist |
|---|---|---|---|---|---|---|---|---|
| 9218 Nyssa St Unit B Houston, TX | 3.0 | 2.5 | 1608 | $1,490 | $0.93 | 2d | 1 | 0.25mi |
| 9526 Balsam Ln Houston, TX | 3.0 | 1.5 | 1533 | $1,475 | $0.96 | 5d | 1 | 0.48mi |
| 9517 Madera Rd Houston, TX | 3.0 | 2.0 | 1608 | $1,500 | $0.93 | 43d | 1 | 0.55mi |
| 9393 Tidwell Rd Houston, TX | 3.0–4.0 | 2.0 | 1135 | $1,244 | $1.10 | 1d | 10 | 0.66mi |
| 9702 Hillis St Houston, TX | 3.0 | 2.0 | 1612 | $1,550 | $0.96 | 43d | 1 | 0.71mi |
| 8711 Southwark St Unit A Houston, TX | 3.0 | 2.0 | 1150 | $1,750 | $1.52 | 43d | 1 | 0.87mi |
| 8314 Madera Rd Unit B Houston, TX | 3.0 | 2.5 | 1608 | $1,495 | $0.93 | 24d | 1 | 0.88mi |
| 9222 Hillis St Houston, TX | 3.0 | 2.0 | 1498 | $1,850 | $1.23 | 43d | 1 | 1.00mi |
| 8214 Parker Rd Unit B Houston, TX | 3.0 | 2.0 | 1608 | $1,560 | $0.97 | 7d | 1 | 1.05mi |
| 8235 Locksley Rd Unit A Houston, TX | 3.0 | 2.5 | 1608 | $1,525 | $0.95 | 7d | 1 | 1.07mi |
| 8213 Bigwood St Unit A Houston, TX | 3.0 | 2.5 | 1150 | $1,595 | $1.39 | 43d | 1 | 1.07mi |
| 8631 Homewood Ln Unit B Houston, TX | 3.0 | 3.0 | 1500 | $1,850 | $1.23 | 43d | 1 | 1.10mi |
| 8631 Homewood Ln Unit A Houston, TX | 3.0 | 2.5 | 1500 | $1,850 | $1.23 | 43d | 1 | 1.10mi |
| 8627 Homewood Ln Unit B Houston, TX | 3.0 | 2.5 | 1500 | $1,850 | $1.23 | 43d | 1 | 1.11mi |
| 8625 Homewood Ln Unit B Houston, TX | 3.0 | 3.0 | 1500 | $1,850 | $1.23 | 43d | 1 | 1.11mi |
| 8623 Homewood Ln Unit B Houston, TX | 3.0 | 2.5 | 1150 | $1,850 | $1.61 | 18d | 1 | 1.11mi |
| 8623 Homewood Unit A Houston, TX | 3.0 | 2.5 | 1150 | $1,850 | $1.61 | 43d | 1 | 1.11mi |
| 9930 Valley Lake Dr Houston, TX | 4.0 | 2.0 | 1385 | $1,795 | $1.30 | 43d | 1 | 1.12mi |
| 9133 Woodlyn Rd Houston, TX | 3.0 | 1.0 | 1073 | $1,495 | $1.39 | 3d | 1 | 1.14mi |
| 9137 Woodlyn Rd Houston, TX | 3.0 | 1.0 | 1568 | $1,550 | $0.99 | 20d | 1 | 1.14mi |
| 8126 Sterlingshire St Unit B Houston, TX | 3.0 | 2.0 | 1150 | $1,350 | $1.17 | 24d | 1 | 1.15mi |
| 8122 Sterlingshire St Unit A Houston, TX | 3.0 | 2.0 | 1160 | $1,525 | $1.31 | 15d | 1 | 1.16mi |
| 8122 Sterlingshire St Unit B Houston, TX | 3.0 | 2.0 | 1160 | $1,450 | $1.25 | 15d | 1 | 1.16mi |
| 8102 Rhobell St Unit A Houston, TX | 4.0 | 3.5 | 1567 | $1,750 | $1.12 | 43d | 1 | 1.20mi |
| 9334 Crestview Dr Houston, TX | 4.0 | 2.5 | 1899 | $1,745 | $0.92 | 5d | 1 | 1.25mi |
| 9943 Valley Wind Dr Houston, TX | 3.0 | 2.0 | 1319 | $1,595 | $1.21 | 2d | 1 | 1.30mi |
| 8602 Wilkins Oaks Dr Houston, TX | 3.0 | 2.0 | 1307 | $1,775 | $1.36 | 43d | 1 | 1.32mi |
| 8638 Doris Oaks Cir Houston, TX | 3.0 | 3.0 | 1777 | $1,975 | $1.11 | 43d | 1 | 1.32mi |
| 8523 Brock Park Blvd Unit 1 Houston, TX | 3.0 | 1.5 | 1130 | $1,375 | $1.22 | 5d | 1 | 1.35mi |
| 8238 Homewood Ln Houston, TX | 3.0 | 2.0 | 1696 | $1,695 | $1.00 | 24d | 1 | 1.50mi |
Listing history 6 events
-
2026-06-18days on market $204,990 Active 8 DOM
-
2026-06-17days on market $204,990 Active 7 DOM
-
2026-06-16days on market $204,990 Active 6 DOM
-
2026-06-15days on market $204,990 Active 5 DOM
-
2026-06-13remarks 505-char remark
-
2026-06-13$204,990 Active 3 DOM
ⓘ Source: listings_history table (triggers on properties + properties_extension) + one-shot
backfill from property_details.listing_events for pre-trigger history.
Tax reassessment forecast TX · Resets to sale price
- Current annual tax
- $881 · $73/mo
- Projected year-2 tax
- $3,751 · $313/mo
- Expected delta
- +$2,871/yr (+$239/mo · 326.0%)
ⓘ Screening estimate from a state-policy table — verify with the county assessor before closing.
Climate risk First Street
- Flood 1/10 Low FEMA zone X (unshaded) · 0% chance over 30 yrs
- Wildfire 5/10 Major
- Heat 9/10 Extreme 7 d/yr ≥110°F today · 25 d/yr by 30 yrs out
- Wind 9/10 Extreme 99% chance of damaging wind over 30 yrs
- Air quality 3/10 Moderate 3 unhealthy d/yr today · 3 by 30 yrs out
Nearby sold comps map
Loading sold comps map…
Walkable amenities ~0.75 mi
Loading nearby amenities…
Taxation est. · year 1
- Rental income
- $20,178
- − Mortgage interest
- −$11,483
- − Property taxes
- −$881
- − Insurance
- −$1,025
- − Repairs & maintenance
- −$1,614
- − Management
- −$1,614
- − Depreciation
- −$5,963
- Taxable loss
- −$2,402
- Est. tax savings @ 24.0%
- +$576
- After-tax cash flow
- $1,712/yr
For passive investors: Depreciation is non-cash, so a rental often shows a tax loss while cash-flowing — sheltering income. Rental losses are passive: they offset passive income freely, and up to $25,000/yr can offset ordinary (W-2) income if you actively participate and your MAGI is under $100k (phasing out to $0 by $150k); unused losses carry forward. On sale, claimed depreciation is recaptured at up to 25%, and gains may owe capital-gains tax (a 1031 exchange can defer both). Figures are a year-1 estimate at your 24.0% rate — not tax advice; consult a CPA.
Schools (NCES district)
- District
- Houston ISD
- NCES district ID
- 4823640
- Math proficiency
- 27% ▼ -18.00%
- Reading proficiency
- 35% ▼ -6.00%
- Median HH income
- $46,054
- Composite
- 26.63/100
- National rank
- #7173
- State rank
- #593 of 826 in TX
Livability — Houston
- Score
- 74/100
- State rank
- #184
- US rank
- #4771
Category grades
Schools grade is shown separately in the Schools card above.
Census & demographics
- Census place
- Houston, TX
- County
- Harris County · 4,702,590 people
- City population
- 3,226,434
- Metro
- Houston-The Woodlands-Sugar Land, TX
- Population (ZIP)
- 14,247
- Household income
- $39,093
- Rent vs Own
- Severe rent burden
- 780.0
Population outlook (Harris County) Hauer SSP2
- Today (2025)
- 5,571,493 people
- By 2030
- 6,089,821 · +9.3%
- By 2040
- 7,142,806 · +28.2%
- By 2050
- 8,185,864 · +46.9%
- By 2075
- 10,574,329 · +89.8%
- By 2100
- 12,109,958 · +117.4%
Race, ethnicity, and origin ACS 2023
- Race & ethnicity
- Black 49% Hispanic / Latino 46% Two or more races 15% White 5%
- Hispanic origin (detail)
- Mexican 36% Cuban 1%
- Common ancestry
- Italian 1% Hispanic 1%
- Foreign-born
- 24% · Canada
- Languages at home
- 59% English-only · Spanish 41%
Political lean MEDSL · Harris
- 2024 margin
- Lean D (+5.5) · D 52.0% · R 46.4% · Other 1.6%
- 2008→2024 swing
- +3.9pp toward D · 2008: 1.6pp · 2024: 5.5pp
- All cycles
- 2024: D+5.5 2020: D+13.3 2016: D+12.4 2012: D+0.1 2008: D+1.6
Not yet ingested
- Civics
- —
Market trends
- HPI YoY
- ▲ 2.50%
- Current HPI
- 307.0842
- Rent YoY
- —
- Metro
- Houston-The Woodlands-Sugar Land, TX
- State GDP YoY
- ▲ 3.95%
- F500 in state
- 110
Industry mix (Fortune 500 HQ in TX)
| Industry | F500 HQs | Revenue |
|---|---|---|
| Energy | 16 | $1,198B |
|
||
| Technology | 5 | $198B |
|
||
| Engineering / Construction | 4 | $72B |
|
||
| Energy Services | 3 | $60B |
|
||
| Utilities | 3 | $41B |
|
||
| Healthcare | 2 | $330B |
|
||
Price history
1 event — show timeline
- 2026-06-10 Listed $204,990 HARMLS
Property tax history
+22.9%/yrLatest (2025): $881 · +21.1% YoY. Source: county tax records.
Cash-flow waterfall
monthlySold comps — $/sqft
last 12 mo · ≤1 miLoading sold comps…